
RESEARCH AND TEACHING
Concept Maps for Structuring Instruction and as a Potential Assessment Tool in a Large Introductory Science Course
Journal of College Science Teaching—July/August 2020 (Volume 49, Issue 6)
By Carl-Georg Bank and Heidi Daxberger
Concept maps make connections between ideas apparent, and thus would seem ideally suited to demonstrate learning. Yet, they are not widely used by instructors, particularly in large university classes. In this paper we review the strengths and rationale behind concept maps and provide examples we have used to structure content for one of our introductory courses. A rubric that focuses on propositions was used to grade student-created concept maps on a final exam administered to 293 students. These grades are compared to those of multiple-choice questions, short answers, and an essay on the same exam. We find poor correlation between concept maps and the other instruments, and stronger correlations between short answers and multiple choice, as well as between short-answer content grades and essay writing grades. We speculate that concept maps may be less influenced by student language skills and short-term memory than written answers, and that concept maps should be used as an alternative assessment of higher order thinking skills.
Concept maps provide focus and allow connections between ideas to become apparent (see Figure 1). Such graphic arrangement of concepts and their links can assist students in understanding complex material, may reflect a student’s higher-order thinking, and are fast to grade. Despite these strengths, we are not aware that many instructors apply concept maps to assess students’ understanding of material. In this paper we summarize uses of concept maps and provide examples of how concept maps can be applied, including as an assessment tool in a large course.
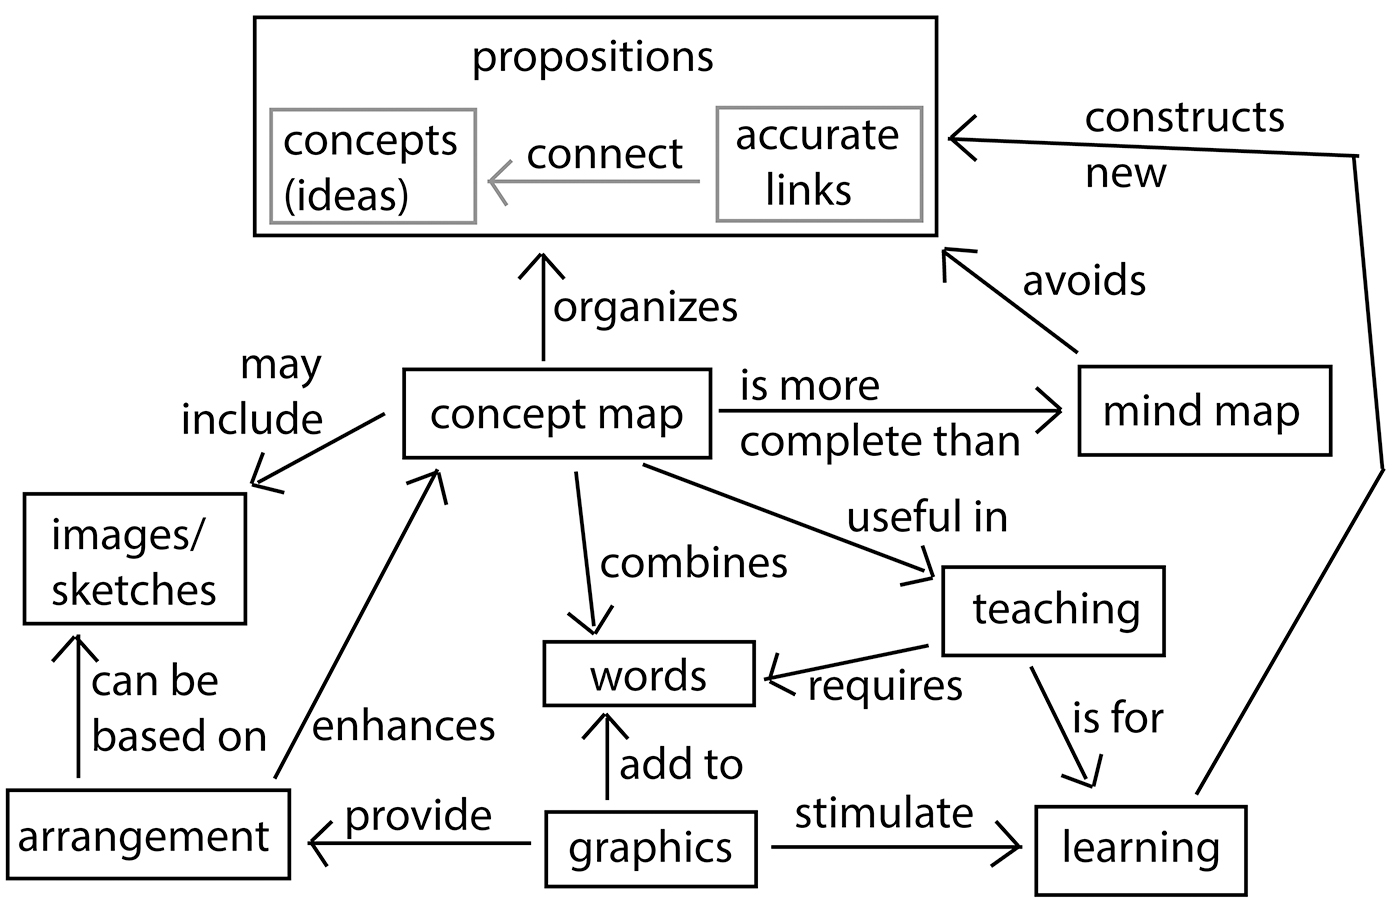
A concept map on concept maps. Boxed ideas (or concepts) are linked by labeled arrows; two linked ideas become one proposition.
Learning requires students to link new ideas to existing knowledge (Hay et al., 2008; Ambrose et al., 2010, chapter 2). Concept maps are graphical and textual representations of such links (Novak, 1990). Ideas, or concepts, are typically placed into circles or boxes and connected by labelled arrows. Two concepts linked by an arrow make up the basic unit of a concept map called a proposition (Bergan-Roller et al., 2018), which can typically be read as a simple sentence with nouns as concepts and verbs as links, a syntax common to the English language (Ingec, 2009).
Propositions are the key feature distinguishing concept maps from other graphical organizing instruments, for example mind maps (Eppler, 2006). The power of concept maps lies in the graphical arrangement showing relationships between ideas (Daley & Torre, 2010). Several authors note that strict concept maps are structured from overarching concepts at the top to examples at the bottom (e.g., Eppler, 2006), yet in several disciplines nonhierarchical maps are preferred (Hartmeyer et al., 2018). In this paper we follow this less strict definition of concept maps.
Language is our primary means to express thoughts, yet language has limits because it requires a linear progression of thoughts that may mask the interconnectedness of knowledge. Students face cognitive limits of working memory, and reading and writing requires familiarity with academic language, including precise vocabulary and nominalizations (Snow, 2010; Adesope et al., 2017). Advantages of concept maps are that they can use simple language and make apparent the interconnectedness between ideas. According to Kostovich et al. (2007), concept maps are helpful to learners across the learning style spectrum, and Defranco et al. (2015) claim that students’ preference to solving a problem is not correlated to the quality of their concept map. It is therefore unsurprising that concept maps are being used across all educational settings (Brandstaedter et al., 2012; Schwendimann, 2015) and disciplines, including medicine (Torre & Daley, 2018; Daley & Torre, 2010), business (Baumann, 2018), engineering (Defranco et al., 2015), statistics (Witmer, 2015), computer science (Gurupur et al., 2015), biology (Bergan-Roller et al., 2018; Dowd et al., 2015), physics (Ingec, 2009), and geosciences (McConnell et al., 2017; Rebich & Gautier, 2005).
Concept maps are meaningful at all stages of the learning process (Anohina-Naumeca, 2012). Instructors may use them to plan a lesson or course and share content with students (Novak, 1990). Students may be asked to complete a skeleton map (Novak & Canas, 2006; Torre et al., 2013) or develop one on their own (Novak, 1990). Iterative map construction with formative feedback promotes students’ reflection on their learning (Quinn et al., 2003; Cline et al., 2010; Daley & Torre, 2010; Romero et al., 2017), and collaboratively constructing a concept map has been shown to improve achievement (Novak & Canas, 2006; Gijlers & de Jong, 2013; Sadler et al., 2015; Schwendimann & Linn, 2016). Changes in quality and quantity of propositions over a term are representative of a student’s cognitive development (Hay et al, 2008; Cline et al., 2010). Students may show better understanding and improved scientific reasoning after instruction by either presenting more connections or by limiting their map to the most meaningful concepts and propositions (Dowd et al., 2015). Student-created concept maps may even help administrators recognize deficits in a curriculum (Wehry et al., 2012).
Traditionally, concept maps have been created with pen and paper. Computer-generated concept maps (Novak & Canas, 2006) allow the user to include interactive multimedia and hyperlinks (Tergan et al., 2006), are easy to generate and modify, and increase motivation and performance (Brandstaedter et al., 2012). They can also be effective for scoring, provided the software is user-friendly so students are not graded on their computer literacy (Weinerth et al., 2014). Additional computer software is being developed that can automatically extract propositions from a written assignment and produce a concept map to provide students with feedback on the cohesion of their written thoughts in the form of a visual summary (Villalon & Calvo, 2011; Zubrinic et al., 2012; Lachner et al., 2018).
Assessment of student learning using concept maps may be done either by quantitatively counting the number of correct concepts and propositions, or by qualitatively evaluating the comprehensiveness and structure via comparison to a master map, or by a combination of both approaches (Defranco et al., 2015; Joseph et al., 2017). A more nuanced assessment can be achieved by marking propositions as incorrect, plausible, or accurate (Bergan-Roller et al., 2018), by rating the quality of both concepts and links (Baumann, 2018), or by using a rubric to capture the knowledge structure (Watson et al., 2016). Efforts are underway to automate the assessment of electronically created concept maps (Ifenthaler, 2010; Gurupur et al., 2015; Iqbal et al., 2018). Software can count concept and links, may quantify the quality by comparing to a reference map, and can be used by students for self-assessment or iterative refinement (Cline et al., 2010). However, Strautmane (2017) cautions that analysis software is likely to miss correct propositions if they have equivalent meaning, and Won et al. (2017) conclude that concept maps may be limited as an assessment tool due to students’ inexperience, and especially when compared to validated multiple-choice questions. It is therefore important that teachers provide sound instruction on how to construct concept maps for these to be effective (e.g., six steps in Quinn et al., 2003).
In the following, we provide examples for concept maps created by the instructor and students in a large introductory geoscience class to highlight uses of concept maps, and evaluate their use as an assessment tool by comparing student scores from various parts of a final exam.
Setting and teaching materials
The course “Introductory Geology” was taught to 125 students in the summer of 2007 and to 168 students in the fall of 2007 at a large research-intensive public university. Most students took the courses to fulfill their science distribution credit; in both terms they were evenly divided between male and female, and about 10% were international students. The summer course was taught over six weeks compared to 12 weeks for the fall course, however course material remained the same.
The course was taught as a set of 12, two-hr meetings (10 lectures, one lab exercise, one test). Each lecture had a distinct theme focusing on one chapter of the textbook (Murck et al., 2008), and the connection between the lectures were revealed to students in the form of a concept map (Figure 2a) placed on the course syllabus and displayed at the start of each lecture. Lectures had their own summary concept map that was developed (by hand) on a tablet during class and then posted as a (typed) printable PDF on the course website (see example in Figure 2b; the complete set is available at nsta.org/online-connections-journal-college-science-teaching). This formed an implicit introduction to concept maps.
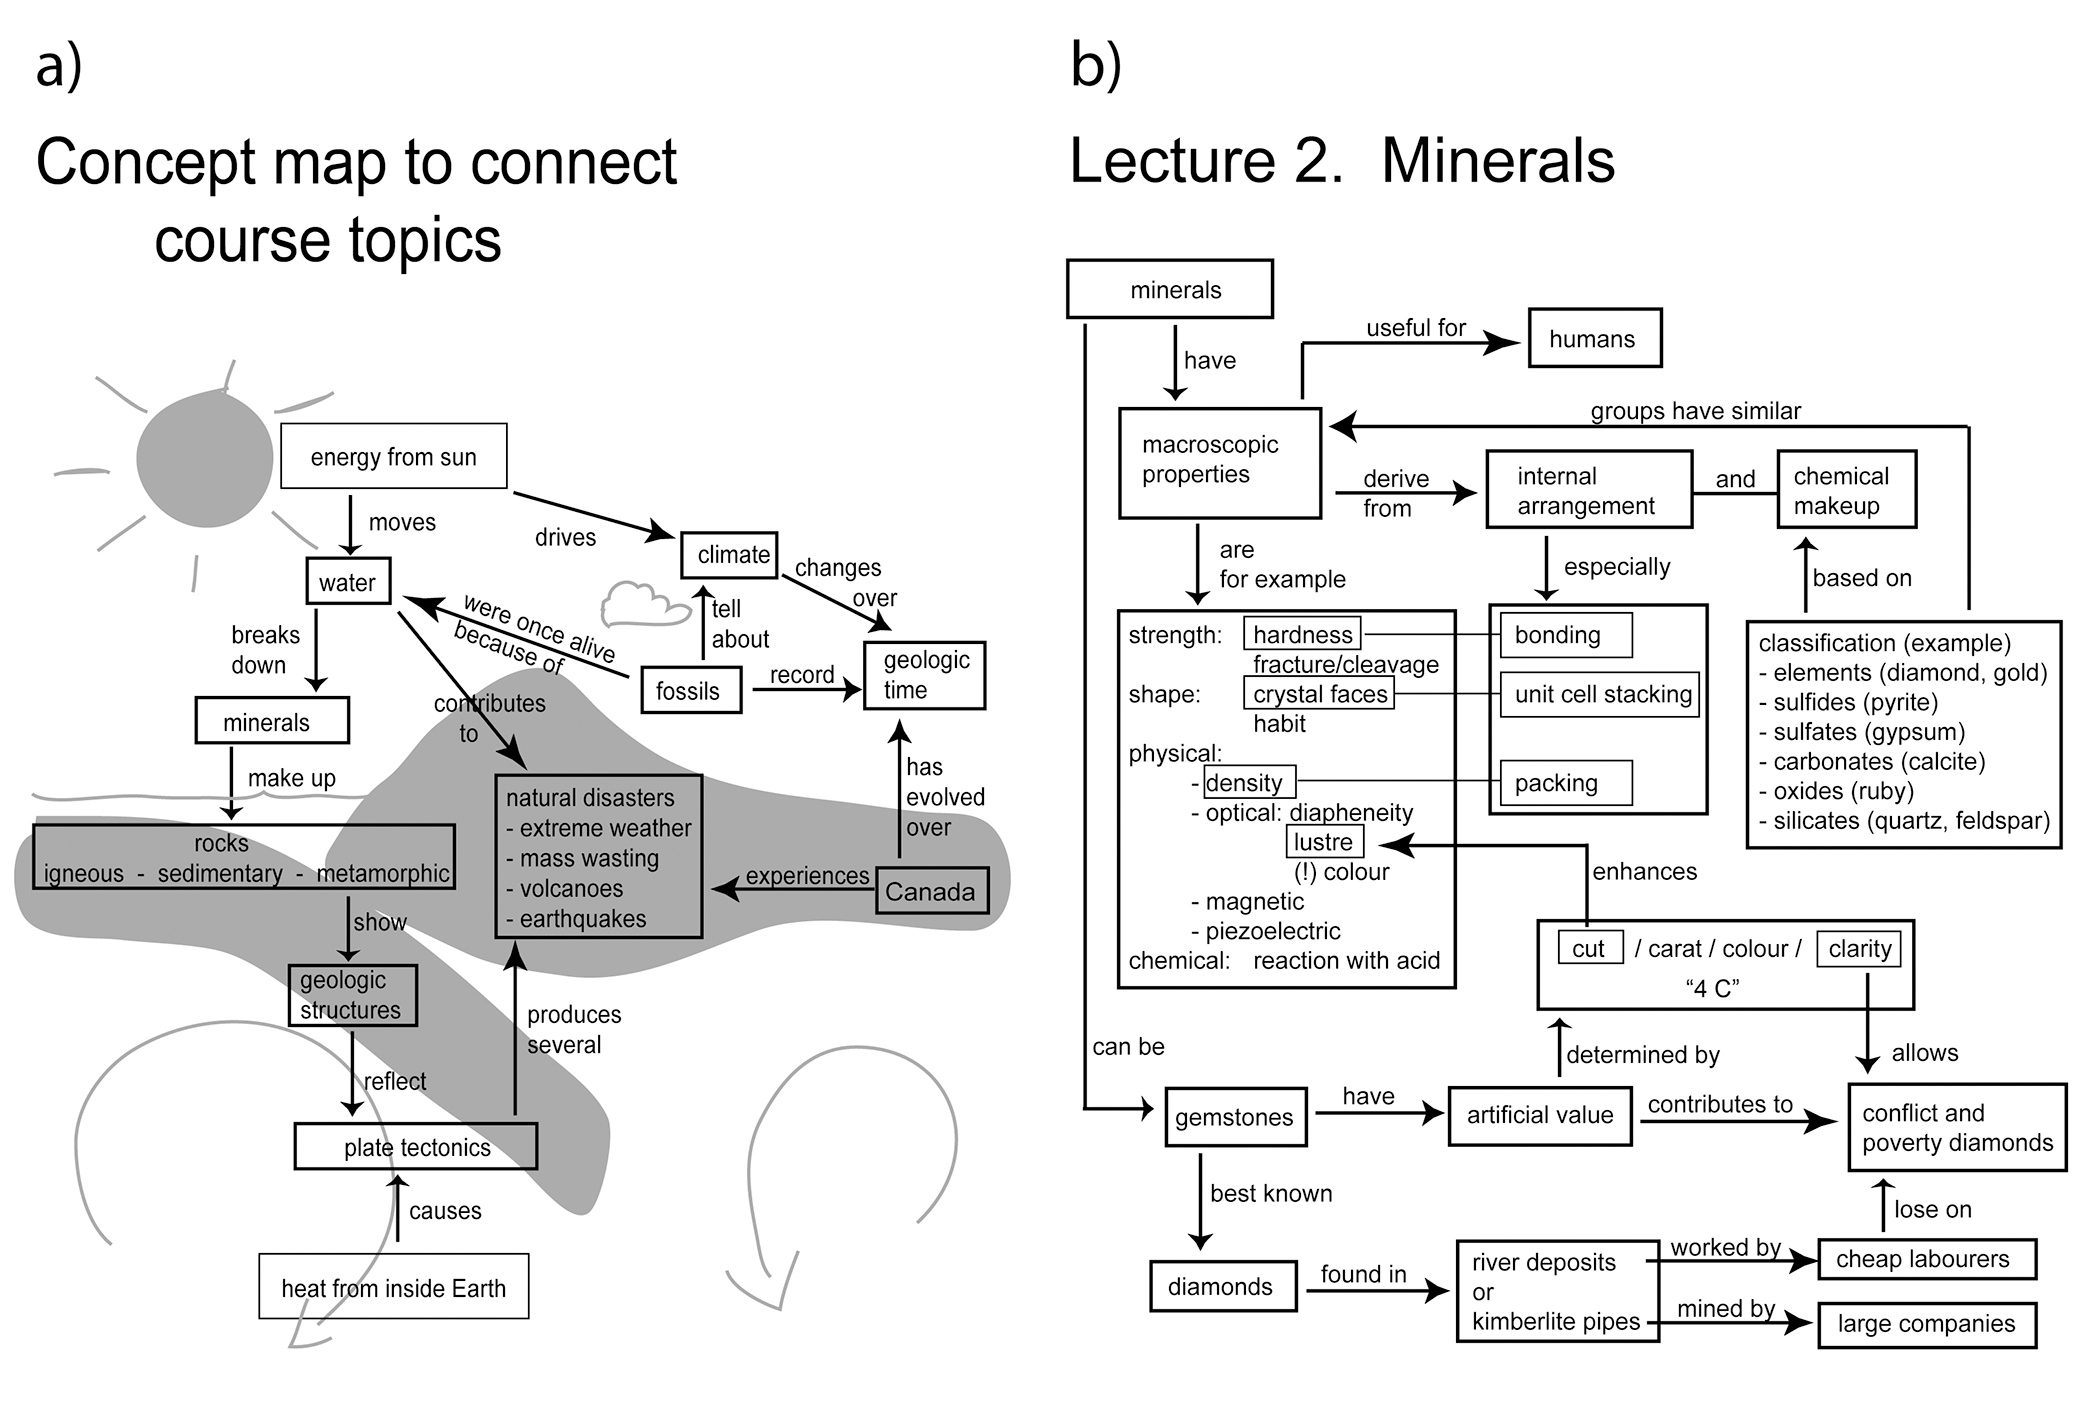
Course overview (a) and lecture summary (b) as example concept maps shown to students in class.
An explicit introduction to concept maps was done during the second lecture. The activity differentiated mind maps from concept maps and explained the idea of a proposition before asking students to individually prepare a concept map based on a few key ideas. A handout was posted on the course website to explain expectations and show examples of student-created maps.
When we first applied concept maps to assess student learning in the summer of 2006, we used a rubric developed by Stoddart et al. (2000). Follow-up input by students pointed out that the assessment of depth of explanation seemed rather subjective, and that complex propositions may produce chains in which single propositions no longer can stand alone. This input was used to develop a simpler quantitative measure, one that can be used to quickly grade a large number of maps. It allows for multiple alternative maps, expects propositions to be stand-alone, and equally weighs correct concepts or propositions. This new rubric (Figure 3) was introduced and discussed with students in our study, and applied to grade their concept maps.
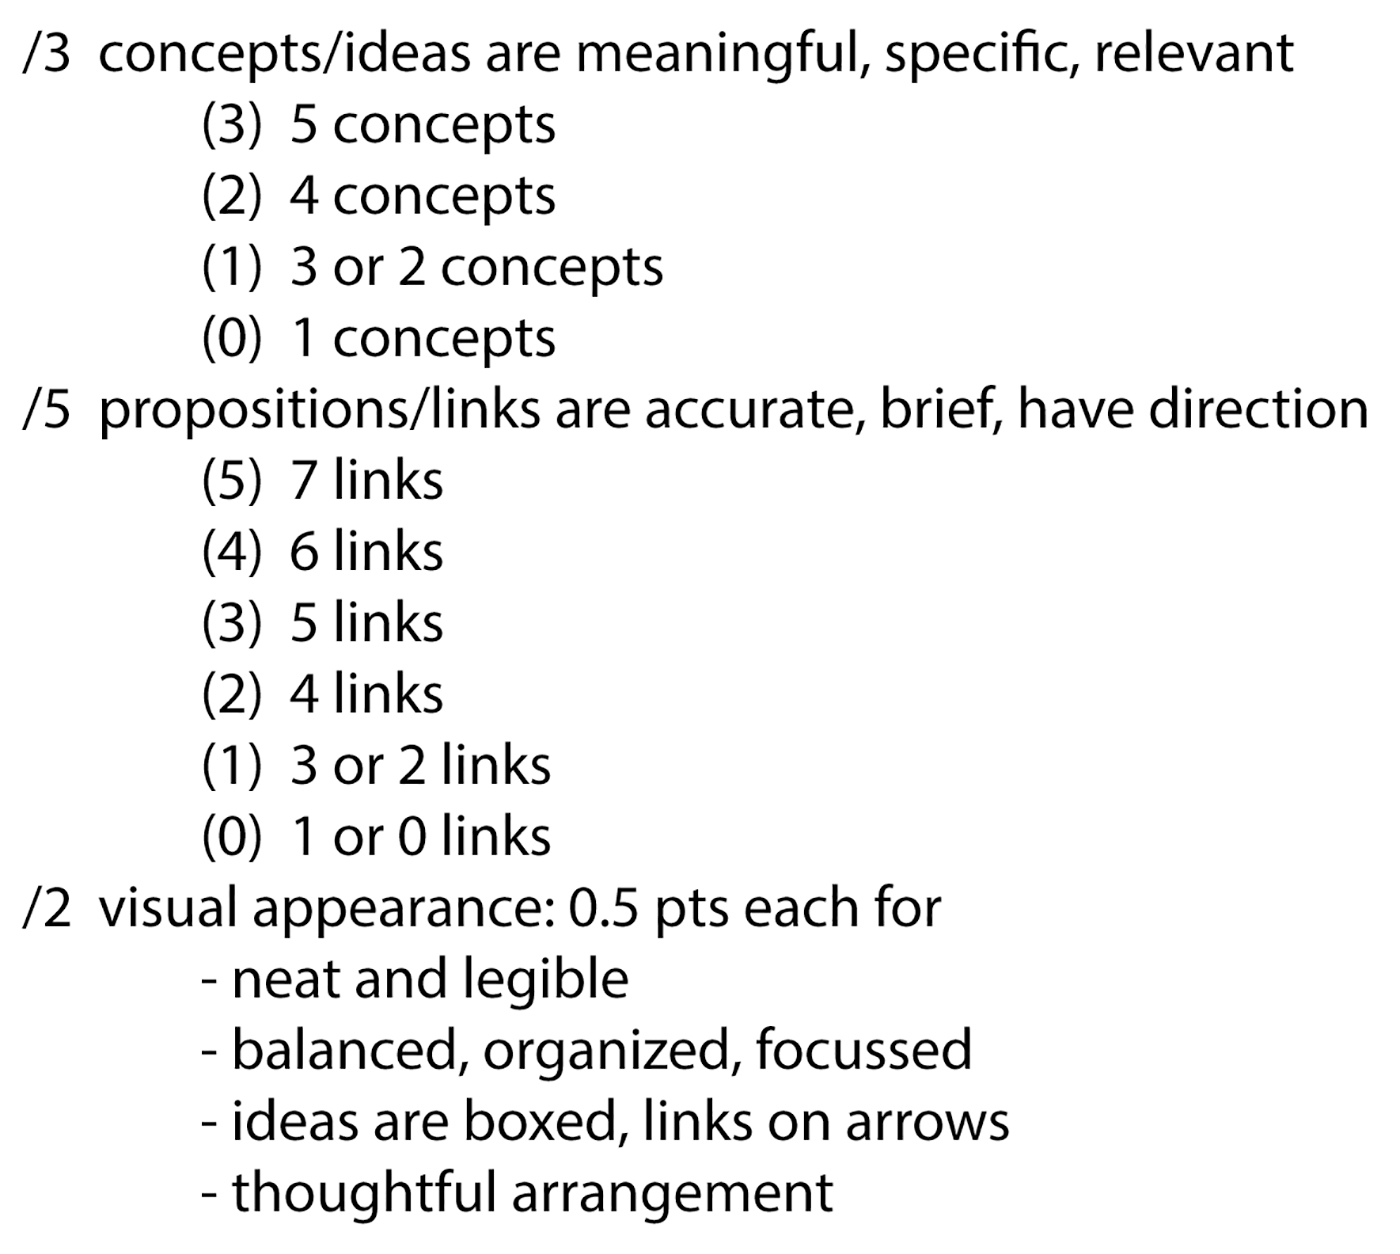
Rubric developed for fast grading of concept maps on the final exam.
The final exam (two hours in duration, worth 45% of the course grade) was cumulative and used four assessment instruments: multiple-choice questions (30 questions worth one point each, with four choices per item), short answers (10 questions worth two points each, answerable in point form or one sentence), a concept map, and a short (one-page) essay both worth 10 points. For the concept map and essay, students could select from a list of three broad topics (climate change or greenhouse gasses, one natural disaster, divergent plate boundaries). The essay was evaluated by grading separately the “four Cs” (Bank, 2006): content (five points), clarity (two points), coherence (two points), and craft (one point). This marking scheme had been introduced during the lab exercise. Samples of questions and scored student answers are displayed in Figure 4; for a copy of the final exam see supplementary materials.
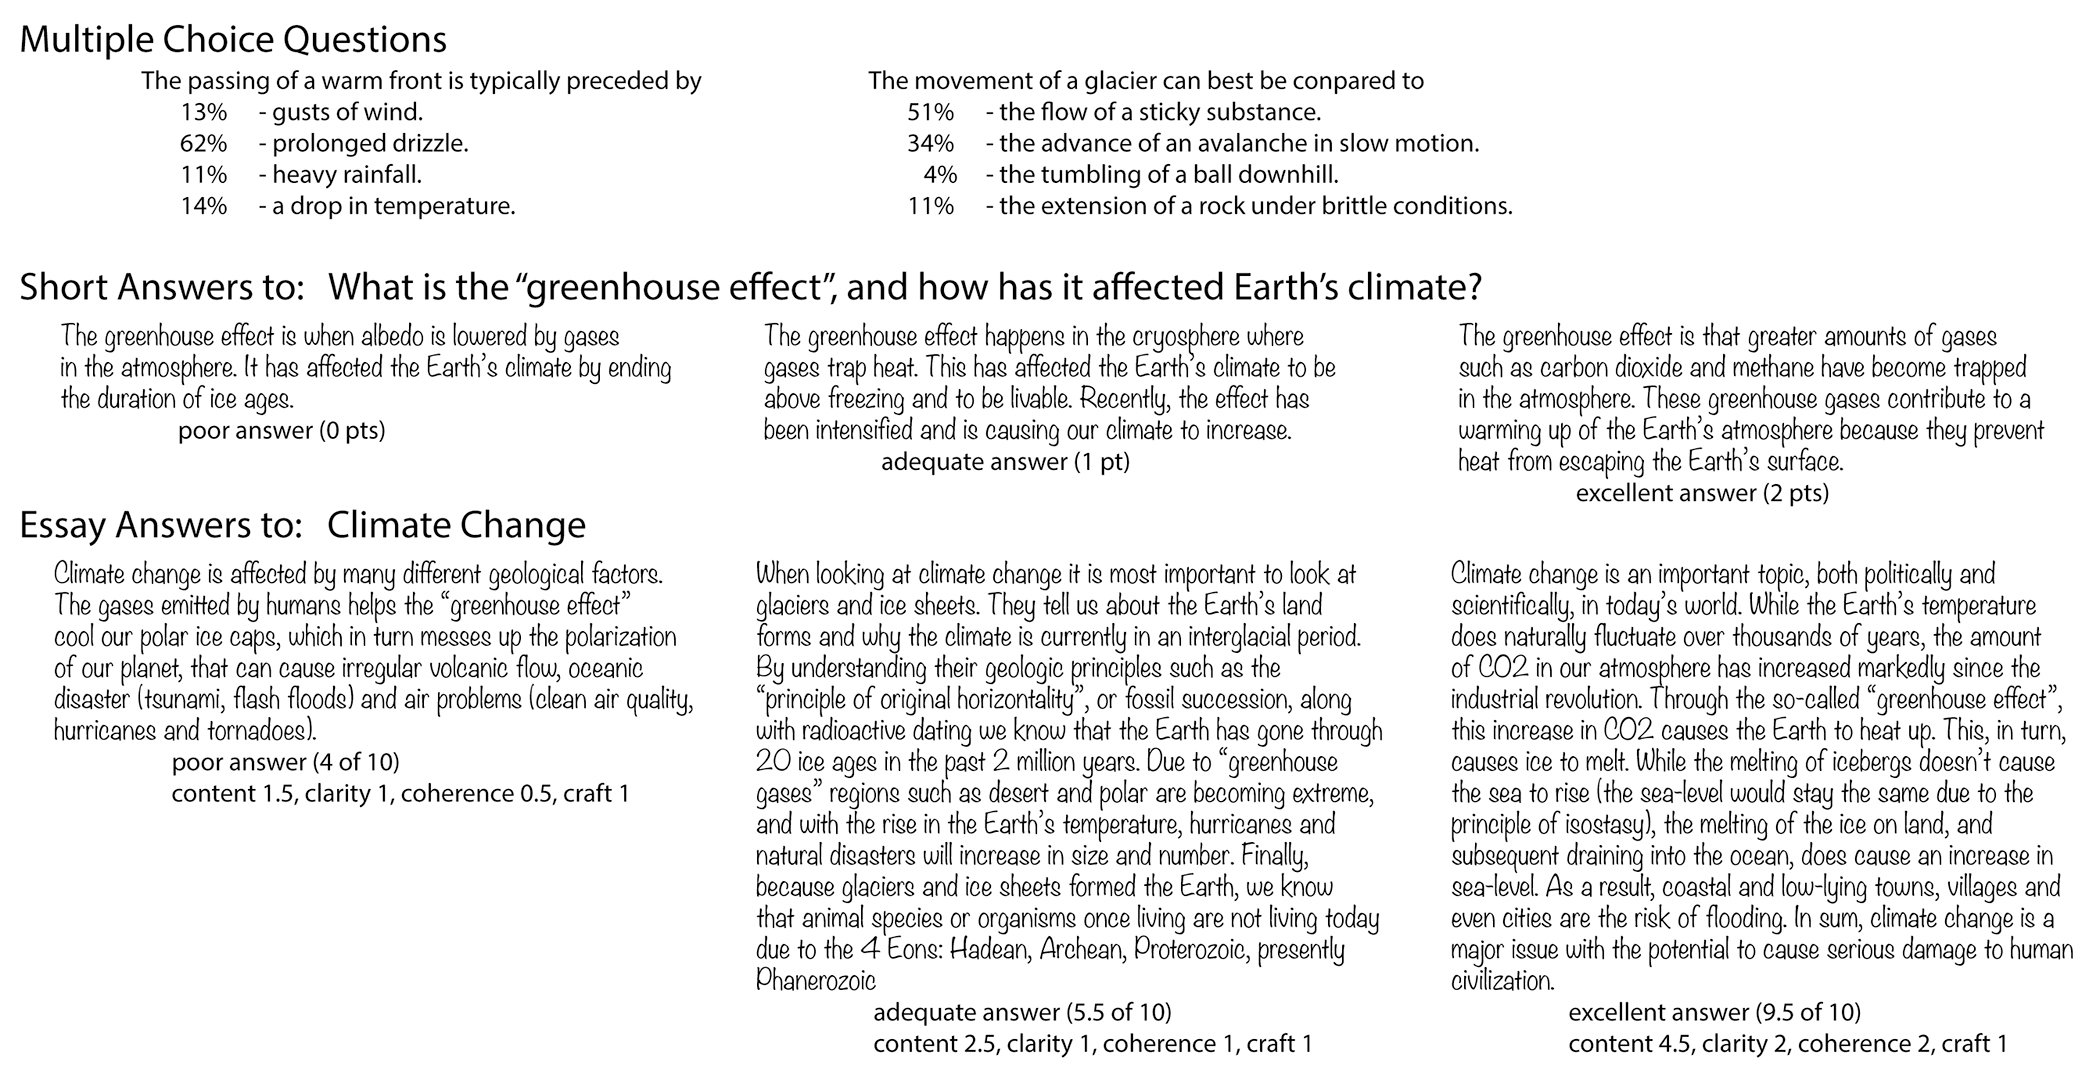
Questions and sample student answers on the theme “weather and climate” from the final exam. Percentages noted with multiple-choice answers indicate how many students chose that completion.
Examples of concept maps by students (redrawn electronically) from the final exam, as graded using the rubric from Figure 3, are shown in Figure 5 for different topics and scoring results. Concept maps with low scores tend to be linear arrangements, or ideas spreading out from the central idea. Intermediate scores may show some circular arrangements, and excellent scores resemble a web of interconnected ideas. We note that not all propositions that were counted as correct could be considered grammatically accurate sentences.
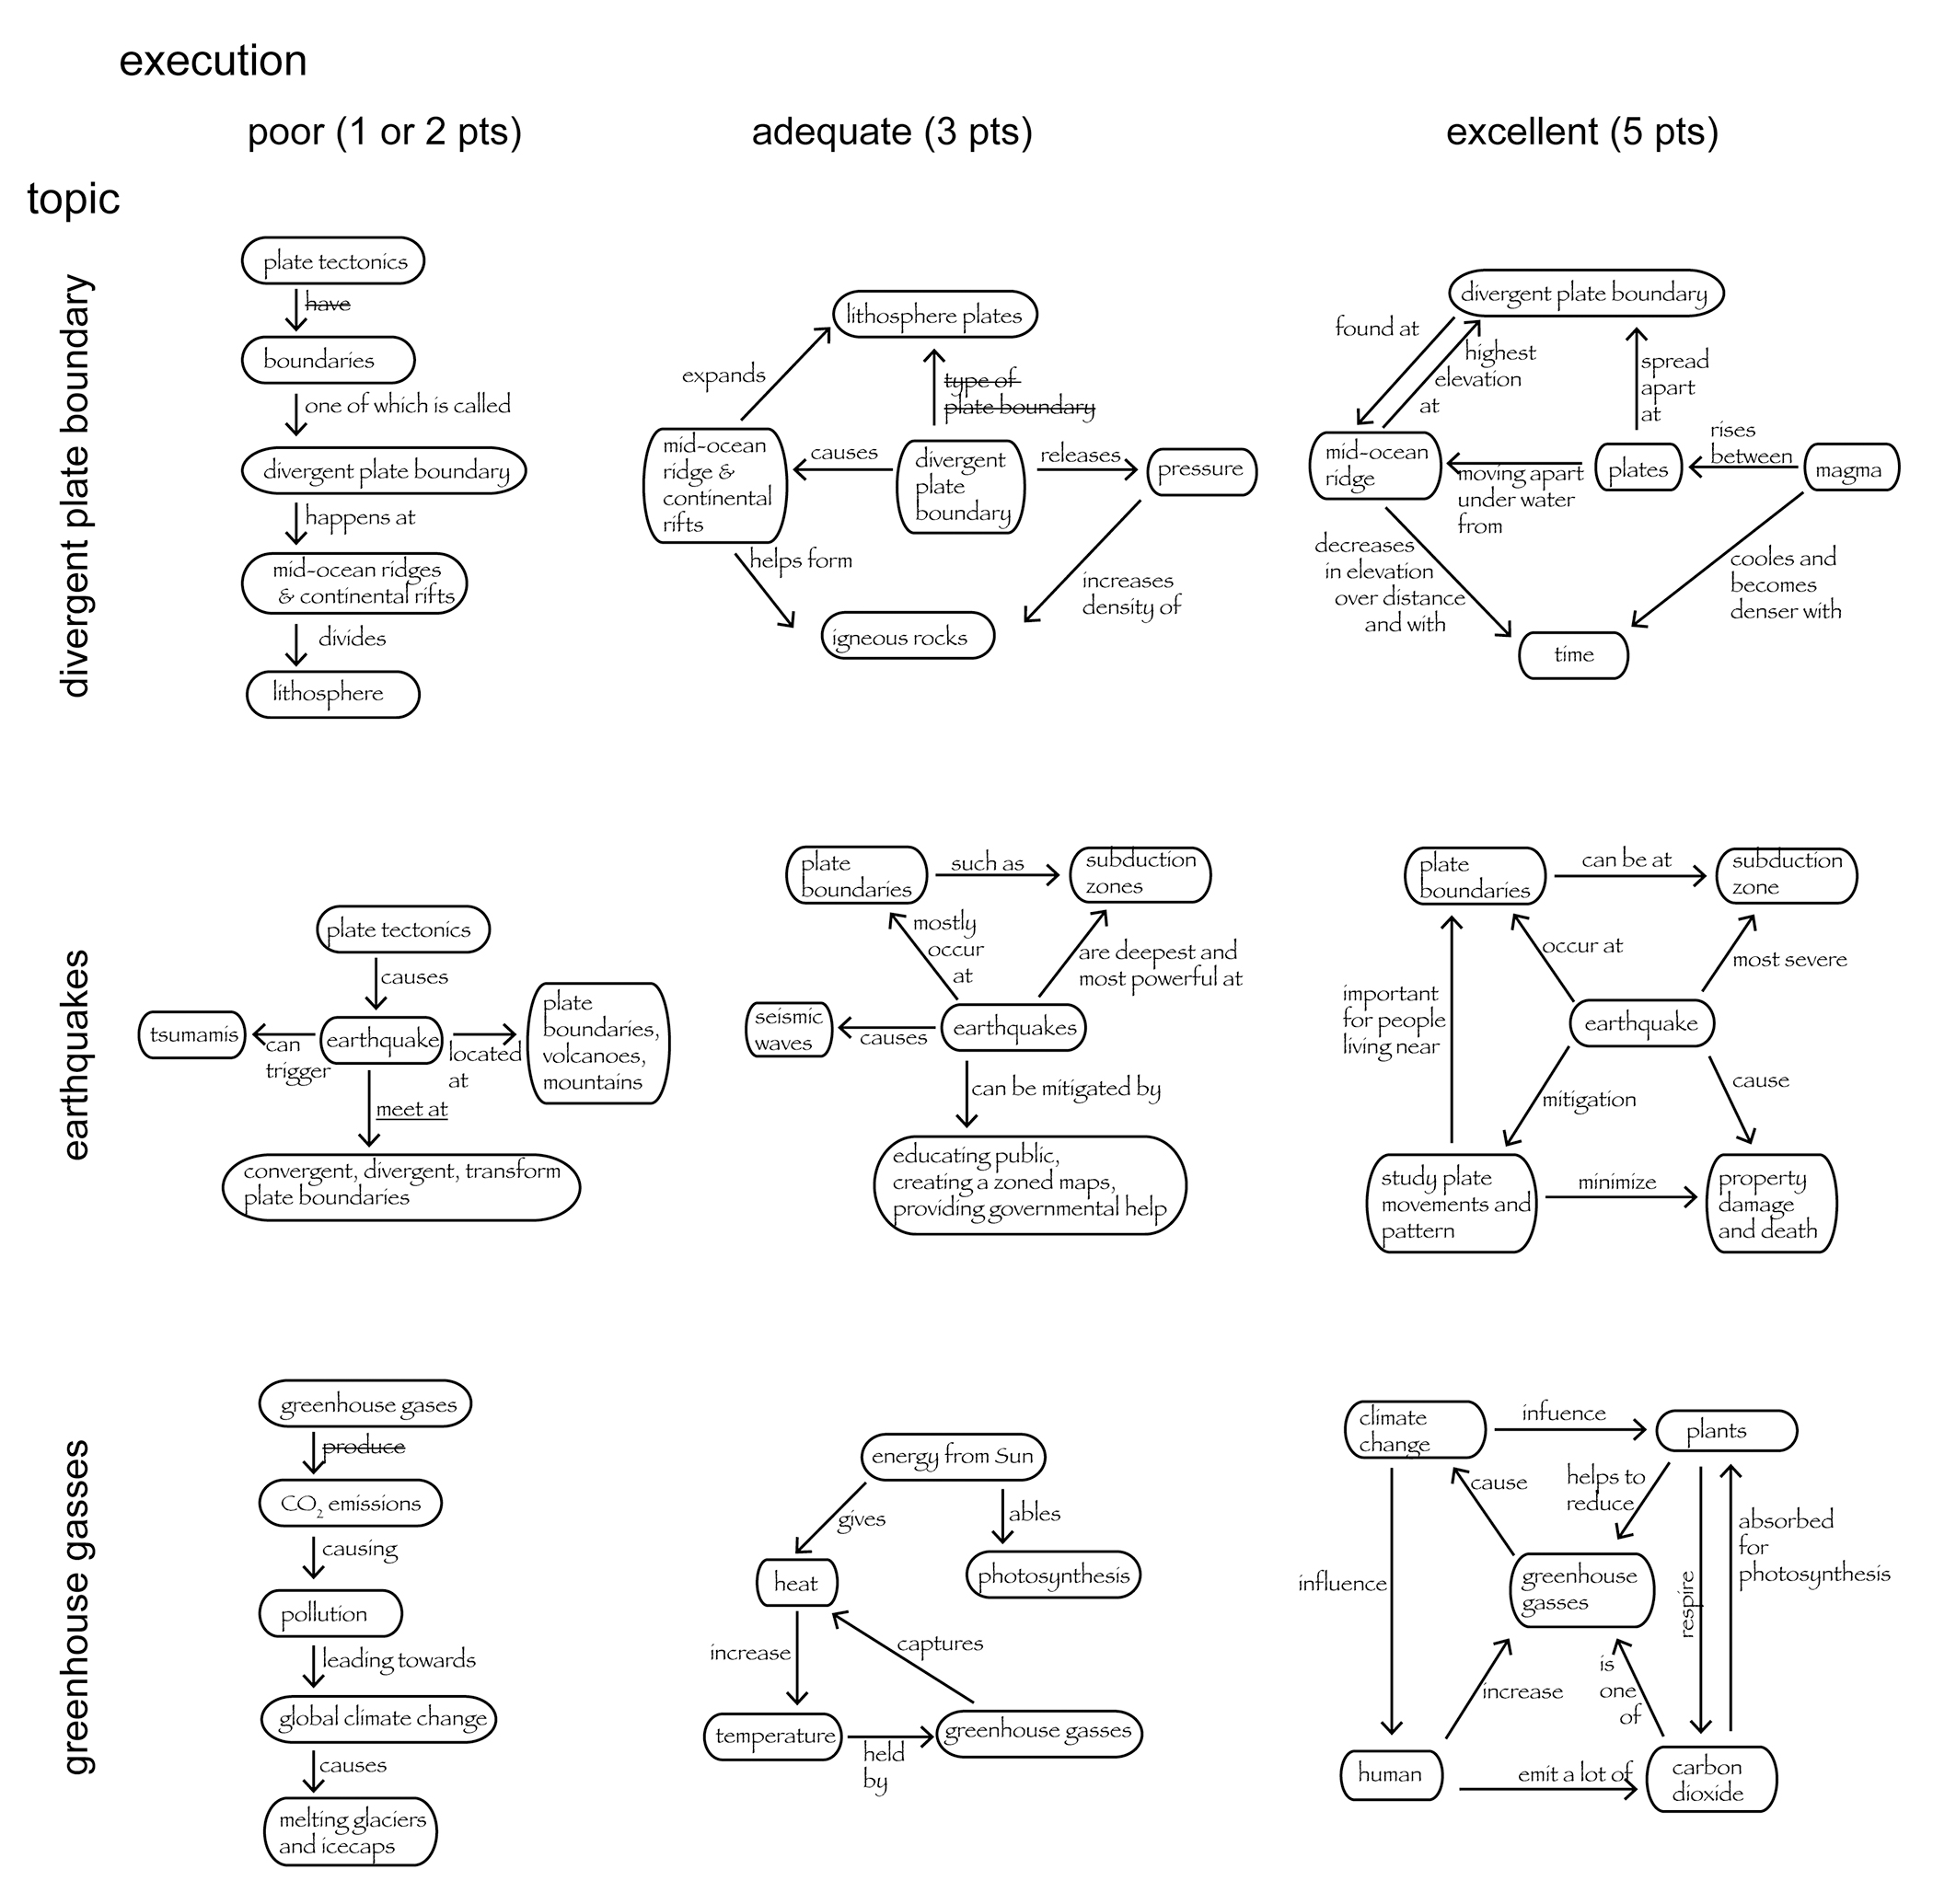
Examples of redrawn student concept maps from the final exam for the three topics with grading result. Text was copied verbatim, crossed out links are incorrect (zero points), while underlined are deemed acceptable (0.5 point).
Comparison of assessment instruments
The instructional team (course instructor and two teaching assistants) performed benchmark grading of random samples of concept maps and essays to validate and solidify rubrics and to discuss expectations. The team divided the tasks by answers rather than marking booklet by booklet to ensure consistency and reliability of the assessment.
Results for 293 exams were anonymized (i.e., the grades for the four instruments were extracted for this study and any information linking grades to individual students was removed). All students included five valid concepts in the concept maps they produced and we are disregarding the grade for visual appearance, therefore our analysis is solely based on the graded propositions. For the essay we are separating grades for the content from those for writing skills. The quantitative data analysis was done in MATLAB. We normalized the number of students to allow for displaying of percentages, and resulting distributions for each of the four assessment instruments plus essay writing skills are shown as histograms in Figure 6. Concept maps were mostly graded to full integers, therefore we decided to bin the grades accordingly. The multiple choice and short answer were binned into coarser steps so that all distributions are shown in five to 10 steps. Furthermore, we calculated means and standard deviations for each instruments’ grade distribution, and overlaid the histograms with the respective probability density functions. Most probability density functions fit well with the raw grade distributions, the exception being the essay content grades, which are skewed to higher values.
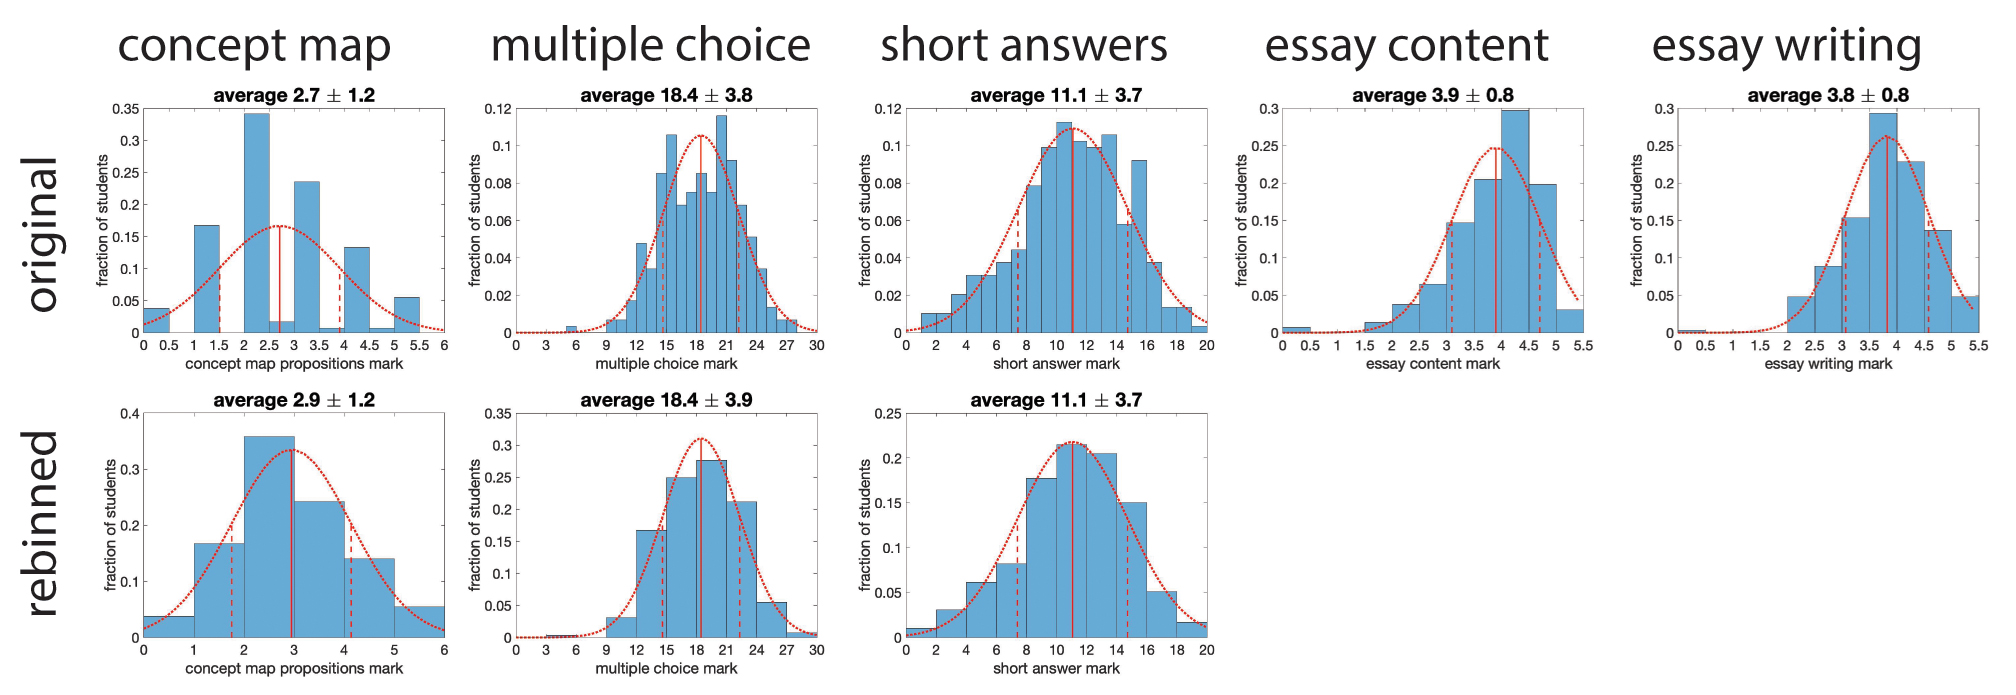
Distribution of marks and probability density functions for the various assessment instruments.
Correlations between pairs of assessment instrument grades are shown as heat maps (Figure 7), which are 2-D displays of a given data matrix and specify what percentage of students received a certain combination of grades (e.g., 12 points in short answer and three points on concept map propositions was achieved by 7% of students, Figure 7b). For the heat maps, we used the histogram bin sizes, added best-fitting lines, and calculated the correlation coefficient R. All correlations are weakly positive with R values ranging from 0.05 to 0.55. The lowest correlation value (R = 0.05, Figure 7a) is for the concept map-multiple choice pair, and the highest value is for the multiple choice-short answer pair (R = 0.55, Figure 7c). Essay content and writing grades also correlate well (R = 0.43, Figure 7k). The grade for concept map proposition quality correlates poorly with all other grades as indicated by low R values (Figure 7, left column). Specifically, we find that correlations between concept maps and three of the other four grades cluster on one value pair and do not spread out along the best-fit line (Figure 7a, d, and g).
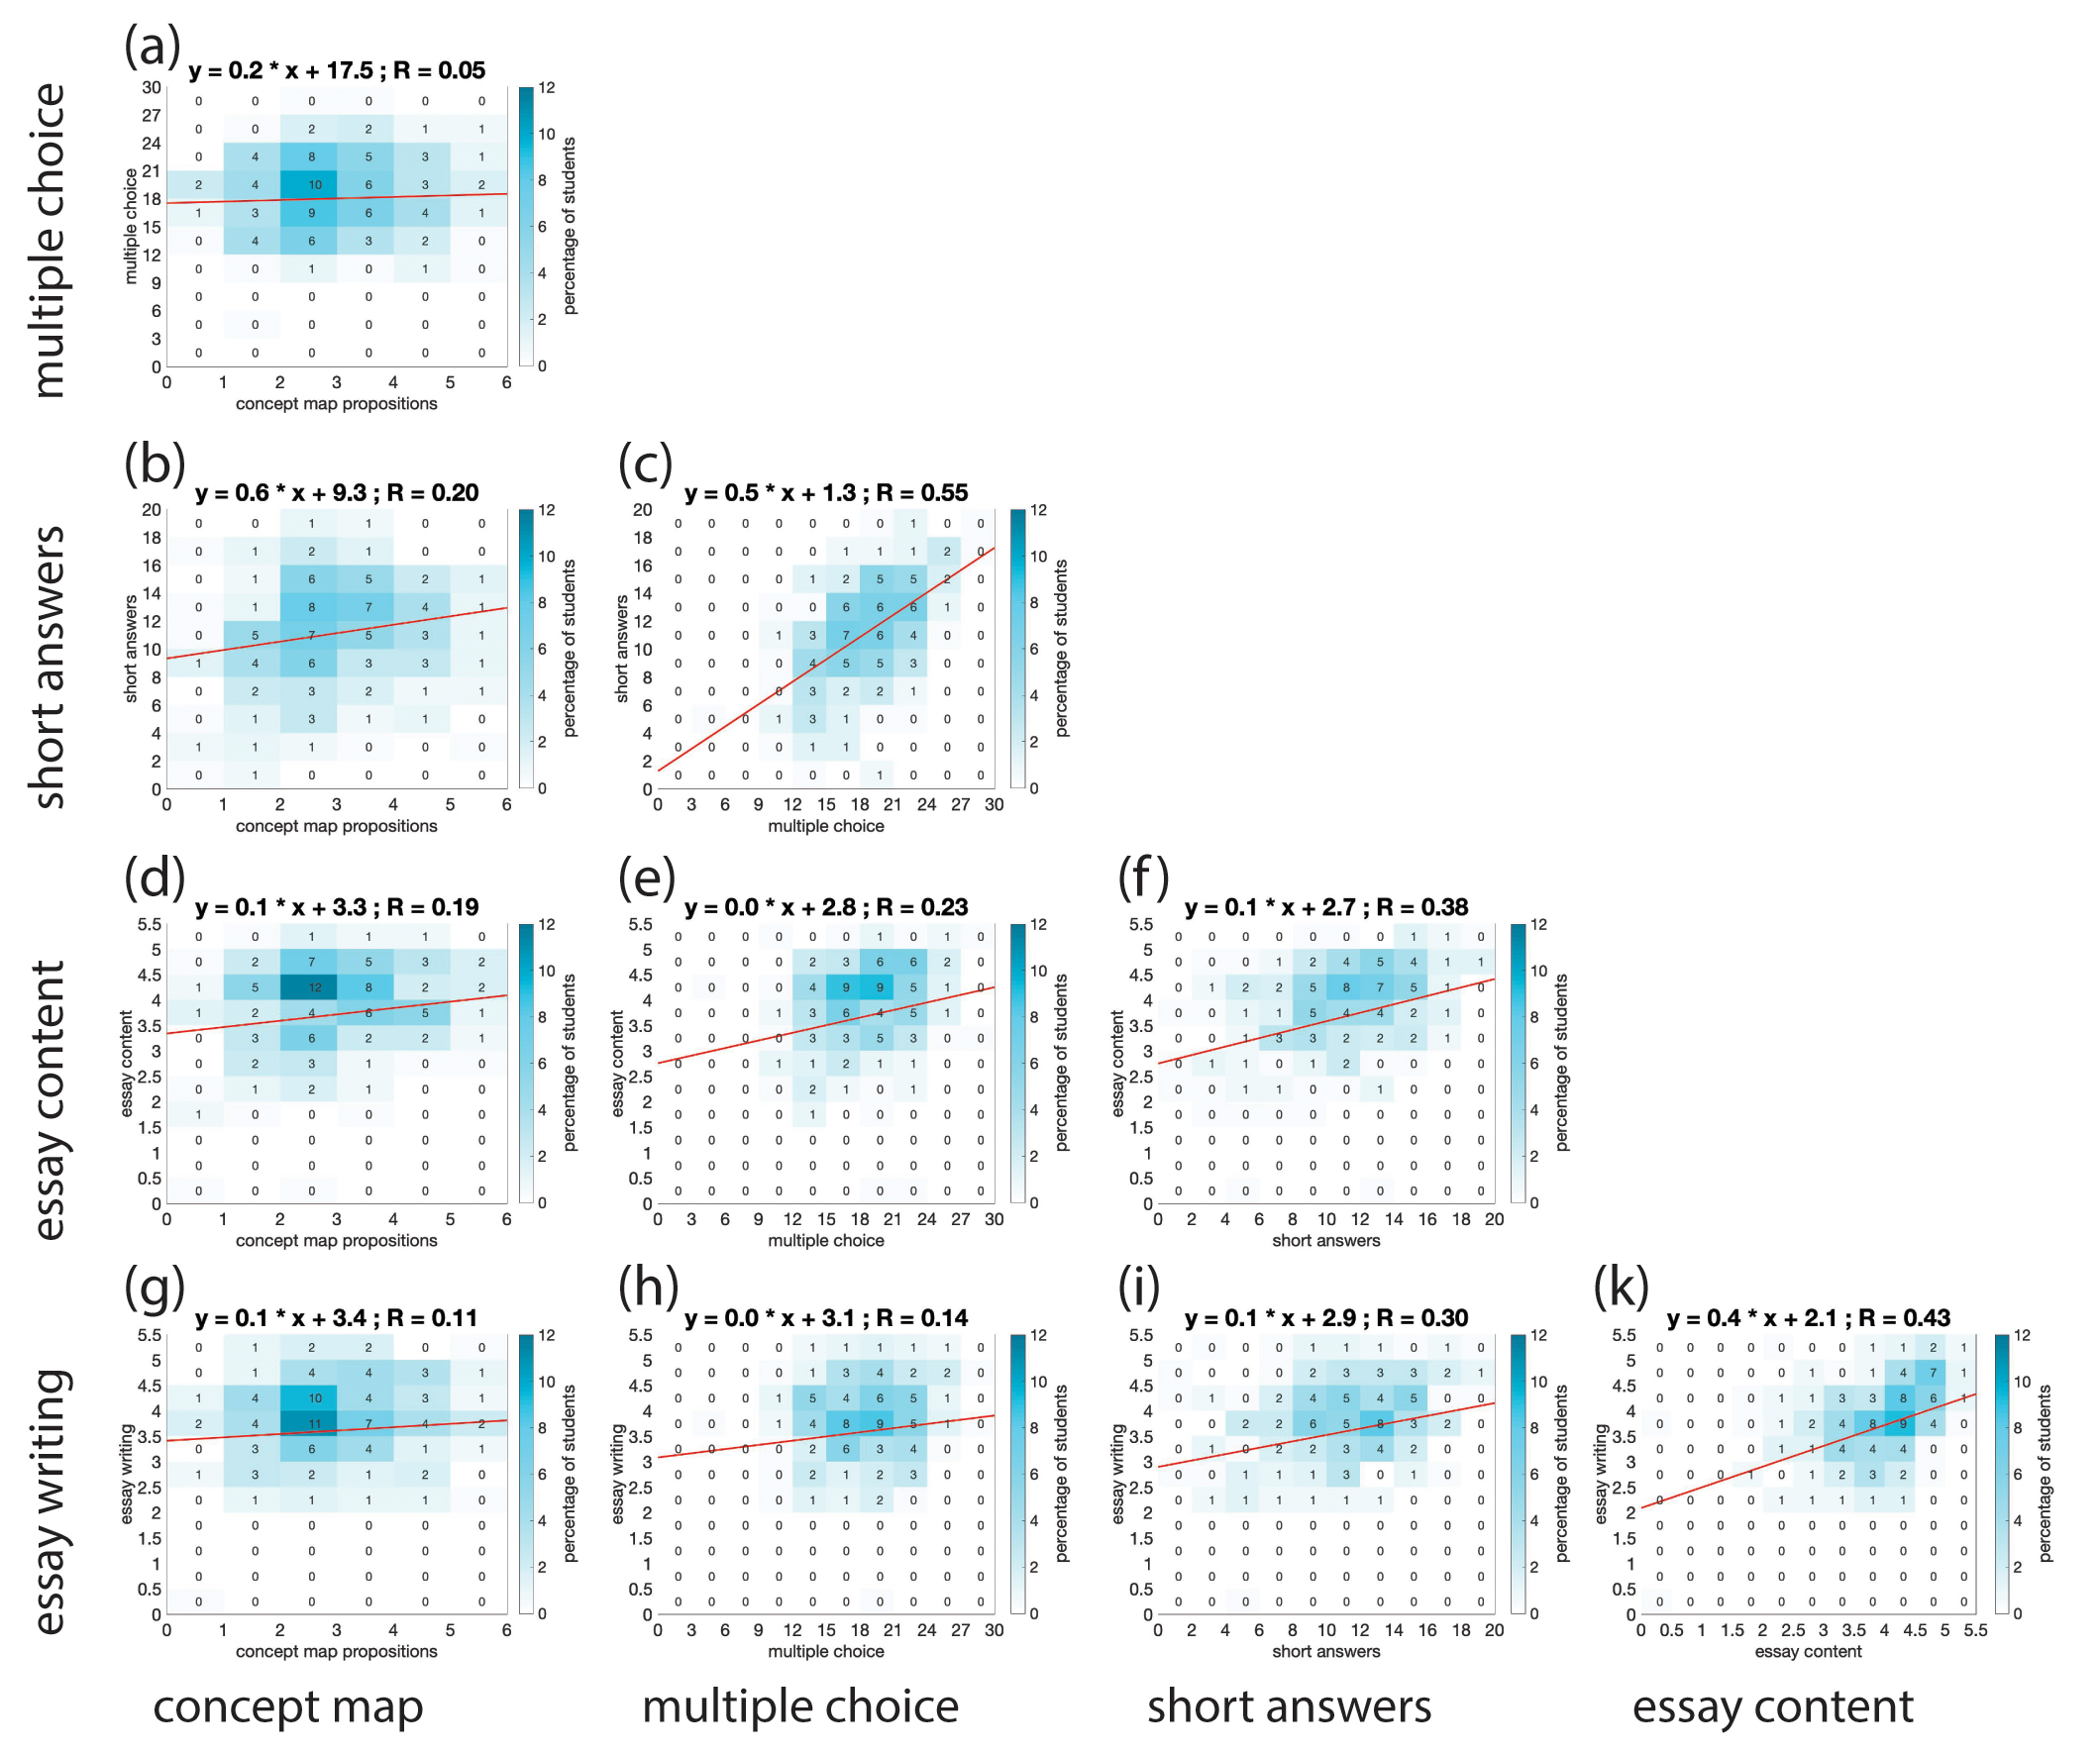
Correlations between the assessment instruments shown as heat maps, with percentages rounded to full integers.
All four assessment instruments used in our final exam produce reasonable distribution of grades and may therefore qualify as acceptable assessment tools, provided they measure stated learning outcomes. Because concept maps have not been widely adopted in large introductory courses, we were trying to compare their results to those determined by the other instruments. We find that concept maps correlate rather poorly with any of the other assessment tools, and that correlations among multiple choice, short answers, and essay are higher. This does not necessarily mean that our way of using concept maps for assessment is not valid or reliable. However, despite having introduced students to concept maps during the course, students may still be less familiar with this tool as they have not been used as widely in other courses.
Essay content and writing skills are reasonably correlated (Figure 7k). Essays were graded by the same person for both aspects. The good correlation we see for this pair of grades may therefore reflect the grader’s bias on either good writing skills or good content. However, short answers also correlate well with essay writing (Figure 7i), despite being graded by a different person. Moreover, students’ performance on multiple choice and concept maps seems to be less correlated to essay writing skills (Figure 7g, h). We therefore hypothesize that students’ writing skills influence their grades on assessment tools that implicitly require these skills.
The positive correlation we find between multiple choice and short answers (Figure 7c) may exist due to the nature of the respective questions. Several, though not all, of the multiple-choice questions in this exam were set to address lower-level learning (“recognizing-remembering”), while essay questions and concept maps intended to target higher-level thinking (“creating”) that is located at the opposite end of Blooms taxonomy (amended by Anderson and Krathwohl in the cognitive domain; see Nilsen, 2016, pg. 21). Although multiple-choice questions can be made complex, students always have the opportunity to guess a correct answer. Essay questions may ask students to describe a simple idea rather than provide a thoughtful discussion. We think that our instrument questions are nuanced, yet allow that the short answers and multiple-choice questions in our exam may emphasize memorized definitions instead of asking for a deeper understanding of the underlying concepts and the interconnections of ideas. We advocate for the use of concept maps, as these require students to consider connections, and thus seem suitable to assess their higher-order thinking skills.
Assessment of student learning should be based on a variety of instruments (Fenwick & Parsons, 2000). As the data for concept maps do not correlate with any other assessment instruments grades, concept maps could be valuable as an alternative assessment tool that tests a different skill set than the more common tools. Given the limited number of instruments that are feasible in larger courses, we propose that concept maps are an underutilized evaluation tool and that their use may have positive effects for students, especially those without strong writing skills, but who have a deeper understanding of concepts and interrelations.
When looking at the analysis results, we have to keep in mind that our comparison of grades has several limitations. First, the data comparison is based on one exam, a stressful situation for students where they have to produce results within a very short time. Grade data may also slightly be skewed toward multiple-choice and short answers that are instruments students in lower-level courses are most familiar with in exam situations, compared to the newly introduced concept map. For the essay and concept map, students had to choose from the same topic list and may not have been equally confident in knowledge for both topics. The different instruments target a variety of concepts, therefore we are not comparing the exact same knowledge between the assessment tools. Both essay writing and the concept map task have a small range of points (up to five) in comparison to multiple-choice (30) and short-answer questions (20). Finally, our study does not account for modifying characteristics of the students, including their cultural background and academic preparation (e.g., writing efficacy, study program, confidence, or learning styles).
Although our interpretation is limited, our comparison is pointing at new questions that warrant further investigation. Do concept maps reflect students’ overall learning in a course? How do concept maps compare to forced response and written answers? Are concept maps less influenced by student language skills and memorizing aptitude than other, more common, instruments? Can concept maps provide a time-efficient way to assess students’ deeper learning? How do students’ backgrounds affect their performance on concept map questions? Addressing such questions would require a more detailed study, which may include the use of a validated catalog of multiple-choice questions (e.g., the Geoscience Concept Inventory, see Libarkin et al., 2011) as base comparator, and require students to produce several concept maps and short essays over the course of a semester on a range of topics to target overlapping concepts and paint a more comprehensive picture.
Conclusion
The goal of this paper is to remind instructors about the value of concept maps for learning and as an alternative way for students to show knowledge. We provide background about concept maps from the literature, show examples of concept maps, and offer a rubric that allows for quick assessment of a small concept map on final exams. Our comparison of exam grades prompts us to come up with several speculative hypotheses that require a larger study to address these. However, student inexperience with concept maps as noted by Won et al. (2017) is probably the biggest limitation of our study. This obstacle could be alleviated if more instructors were to use concept maps for organizing course content and assessing student learning.
Carl-Georg Bank (charly.bank@utoronto.ca) is an associate professor, Teaching Stream, in the Department of Earth Sciences at the University of Toronto in Toronto, Ontario. Heidi Daxberger is an assistant professor, Teaching Stream, in the Department of Physical and Environmental Sciences at the University of Toronto Scarborough in Toronto, Ontario.
Assessment Preservice Science Education Teacher Preparation Postsecondary