
Research & Teaching
An Undergraduate Independent Study Project
Using a Lateral Flow Assay to Detect Troponin
Journal of College Science Teaching—July/August 2023 (Volume 52, Issue 6)
By Ellie Schilling, Joy Sandman, Rida Sait, April Stich, Kwaku Baryeh, and Gifty Blankson
A lateral flow assay was designed and optimized as an independent study project that aimed to develop an assay for the qualitative detection of troponin assay. Lateral flow assays (the classic example being a pregnancy test) have the advantage of being rapid, specific, and user-friendly. They are composed of an absorbent pad, a nitrocellulose membrane, a conjugate pad, and a sample pad with laminated backing. The nitrocellulose membrane is marked with antibodies at a control line and test line, which change color to red when troponin is detected. When there is no troponin, only the control line changes color. We systematically developed the device by conjugating gold nanoparticles to a cardiac troponin antibody and tested for the presence and absence of troponin. The device we assembled allowed for troponin detection at a 500 nanograms per milliliter (ng/ml) concentration with a red color development at both control and test lines.
Faculty-mentored independent study at the undergraduate level can enable students to gain research experience. Our university introduces undergraduate students to the nuances of research through opportunities to conduct research and pursue independent study projects. These projects encourage student researchers to be creative and willing to take risks while learning about science. Through research, students can understand that failure is an option and an everyday occurrence in scientific research (Hensel, 2018). The work described in this article details the design of a lateral flow assay to detect troponin as an undergraduate research project.
Lateral flow assays (LFA) such as over-the-counter pregnancy tests provide a quick, easy, and qualitative way of detecting levels of antigens or markers of interest. These devices circumvent the need for sophisticated equipment and facilities, highly trained human resources, and multiple hours or days before obtaining test results. LFAs can also be used at home or the point of care, enabling rapid diagnosis and therapy. The conventional LFA comprises a sample pad, a conjugate pad, nitrocellulose, and an absorbent pad on a laminated plastic backing, with the flow going from the sample pad to the absorbent pad (Figure 1). The nitrocellulose membrane is marked with a test line and a control line that aid in detection. For our assay, the sample pad acts as the filter, removing any extra materials that could affect the assay. The conjugate pad contains an anticardiac troponin antibody conjugated with a gold nanoparticle that binds to the troponin (the antigen). The antigen is placed on the sample pad, where it flows and attaches to the gold nanoparticle–conjugated antibody. The antigen-bound–antibody gold nanoparticle conjugate then flows into the nitrocellulose membrane, where it binds to an antibody on the test line. If the troponin is present, the test line changes color to red; in the absence of the antigen, the test line remains colorless. The solution then flows to the control line, which will change color to red in both the presence and absence of the troponin. The control line also contains an antibody that interacts with the conjugate pad antibody. The absorbent pad absorbs any extra fluid.
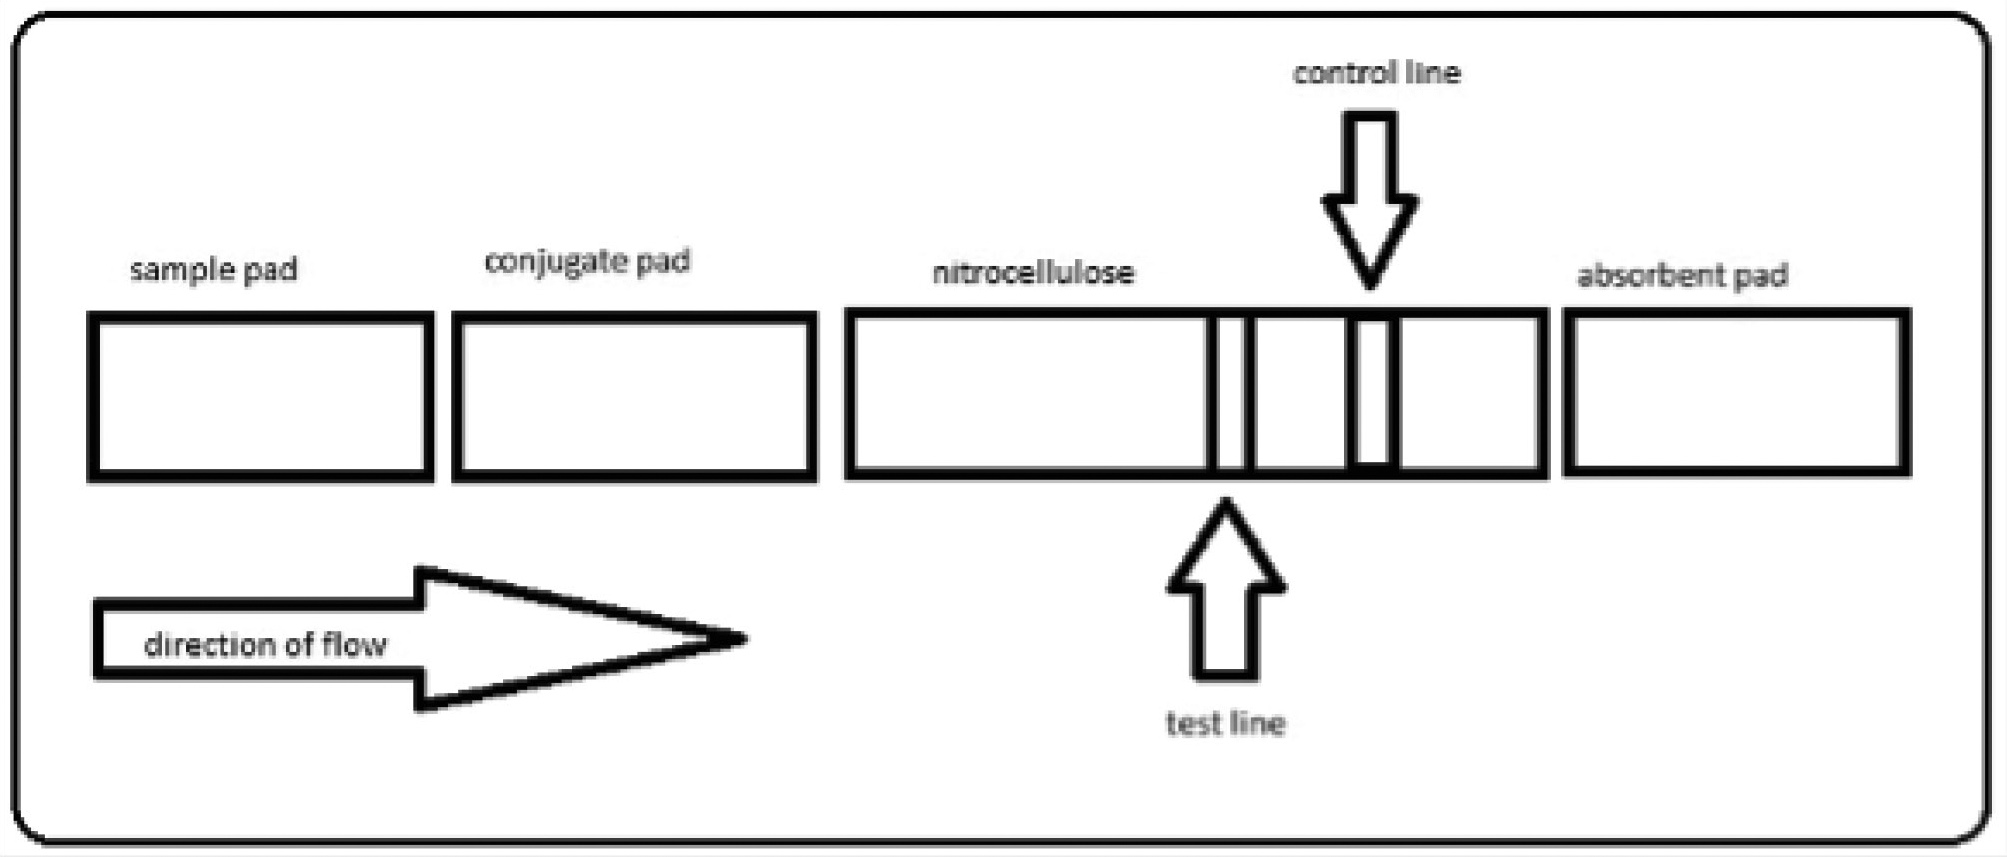
A visual representation of the components of a lateral flow device.
Note. The plastic backing is not shown.
Aside from the color change used in our assays, LFAs can also have fluorescence, chemiluminescence, and electrochemical detection methods. Each detection method has varying sensitivity levels. A positive test is obtained in our colorimetric assay when both the test and control lines become red. A negative test has a clear test line and a red control line. If the control line does not change color to red, the test is null, indicating an error with the device (Figure 2).
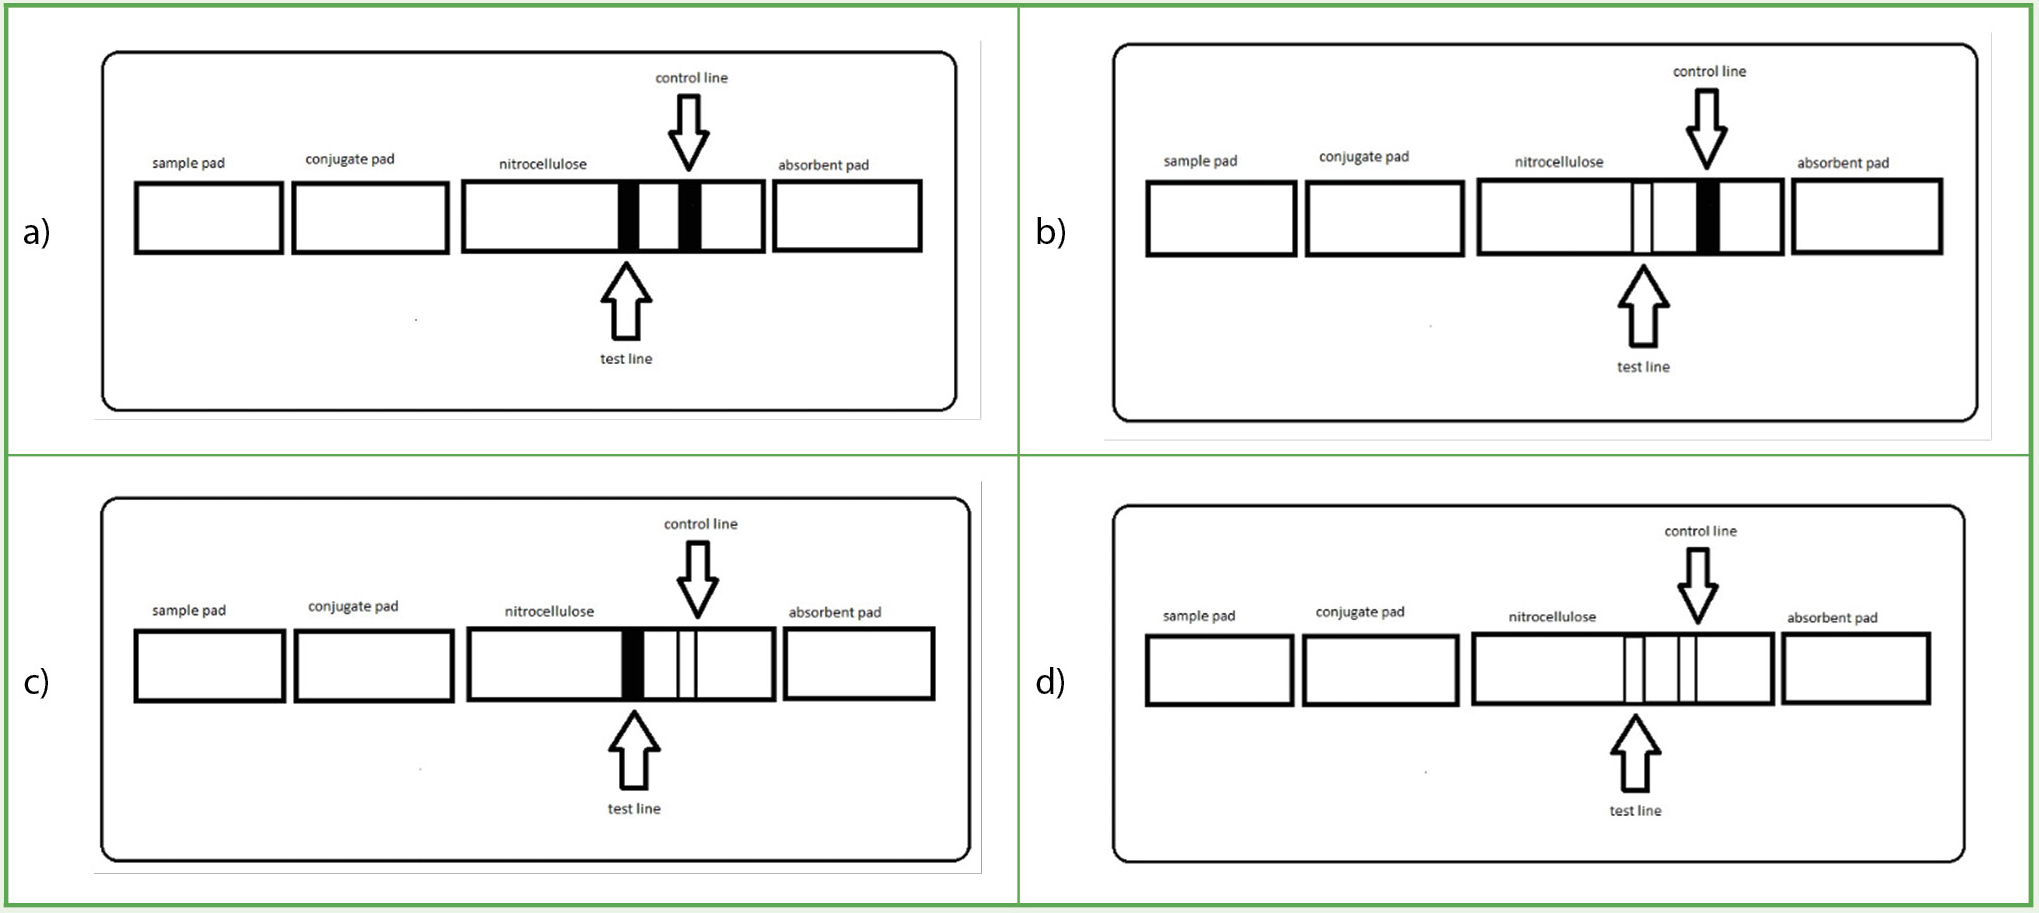
A visual representation of the various combinations possible in a lateral flow assay.
Note. The images describe an ideal positive (a) versus negative (b) lateral flow assay. There are also instances after a run when the device is defective or overconcentrated with analyte, and thus the results are null (c, d).
Cardiac troponin proteins control the contractile activity of cardiac muscles, and injury or damage to the muscles leads to a release of troponin into the bloodstream. Although other cardiac injury biomarker proteins (e.g., creatine kinase and myoglobin) exist, troponin is the gold standard (Han & Kim, 2020). An assay for cardiac troponin I (cTnI), which is user-friendly, inexpensive, and quick, will be vital in myocardial infarction diagnosis. There are several publications on LFAs for cardiac troponin detection that use various formats such as chemiluminescence (Han & Kim, 2020), simultaneous detection with myoglobin (Zhu et al., 2011), and dual gold nanoparticle conjugation (Choi et al., 2010). Following these publications, we adapted the literature to the limitations of an undergraduate institution: few resources, reduced time for student research, and the absence of some equipment. To overcome these challenges, we aimed to start from basic principles to teach the concepts involved in scientific experimental design.
Materials and method
Materials
The cardiac troponin I antibodies included clone 8E10 from Sigma Aldrich, clone 19C7 from ThermoFisher and Abcam, clone 4T21 (C5) from Hytest, clone M1709TI2 from Fitzgerald, and clone M1709TI1 from Fitzgerald. Cardiac troponin I came from Lee BioSolutions. We also used gold nanoparticles (10 nanometers [nm], 15 nm, and 40 nm unconjugated gold colloid solution) from Ted Pella, Inc. Other materials included gold chloride trihydrate (HAuCl4), trisodium citrate, Tween 20, sucrose, trisodium phosphate (Na3PO4), and Goat Anti-Mouse IgG (M8642). The fiber pads used were CFSP001700 from Sigma Aldrich. We also used phosphate-buffered saline (PBS), bovine serum albumin (BSA), polyvinylpyrrolidone (PVP), polyethylene glycol (PEG; Mr = ٨٠٠٠), and sodium hydroxide. Additional materials included Whatman FF120HP nitrocellulose membrane, Whatman Standard 14 sample pads, and 100% cotton (1873 µm thickness) sheets from Cytiva.
To create Storage Solution 1, we used 20 mM of sodium phosphate buffer (pH 7), 0.25% Tween 20, 10% sucrose, and 5% BSA. For Storage Solution 2, we used 50 mM of sodium phosphate buffer (pH 7.8) containing 5% PVP (weight per volume [wt/vol]), 1.25% sucrose (wt/vol) 0.05% wt/vol, 0.05% PEG 8000 (wt/vol), 0.2% (wt/vol), and 0.05% Tween 20 (vol/vol). For Storage Solution 3, we used 20 mM of sodium phosphate (Na3PO4), 0.25% Tween 20, 10% sucrose, and 5% BSA.
Method
Preparation of gold nanoparticles
A flask and magnetic stirrer were cleaned with aqua-regia (3HCl:1HNO3) overnight and washed with distilled water. We added 50 uL of 50% (w/v) HAuCl4 to 250 ml MilliQ water and boiled with continuous stirring. We quickly added 4.5 ml of sodium citrate solution (0.057 grams [g] in 5 ml distilled water) with continuous heating and stirring until color changed to wine-red. Heating was continued for another 10 minutes, then we cooled the mixture by stirring at room temperature. The gold nanoparticles were stored at 4°C until further use.
Synthesis of cardiac troponin I (cTnI)—gold nanoparticles (AuNP) conjugates
Conjugates were prepared by incubating the antibody at a concentration of 50 μg in 1 ml of fivefold concentrated AuNPs at pH 9. (Note: We report only the successful conjugation procedure.) The mixture was incubated at room temperature for 1 hour on a shaker at a low speed, after which a 10% BSA solution was added to create a final concentration of 1%. The mixture was further incubated for 1 hour, with gentle mixing during that time. The mixture was then centrifuged at 12,000 revolutions per minute for 15 minutes at 8°C. The supernatant containing excess antibodies was discarded, and the pelleted conjugate was resuspended in PBS containing 1% BSA to wash it. The washing was repeated twice, and the conjugate was finally suspended in Storage Solution 3. The prepared conjugates were stored at 4°C until used.
Assay procedure
The half-strips were assembled in the lab of Dr. Baryeh at Southern Illinois University at Edwardsville with no input from the independent study students. The conjugate pad was soaked with the cTnI-AuNP conjugates and dried at 37°C for 1 hour. One uL each of the anticardiac troponin antibody and the Goat anti-mouse Ig were pipetted in the test and control lines, respectively, of the half-strips and dried at 37°C for 1 hour. When they were thoroughly dried, the conjugate and sample pads were attached to the half-strips. We applied 100 uL of 500 ng/ml of troponin in PBS or PBS to the sample pad. After 15 minutes, the strip was washed with 1% BSA and allowed to dry. The color change on the test or control lines was observed visually.
Results and discussion
The conjugation of the gold nanoparticles with the antibody included testing multiple conditions and protocols. Changes in the conditions included testing various starting solutions, the concentration of gold nanoparticles, the concentration of antibody, incubation time, and storage solutions. Unsuccessful attempts led to a black precipitate or a clear solution, indicating that the gold nanoparticles had aggregated. When a red solution was obtained, it meant that either the antibody was bound to gold nanoparticles successfully or there was no aggregation, so no further testing was required. To prove that the antibody was attached to the gold nanoparticles, half-strip assays were conducted, which will be discussed subsequently. Table 1 highlights the different protocols that led to a red solution. It does not include the protocols that led to aggregation. Although large gold nanoparticles (such as the 40 nm ones) were considered, they are excluded from the list. Large particles display a higher absorbance range, but they have lower quantification limits (Zuber et al., 2016) and move slower, resulting in increased flow times (Dong et al., 2019). The starting solutions used included PBS, borate buffer, and MilliQ water at pH 9. The storage solutions used to store the gold nanoparticle conjugates were composed of PBS and Storage Solutions 1–3 at multiple volumes. Of all of the conditions tested, the best conditions involved a fivefold concentration of the synthesized gold nanoparticles, using Milli-Q water at pH 9 and storing the final product in Storage Solution 3.
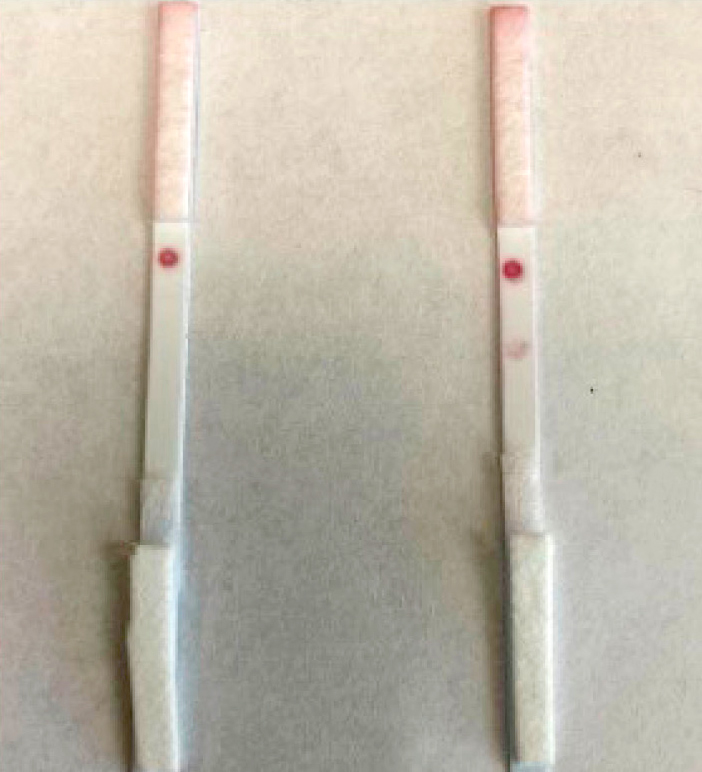
The half-strip assays (Table 2) were conducted to ensure that the conjugation worked. Conjugation has worked when the solutions elicit a color change on the nitrocellulose test line or control line. The half-strips are made up of either (i) nitrocellulose membrane and an absorbent pad or (ii) a conjugate pad, nitrocellulose membrane, or an absorbent pad. The nitrocellulose component had a test line and control line or just a test line for comparison studies. The test and control lines were made by pipetting 1 μL of 1 mg/ml of the anticardiac troponin antibody 19C7 and Goat Anti-Mouse IgG, respectively. Only Protocols I and J gave a red color change with the control line (Table 2). Protocol J had the strongest signal of the two (I and J), so Protocol J was chosen for further experimentation (Figure 3). The red color change with the Protocol I conjugate was assigned positive (+) and no color change (-). An increase in the number of + signs is used as the color changes become more significant.
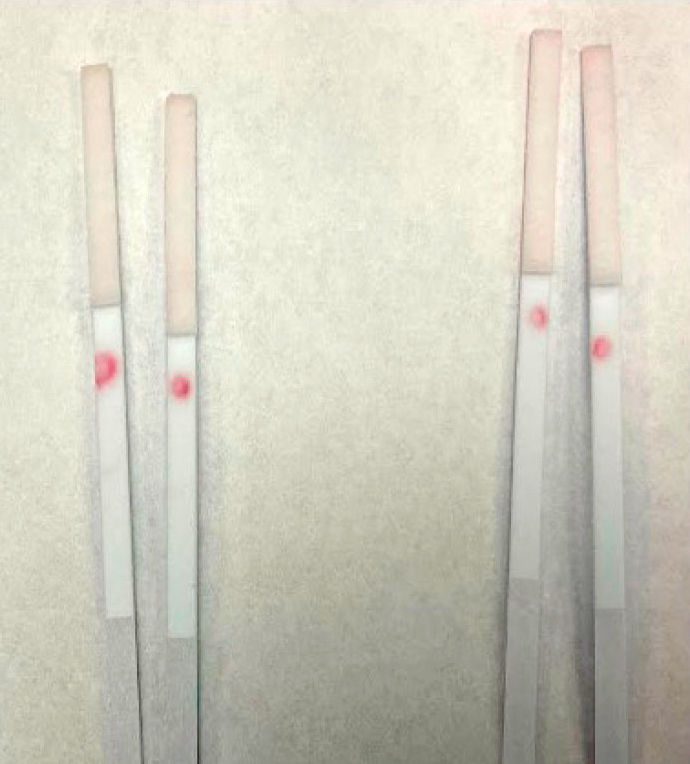
Half-strips run with cardiac troponin antibodies I and J in the presence of 200 ng/ml troponin protein (right) and absence of troponin (left).
Note. The control line has the red color change, whereas the test line remains unchanged.
The optimization to obtain a color change on the test line using the J conjugate involved increasing the concentration of cardiac troponin (cTnI) from 200 ng/ml to 500 ng/ml. The effect of different anticardiac troponin I antibodies was also tested to increase the sensitivity of the test line. Four antibodies available in our lab were pipetted at the test line, all at 1 mg/ml. Of the four antibodies, the best result was with the anticardiac troponin antibody M1709TI1, which gave a strong positive color change on the test line and a faint color change on the control. Aside from providing this positive test with 500 ng/ml troponin in PBS solution, M1709TI1 had no background signal (i.e., no color change on the test line in the absence of troponin; see Figure 4).
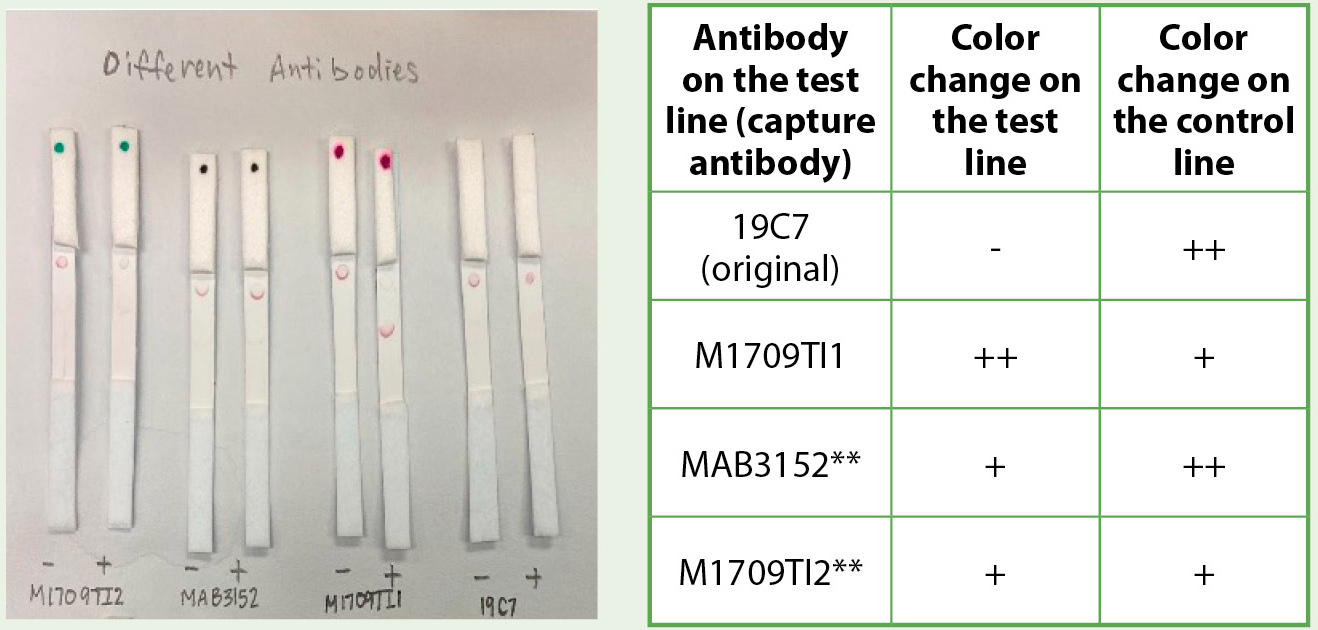
Comparing the effects of different anticardiac troponin antibody with the J conjugate.
Note. Anticardiac troponin antibody M1709TI1 gave the best data with a strong color change on the test line and no background color change on the negative control (absence of troponin). **MAB3152 and M1709TI2 both had slight color change on the negative control strips (absence of troponin).
The whole strip was then assembled by immobilizing the gold nanoparticle–antibody conjugate (J) on the conjugate pad. After multiple trials to figure out the best protocol (data not shown), the J solution was pipetted onto the conjugate pad and dried at 37°C for 1 hour. The dried conjugate pad and a sample pad were added to the nitrocellulose membrane card (marked with test and control lines) with an absorbent pad. Two solutions—100 μL of 500 ng/ml troponin solution (positive control/+) and 100 μL of PBS (negative control/-)—were pipetted onto the sample pad. The color changes on the nitrocellulose membrane were observed after 20 minutes (Figure 5). The negative control, which did not have any troponin in the test solution, showed a red color change only with the control line. The positive control, which had 500 ng/ml, showed a red color change on the control and test line, indicating that the strip creation was successful.
Full strip with all five components of a lateral flow assay showing the successful detection of troponin at 500 ng/ml.
Note. Left = negative control, right = positive control.
Conclusion
Designing a lateral flow assay involves multiple tests at various points in the assembly of the device. The successful creation of an entire strip to detect troponin affords several follow-up experiments. The strip is currently testing troponin concentration at 500 ng/ml. The planned next step in this project is to investigate the limit of detection of the strip to identify the lowest concentration that can be visually detected. The goal is to have a highly sensitive strip to test on human serum.
Acknowledgment
The authors would like to acknowledge Maryville University for the provision of the funds for this research. We would also like to thank Dr. Jason Telford, Dr. Tom Spudich, Malia Dunbar, and Vedada Becirovic for their enormous support of the study by obtaining materials and supplies. Zahidul Mondle of Cytiva also provided samples from Cytiva to help with the research process.
Gifty Blankson (gblankson@maryville.edu) is an assistant professor of chemistry, and Elizabeth (Ellie) Schilling, Joy Sandman, Rida Sait, and April Stich were students at the time of the research, all at Maryville University of St. Louis in St. Louis, Missouri. Kwaku Baryeh was an assistant professor of chemistry at Southern Illinois University in Edwardsville, Illinois, at the time of research.
Biology Chemistry Interdisciplinary STEM Teaching Strategies Technology Postsecondary