
Research and teaching
Measuring Data Skills in Undergraduate Student Work
Development of a Scoring Rubric
Journal of College Science Teaching—March/April 2021 (Volume 50, Issue 4)
By Jessica Sickler, Erin Bardar, and Randy Kochevar
Data literacy, or students’ abilities to understand, interpret, and think critically about data, is an increasing need in K–16 science education. Ocean Tracks College Edition (OT-CE) sought to address this need by creating a set of learning modules that engage students in using large-scale, professionally collected animal migration and physical oceanographic data to answer scientifically relevant questions and think critically about how researchers collect and interpret data. In a field test in nine undergraduate marine biology, oceanography, and general biology courses, we undertook a collaborative educator-researcher process to develop a rubric-based scoring system that could reliably measure student performance across seven data skills. This paper documents the development and testing process, shares the resulting rubric, and discusses how the results of the rubric development process and pilot scoring of 32 pieces of student work affected curriculum refinement. We conclude with a discussion of how undergraduate science educators might be able to further refine and apply this preliminary rubric for use in instruction or educational research.
The ability to work with, interpret, and think critically with data is increasingly essential for a wide range of professions (AACU, 2011; EDC, 2016; Kastens et al., 2013; NASEM, 2018; NGSS Lead States, 2013). This demand for data-skilled individuals in the workplace has contributed to changes in priorities in K–16 education. In undergraduate settings, there has been growing discussion of the importance of critical thinking broadly (Hart Research Associates, 2016a; Eagan et al., 2014), as well as of increasing students’ exposure to and skills in working with data, particularly within scientific disciplines (AAAS, 2011; Baumer, 2015; Holmes et al., 2015; NASEM, 2018). There remain, however, a number of challenges to meeting these priorities. For instance, there is not a clear consensus of what it means to be “data literate” nor about the subject areas in which data literacy skills should be taught (Finzer, 2013). A recent literature synthesis defined data literacy as the ability to “understand and evaluate information obtained from authentic data” (Kjelvik & Schultheis, 2019, p. 2). These researchers position data literacy at the intersection of quantitative reasoning skills, data science skills, and the content knowledge of a particular discipline (e.g., biology, physics, social science, etc.). As such, data literacy can incorporate a broad range of skills and practices, including identifying patterns, interpreting data, making predictions, and engaging in argument based on evidence, among others.
As attention to cultivating both critical thinking and data skills is growing, some efforts have been made to integrate critical thinking curricula and assessments across the undergraduate curricula (Grant & Smith, 2018; Stein et al., 2010) and to reformulate statistics education using the framework of data science (Baumer, 2015). In physics courses, for example, a range of pedagogical procedures and supports have been developed for laboratory settings that purposefully scaffold students thinking about data within authentic problems. These supports have been shown to effectively develop stronger scientific-reasoning skills and deeper understanding of core scientific concepts, such as experimentation, measurement, and uncertainty (Allie et al., 2003; Holmes et al., 2015; Lubben et al., 2010; Zwickl et al., 2015).
In today’s ”big data” landscape, students have unprecedented access to a growing number of complex, large-scale, professionally collected scientific data sets, ripe with authentic and relevant problems to solve. As others have argued (Baumer, 2015; Gould et al., 2014; Kastens et al., 2015; Kerlin et al., 2010; Kjelvik & Schultheis, 2019), we contend that interacting with these “messy” data, along with appropriate learning supports and instructor facilitation, creates a rich opportunity for students to engage more deeply in scientific practices and improve their ability to think critically about data and related phenomena (AAAS, 2011). However, the “messiness” of these data, the technical framing of the data sets, and the class time needed to engage with them can present barriers for instructors and students, which limits integration of these data in classrooms (Kjelvik & Schultheis, 2019; Krumhansl et al., 2012). In fact, there are few opportunities and high-quality pedagogical materials to support undergraduate students (and faculty) in using these data in coursework (Borne et al., 2009; Kastens et al., 2013; Kjelvik & Schultheis, 2019; Krumhansl et al., 2012; Ledley et al., 2008; Slater et al., 2009). Among undergraduate marine science courses, our discipline of interest, a review of syllabi, textbooks, and results from a national survey of instructors showed that, while students frequently collect and analyze their own data through field or laboratory experiments, they are less commonly asked to think critically about, evaluate the quality of, and derive meaning from large-scale, professional sources (Louie, 2016; Sickler & Hayde, 2015).
The learning modules
Ocean Tracks College Edition (OT-CE) was developed to focus on data literacy at the undergraduate level by incorporating data-rich learning modules into existing course structures. Our primary interest was to provide curricular supports that engage students in several skills of interpreting and thinking critically about scientific data within introductory, undergraduate marine science courses. While some of these courses serve science majors, they are often the only or last science course that non-STEM majors will take before graduating. We felt that engaging a broad spectrum of students in the processes and mindsets of a data scientist is essential, as data literacy is of increasing importance across all professions and fields (NASEM, 2018).
OT-CE’s six learning modules make use of the Ocean Tracks interface (2017), which brings together a moderately constrained set of historical (2002–2011) large-scale data from the Tagging of Pelagic Predators (TOPP) program, NOAA’s Global Drifter Program, and Earth-orbiting satellites in a user-friendly, Google Earth–style map with customized analysis tools and a reference library. Students use the Ocean Tracks interactive map and data tools to explore and quantify patterns in the migratory behaviors of four marine species and to explore relationships between movement data and physical oceanographic variables such as sea surface temperature and chlorophyll concentration. Each OT-CE module guides students through a series of open-ended prompts (see sample module in Appendix A in Online Supplemental Materials) that ask them to identify, explore, examine, and reason about Ocean Tracks data in relation to their understanding of ocean science topics (learned via lecture, textbook, and/or material in the Ocean Tracks Library). Each module is structured around a three-phase learning cycle, beginning with “Engage” activities to spark curiosity and set the stage for investigation, followed by “Explore” activities to build skills and gather data, and culminating with a “Synthesize” activity, in which students draw conclusions from earlier analyses and communicate them in a shareable product (e.g., research proposal, abstract, scientific poster). In fall 2016, the modules were field tested in nine undergraduate marine biology, oceanography, and general biology courses, at two- and four-year institutions, with researchers studying implementation to assess areas of promise in the instructional approach.
The assessment challenge
Standardized pre-/post-, and multiple-choice assessments were developed and employed within OT-CE research to measure attitudinal shifts and basic data competencies (e.g., decoding measurements from a graph, selecting the data that best supports a claim, etc.; see Louie & Hoyle, 2017; Madura & Louie, 2017). However, we were aware of the limitations of such multiple-choice assessments (see discussion in AAAS, 2011), particularly for documenting students’ competencies with complex data skills, such as reasoning with evidence or evaluating data sources. In fact, the assessment developed by Louie & Hoyle (2017) examined only: (a) identifying data points from a display or representation; (b) describing patterns in data; and (c) connecting a claim and evidence. Higher-order data skills were beyond the scope of such an assessment tool.
In addition, we had access to a rich trove of written work produced by students using the OT-CE modules that we hoped would help address several research questions about teaching data skills, which would require a different assessment approach. This led us to the core question: Could we develop a rubric that would support educators in evaluating students’ understanding of professionally collected data and proficiency in core data skills?
Rubric as assessment tool
To this end, we built on the long tradition of using rubrics in K–12 education, which has seen increased use in undergraduate settings (Hart Research Associates, 2016b; Popham, 1997; Reddy & Andrade, 2010; Stevens & Levi, 2013). A rubric is “a scoring guide used to evaluate the quality of students’ constructed responses” (Popham, 1997, p. 72), with three main components: evaluative criteria, definitions of quality, and a scoring strategy. Using this framework, we sought to develop and test a skill competency rubric that could be applied reliably to score OT-CE student work samples, understanding that it would need further development and testing to assure validity and reliability in a broader context. There is a dearth of publications on the use of rubrics in research on teaching and learning, and a particular lack of attention on the processes of development and testing of such tools in undergraduate settings (Reddy & Andrade, 2010). We hope that this discussion of our efforts may be a useful starting point for others interested in developing assessment rubrics or examining data literacy skills.
Rubric development process
The rubric was developed collaboratively by members of OT-CE’s research and curriculum teams, including instructional designers and a biology teacher with extensive Ocean Tracks experience. The educators brought a deep understanding of the curriculum design and intentions for learning, and the researcher brought a systematic process for creating rubrics and helped the team question assumptions and clarify language to arrive at reliable performance indicators.
Identifying rubric components
The first step in rubric development is to articulate the evaluative criteria (Popham, 1997; Stevens & Levi, 2013), which we referred to as “data skill indicators.” Beginning with a list of basic, intermediate, and higher-order skills for working with data assembled as priorities for the OT-CE team, we sought to identify and define meaningful, discrete (i.e., nonoverlapping) skill indicators. Ultimately, seven data skill indicators were defined (see Figure 1). The process began with data competencies identified through extensive review of literature on data skills completed by OT-CE researchers while developing the multiple-choice assessment (full review in Louie & Hoyle, 2017), which identified the first five of the data skill indicators illustrated in Figure 1. The final two skills, critical thinking and communicating ideas, were identified through review of external frameworks used by the curriculum developers in structuring the modules (e.g., the Critical Thinking Assessment Test; Stein et al., 2010). Based on this literature, we used an iterative, team-based process to finalize definitions and clarify the boundaries between indicators. Much of this process occurred in conjunction with the next step of the rubric development process (defining quality), which is described further below, with the two rubric development steps informing one another iteratively.
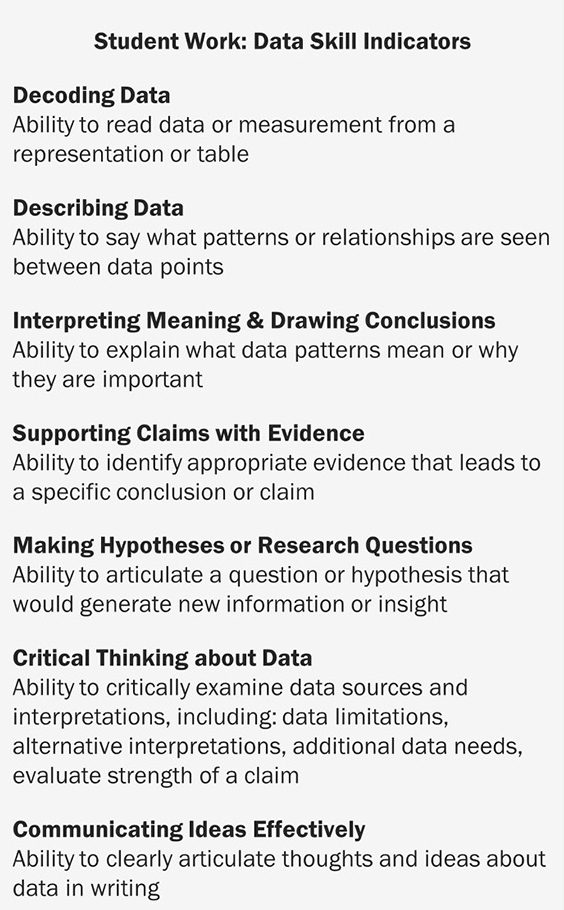
Data skill indicators for Ocean Tracks college edition student work.
The next step was to create definitions of quality, or “levels of proficiency,” for each indicator and establish a scoring system. We chose a four-level system: (4) exceeds expectations, (3) meets expectations, (2) needs improvement, and (1) inadequate. Our target level of performance was (3) meets expectations; we reserved the highest level (4) for evidence of exceptionally high achievement, which we knew was possible from work done with high school students (Krumhansl et al., 2016), but would not expect to see among all students in any context. Within each indicator, we articulated core characteristics for each level of proficiency. This process was intended to create clear definitions that were observable in student work and established minimum achievement necessary for each level. This process further clarified boundaries between indicators, and revealed ambiguities or assumptions in interpretations of what constituted a certain skill.
Because our interest was to understand the development of each skill, not to assign an overall grade, we chose an analytic scoring strategy (Popham, 1997), in which each indicator in the rubric was considered individually and scores were applied at this criterion level. Because student work within an OT-CE module could contain as many as 30 short-answer responses and one longer Synthesize response, we found that raters had difficulty consistently applying a single indicator score that represented evidence of quality across so many individual questions. As a result, we used a scoring procedure in which raters applied indicator scores on a question-by-question basis within a single piece of student work. Curriculum developers identified which skill was called for in response to each question within each module; raters then applied only the appropriate rubric section to generate a proficiency score for each question.
We found this approach better aligned with the module design, in which prompts were intentionally designed to scaffold students’ practice using particular data skills. It also proved to be a useful content analysis of the OT-CE modules, as it revealed that modules varied in how often each skill indicator was applied, with some modules completely lacking one or more indicator. An exception was made to this scoring strategy, which was for the indicator of Communicating Ideas; while it did introduce some inconsistency in the overall approach to scoring, we decided that this indicator was most effectively applied as a single rating across a full module. Particular attention was given to the Synthesize activity in order to reflect the comprehensiveness of the student’s ability to respond to the module’s prompts and to communicate their own ideas in writing. The full rubric is available in Appendix B; a sample of the levels of proficiency for one indicator is shown in Table 1.
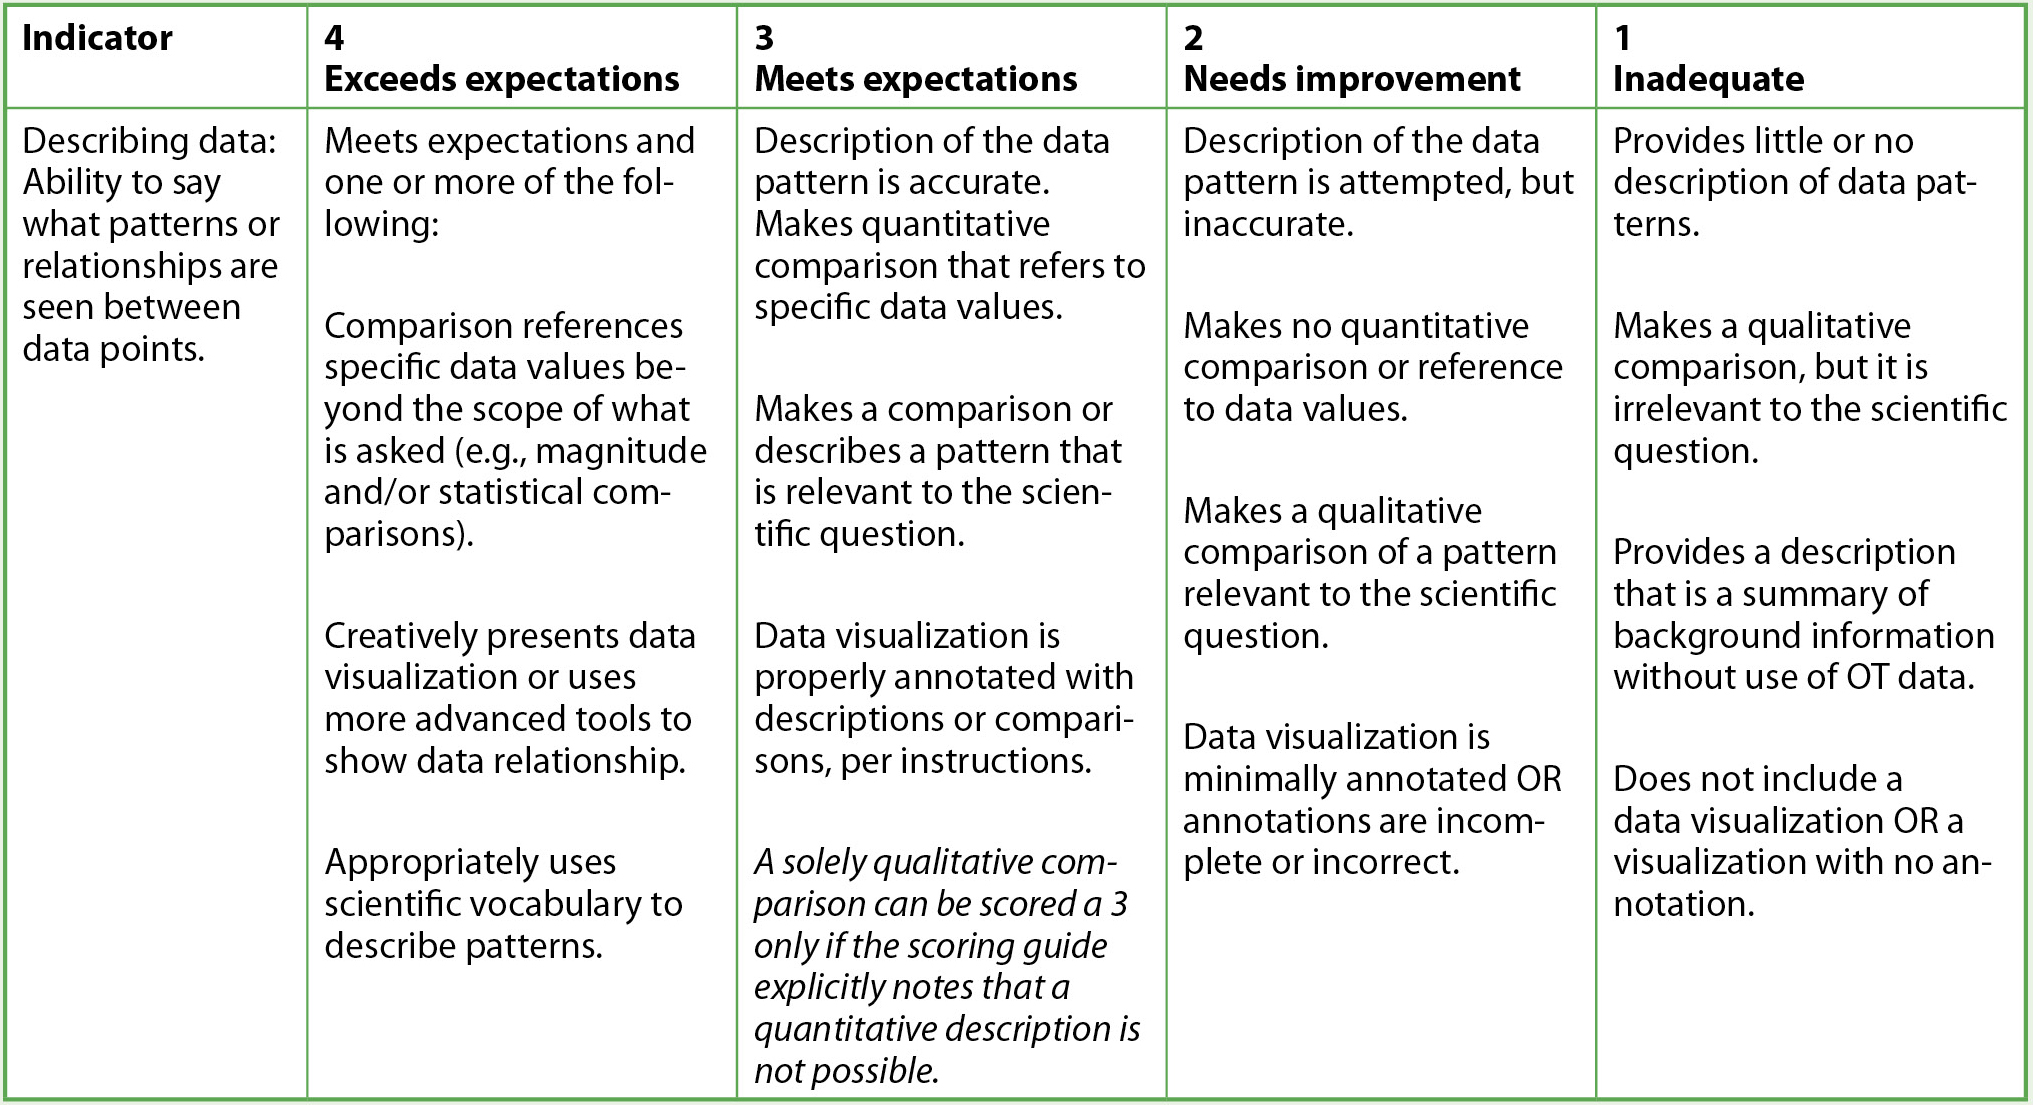
Levels of proficiency for describing data, excerpted from full rubric.
For final evaluation of the student’s proficiency with each indicator, we needed to transform the set of OT-CE question-by-question indicator scores into an overall indicator score that represented the level of skill demonstrated within that piece of work. We considered several approaches for assigning an overall indicator score. Our first approach was to use the median score, which seemed appropriate to these ordinal data, and would work in many circumstances of applying this rubric. However, the median frequently resulted in half-point scores (i.e., 2.5 or 1.5), and we sought a whole-number score that aligned with the rubric levels. As an alternative approach, we constructed guidelines to translate a set of individual question scores into a single proficiency score for any given data skill; this also accounted for variation in how often a skill was addressed within a module (which ranged from one to seven times). The scores that resulted from these guidelines (Table 2) were generally the same or within a half-point of the median, but provided definitive rules that allowed us to arrive at consistent whole-number scores that reflected our team’s view of proficiency, given the nature of the student data we were examining and the team’s goals for using the results. In other contexts or with other students, using a median, mean, or revising the scoring rules may be a more appropriate strategy to arrive at an overarching skill score.
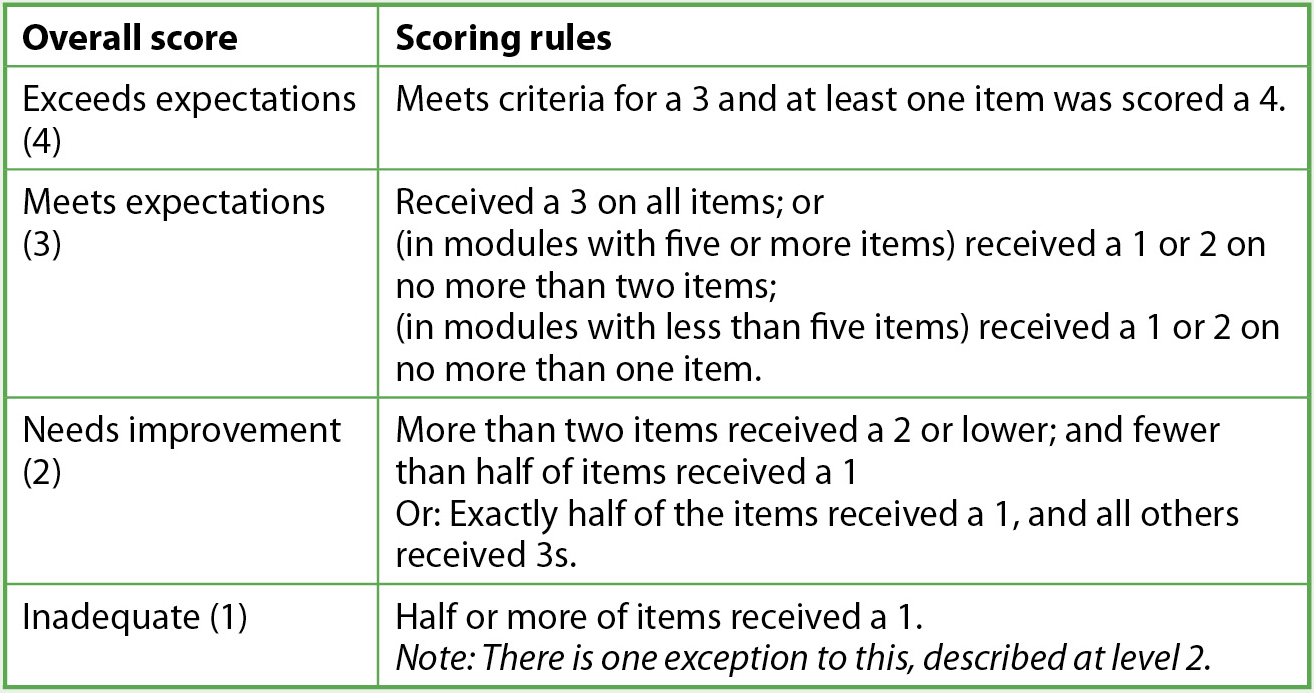
Guidelines for applying an overarching skill score to student work, based on question-by-question scores.
Rubric calibration and testing
Scoring procedure and reliability testing
As described earlier, four experienced curriculum developers collaborated on the rubric development process and ultimately scored student work. We went through three rounds of iteratively testing and refining drafts of the rubric, using two randomly selected work samples in each round (a total of six pieces of student work). In round one, each rater independently applied the first draft rubric to the selected student works, and the team compared and discussed the resulting scores. Inter-rater reliability was, as expected, quite poor in the first round. The team extensively discussed discrepancies and differing interpretations of the indicators; from this, we collaboratively revised the rubric, tightening descriptions of skill performance. We repeated the process for a second iteration with two different pieces of student work. Again, there was low inter-rater reliability; discrepancies were discussed, the rubric further refined to achieve shared interpretations, and the decision made to use the question-by-question scoring scheme described above. This iterative, collaborative process of testing and discussing the rubric was our method of ensuring the scoring team had consistent interpretations of the rubric criteria; quantitative reliability tests were used to verify this.
In the third round of testing, two more pieces of work were selected and independently scored by the four raters; from these pieces of work, each rater assessed and scored 34 individual data skills (each aligned with an individual module question). At this stage, the test achieved several key measures of the rubric’s reliability. All four rating points (inadequate through exceeds expectations) were applied by raters. The most frequently applied scores were 3 (42%) and 1 (33%), followed by 2 (18%). “Exceeds expectations” was only applied in 7% of cases, which aligned with its purpose to identify exceptional examples of work. In measures of reliability, we achieved 82.4% exact or adjacent agreement among the four raters; 38.2% of ratings had exact agreement between all four raters and 44.1% of ratings had adjacent agreement (meaning at least one reviewer differed from the others, but all four selected from just two adjacent scores). We used Krippendorff’s alpha (α) to measure reliability because it is well-suited to a wide range of conditions, including ratings on an ordinal scale that come from more than two coders (Hayes & Krippendorff, 2007); this analysis showed inter-rater reliability of α = 0.75, which is considered good agreement (over 0.80 is considered very good).
Pilot test with OT-CE student work
With a sufficiently reliable rubric, the team applied the scoring to 32 randomly selected work products. We selected two pieces of work from 16 students, ensuring that we included at least four pieces of work per module. One rater scored all pieces of work for a single module; despite reasonably strong reliability, we felt this would further increase consistency of scores for a given module. We also minimized potential bias by having raters score modules for which they had not had a primary development role. Raters recorded question-by-question indicator scores for each piece of student work, and we analyzed these ratings to get an overall picture of students’ proficiency in each data skill. We found that with this type of scoring, we could examine proficiency at the indicator level (looking at the distribution of scores for a particular skill across all students and modules), at the module level (looking at the distribution of scores across all students from one module), and at the individual student level (looking at a student’s score profile across multiple modules).
Discussion
Implications for instructional design
As described in Reddy and Andrade (2010), rubrics can be used to pinpoint areas for improvement in instruction or to make course-wide changes, which was certainly true for OT-CE. The question-by-question analysis revealed which skills were emphasized in each module and across the entire set of modules. The close reading and systematic scoring of student work further revealed “weak spots” in the curriculum, where students routinely struggled and more scaffolding (from the lessons or instructors) might be needed. Using the results from our pilot scoring of student work, combined with input from faculty who tested OT-CE, we made final revisions to all six learning modules with a focus on strengthening support for data skills. These revisions included adding annotated screenshots of the interface, clarifying the wording of prompts and questions, and providing examples of exemplary responses. We also removed tasks that content analysis revealed did not directly contribute to developing the target data skills in an effort to further focus student attention on the most productive activities.
In this way, we feel that the rubric provided a benefit beyond assessing student work, as it helped educators clarify what it looked like for a student to be successful in thinking critically about, evaluating the quality of, and deriving meaning from large-scale, professional data. Although we did not use it in this way, we could imagine it also being a tool given to students to help them understand the types of skills they should be developing, applying, and demonstrating in their coursework.
Potential use of the data skills rubric
We share this rubric and the details of our development process as a foundation for science educators and researchers who wish to assess students’ data skills or measure gains over time within written or task-based assessments. We developed it within a specific context and tested it with a limited sample of student work to determine if it was possible to create reliable scoring criteria for evidence of data skills within this curriculum. We acknowledge this development was preliminary, and it would benefit from further efforts to measure validity and refine the tool for use in research (Reddy & Andrade, 2010). We feel, however, that our educator-researcher co-construction process and articulation of indicators and levels of proficiency may provide a useful starting point for others.
When we critically assessed our rubric through the lens of common rubric flaws (Popham, 1997), we identified strengths and areas for further fine-tuning. This rubric avoided the common flaw of being excessively general or lacking clear cues about significant attributes of student work through our emphasis on iteratively clarifying terminology and detail within the indicators and levels of proficiency. Our rubric perhaps errs toward the converse flaw: excessive detail, which can make it less practical for instructors; this level of detail, however, was immensely helpful in achieving inter-rater reliability, particularly as it was applied across six different learning modules. We imagine that for classroom use, an instructor may find it useful to simplify some definitions.
We also attempted to address the common flaw of evaluative criteria that are overly task-specific, neglecting the underlying skill. Our rubric strikes a balance by describing indicators that represent general data skills (i.e., decoding data, interpreting meaning in data patterns, etc.) and providing definitions of quality that are anchored to proficiencies evident in student work (e.g., including values and labels in a response). There are a number of places where we specifically reference attributes that are unique to Ocean Tracks, such as “screenshots” or using multiple “tracks” in evidence. For other settings, rubric language would need to be modified to apply to the type of data or evidence anticipated. Apart from those details, we think the definitions would be generalizable to other data-focused assignments.
Finally, although this tool is designed to measure what students achieve in the context of embedded classroom activities, we think it could be adapted for use beyond course assignments, particularly for educational research seeking to measure the transferability of data skills beyond coursework. With carefully designed assessments that ask students to demonstrate these skills in problem-based tasks, the rubric could be applied as part of a general performance assessment within many types of data-intensive science curricula at secondary or post-secondary levels. Such use could help determine the effectiveness of different teaching approaches, including how well students can transfer skills to novel data sets or scientific problems. ■
Acknowledgments
This paper is based upon work supported by the National Science Foundation under Grant No. (DUE-1431903). Any opinions, findings, and conclusions or recommendations expressed in this material are those of the author(s) and do not necessarily reflect the views of the National Science Foundation.
Online Supplemental Materials
Appendix A: Sample module prompts—https://bit.ly/3rs2loL
Appendix B: Complete rubric for assessing student work—https://bit.ly/36ALLuK
Jessica Sickler (jessica@jsickler.net) is principal/owner of the research and evaluation firm J. Sickler Consulting in Pittsburgh, Pennsylvania. Erin Bardar is senior curriculum/instructional design associate and Randy Kochevar is director of the Oceans of Data Institute, both at the Education Development Center in Waltham, Massachusetts.
Teacher Preparation Teaching Strategies Technology Postsecondary