
research & teaching
Exploring Student Perception Toward Online Homework and Comparison With Paper Homework in an Introductory Probability Course
Journal of College Science Teaching—May/June 2019 (Volume 48, Issue 5)
By Philip Matchett Wood and Vijesh Bhute
Online software systems are extensively used to give students practice on course content, especially in mathematics and physics courses. They offer instant feedback, and several of these systems are open source or very economical compared with hiring graders for traditional paper-and-pencil–based homework (PPH). In this article, the authors evaluate WeBWorK (WW), an online software tool, in an introductory course on probability over two semesters. WW is compared with PPH by measuring student perception, average time spent on a problem, collaborative work outside of classroom, resilience, self-efficacy, and exam performance. The authors find that except for working in groups on homework, students perform similarly on all the aforementioned aspects in both PPH and WW. The authors also suggest potential strategies to improve student understanding and learning while using WW and recommend the use of WW in mathematics-oriented courses.
Homework assignments are a critical component of college education, especially in mathematics- oriented courses. Homework assignments can serve multiple instructional purposes, which are reviewed in detail by Bas, Senturk, and Mehmet Ciherci 2017), including offering students opportunities to review concepts taught in the classroom (Bas et al., 2017; Cooper, 2007). Conventional homework, also known as paper-and-pencil–based homework (PPH), involves students working on problems outside the classroom and returning their solutions after a fixed duration of time. In PPH, students are unable to check whether their answers are correct until they submit their work and receive the solutions from the instructor. Also, in PPH, the grading of the homework assignments is usually done by paid graders, which can introduce heterogeneity and subjectivity. Online homework can overcome these challenges by providing instantaneous feedback (Mavrikis & Maciocia, 2003) and eliminating the need for paid graders. WeBWorK (WW), an open-source online homework system, has emerged as a viable alternative to the traditional PPH assignments in several mathematics-oriented subjects (Roth, Ivanchenko, & Record 2008), including calculus (Goehle, 2013), algebra (Hauk & Segalla, 2013), probability and statistics (Lucas, 2012; Segalla & Hauk, 2010), and economics (Mitchell & Mitchell, 2017). WeBWorK (WW) successfully evaluates equivalent mathematical expressions as correct; however, WW does not generally differentiate between answers that are slightly wrong versus completely wrong. Problems in WW typically have some randomized parameters to discourage students from inputting correct answers from another student. Students’ perception toward WW and the effect of WW-based assignments on their performance on exams have been investigated in several studies (Goehle, 2013; Hauk & Segalla, 2013; Lucas, 2012; Mitchell & Mitchell, 2017; Roth et al., 2008; Segalla & Hauk, 2010). The effect that using WW has on student performance is ambiguous—although some studies observed a minor improvement in student performance, others failed to see any statistically significant improvement.
Student learning is a multifaceted process, and several factors can significantly affect learning. Despite extensive research on general perception and student performance, the influence of WW on a number of learning factors is not well studied. The objective of this evaluation is to compare the effects of WW and PPH as they are typically used in a classroom setting, studying students’ time spent on homework, their self-efficacy (Bandura, 1989), their resilience, their out-of-class group interactions, and finally their performance on a topic in a final exam for which each student was assigned either PPH or WW homework. Completing assignments in WW or PPH could have many different effects, and the authors studied full distributions of data so that a variety of features could be observed. The authors observed no significant differences in resilience, self-efficacy, average time spent on a problem, or student performance due to the mode of homework and concluded that WW can potentially replace PPH because of its economic benefits and objective nature.
Methodology and procedure
This article studies a course, Introduction to the Theory of Probability, offered every spring and fall semester at the University of Wisconsin–Madison. The course attracts students from a variety of majors, including math, statistics, computer science, and engineering, and includes students at all undergraduate levels. Each semester, there are usually between 100 and 130 students in the course, and they are typically divided into three or four sections that are taught by different instructors.
For this evaluation, WW was used during the fall 2016 semester (four sections, each with a different instructor) and the spring 2017 semester (two sections, each with a different instructor). Problems for WW were adapted from the course text Introduction to Probability (Anderson, Seppalainen, & Balko, 2017) and also chosen from the WW Open Problem Library. All students were assigned some WW and some PPH as homework throughout the semester. Questions in WW assignments are usually personalized for each student by randomizing some parameters in the problem, and all WW problems assigned in both semesters used random parameters in this way. For this evaluation, students were allowed an unlimited number of attempts on each problem, which is a common (though optional) way for WW to be set up. The authors provided an anonymous questionnaire to students at the end of each semester, asking questions related to perception, average time spent on a problem, number of attempts per problem, frequency of working in groups, resilience, self-efficacy, general perception of WW, and their likes and dislikes about using WW (the questionnaire is available at ).
To assess students’ performance in the spring 2017 semester, the authors prepared one assignment with four problems on the topic of exponential random variables. The problems were coded in WW (with randomized parameters) and assigned to some students, and the same problems were also printed out (with a fixed value of the random parameters) and assigned to the remaining students as PPH. The mathematical work done to solve any given problem in WW is essentially the same—finding a correct solution only differs in the value of certain numbers (the variable parameters) that appear in some computational steps. In WW, feedback is a mark of correct or incorrect, which is determined by specific answers (sometimes including specific answers to intermediate steps), but does not include credit for the general approach or reasoning. In PPH and on exams, feedback may include short written comments, and students are graded on their approach, reasoning, and intermediate steps. Students from two different sections in spring 2017 were included in this evaluation for the comparison of exam performance. Students were assigned a randomized identifier at the start of the semester and were asked to do the aforementioned assignment using either WW (n = 49) or PPH (n = 29) depending on the identifier (an improved identifier process could be used in future assessments to balance the two groups sizes). To assess the student performance, the authors investigated their scores on the homework as well as their scores on a problem from the same topic on the final exam. The analysis was performed on the anonymized data.
Results
Similar time per problem in PPH and WW
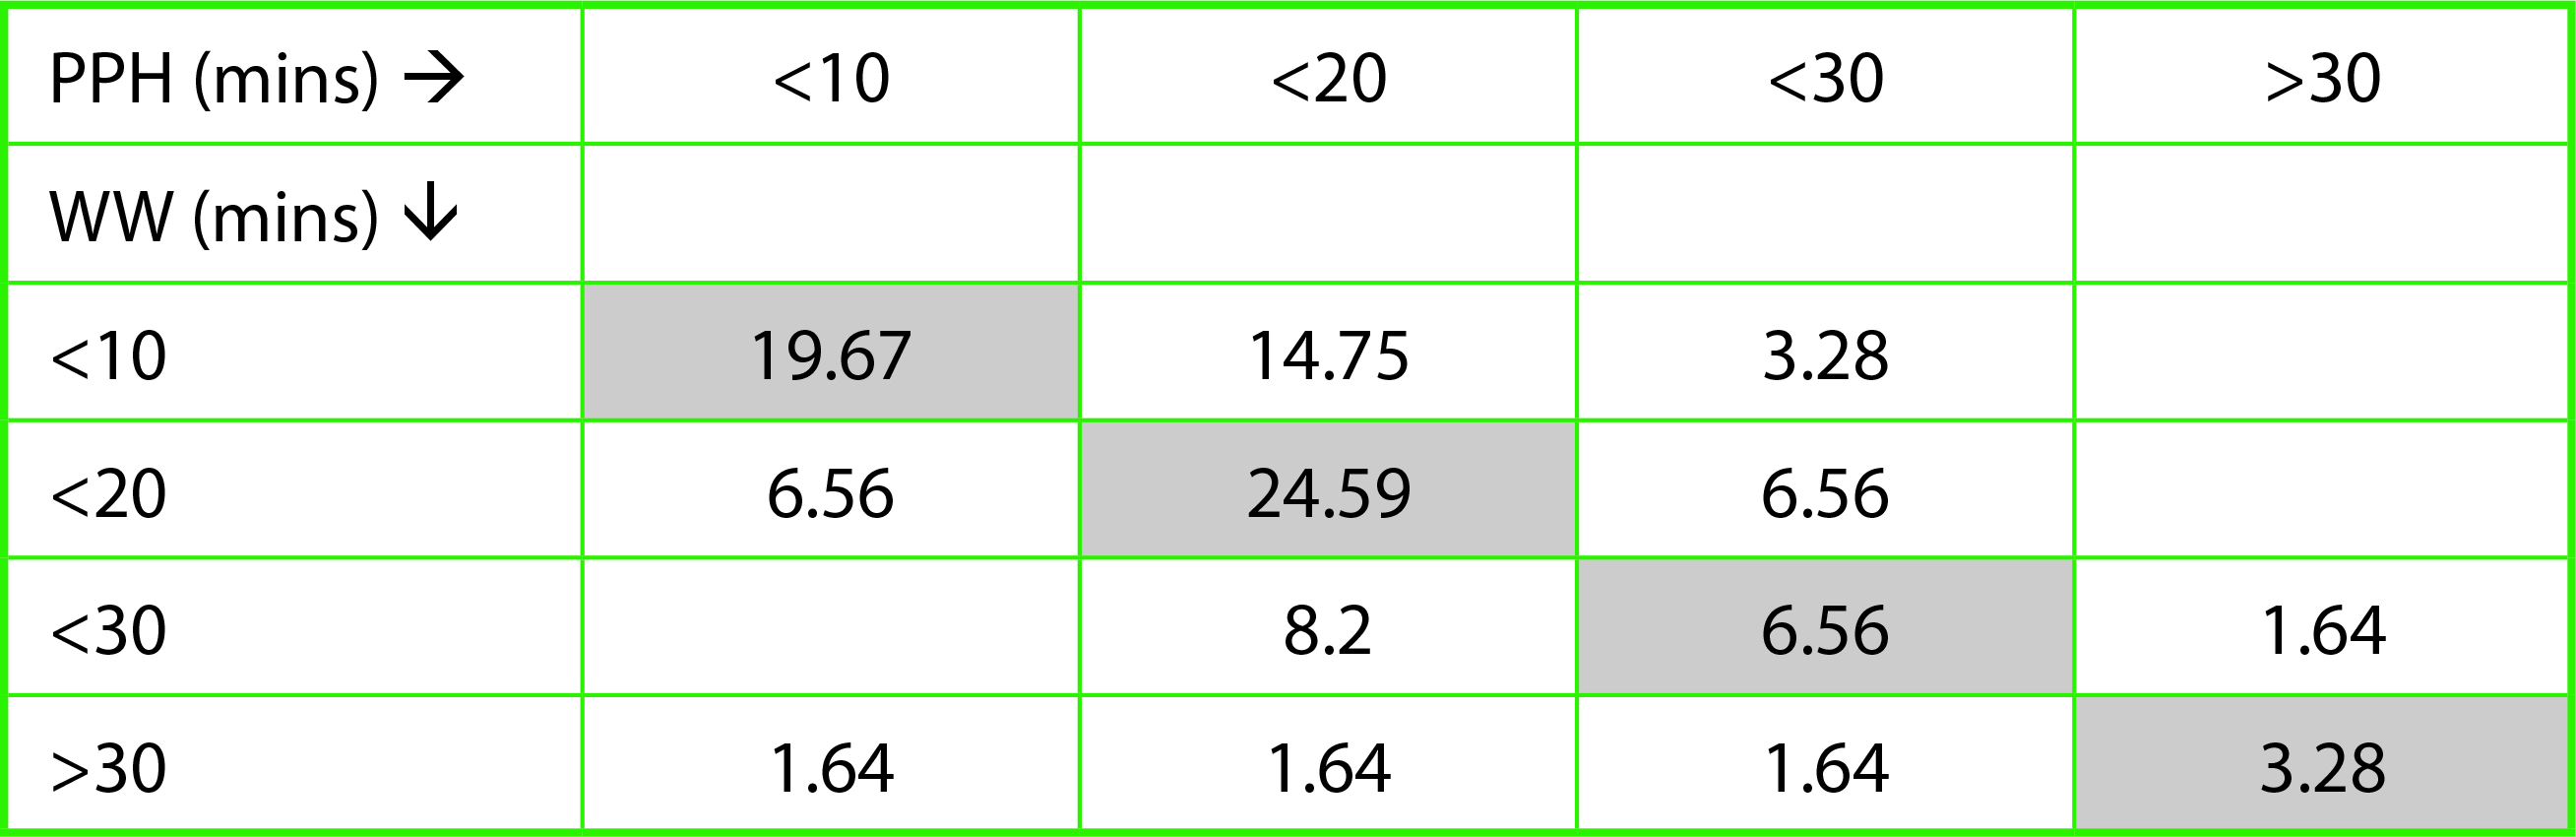
The questionnaire asked about the average time spent by students per problem when working on PPH or WW. Figure 1A shows the distribution of their response (N = 61). The average time spent per problem was largely similar, but slightly higher in PPH compared with WW (19 mins vs. 15 mins). The authors also studied the individual responses on time spent on PPH or WW and observed that although 54.1% of the students did not indicate any difference in average time spent on a problem (Table 1, diagonal shaded in grey), 26.23% of the students reported spending less time per problem on average in WW compared with PPH (Table 1, above the diagonal), and 19.68% reported spending more time in WW compared with PPH.
![(A) Distribution of student responses on average time spent on a problem when working on PPH (pencil-and-paper–based homework) or WW (WeBWorK). The fit corresponds to normal distribution with µ = 19 and σ = 8 for PPH and µ = 15 and σ = 13 for WW. (B) Distribution of student responses to “How often do you [the students] attempt to solve a problem more than once?” (C) Distribution of student responses on the average number of attempts per problem when working on PPH or WW. The fit corresponds to normal distri](/sites/default/files/2020-12/JCST_08_Figure1.jpg)
(A) Distribution of student responses on average time spent on a problem when working on PPH (pencil-and-paper–based homework) or WW (WeBWorK). The fit corresponds to normal distribution with µ = 19 and σ = 8 for PPH and µ = 15 and σ = 13 for WW. (B) Distribution of student responses to “How often do you [the students] attempt to solve a problem more than once?” (C) Distribution of student responses on the average number of attempts per problem when working on PPH or WW. The fit corresponds to normal distribution with µ = 2 and σ = 1.35 for PPH, and µ = 4.8 and σ = 1.7 for WW. (D) Distribution of student responses to “How often do you [the students] guess at problems that you don’t understand on WW?” and “How often are you [the students] confused with the required format of final answer in WW?”
| Table 1. Comparison of time spent on a problem by students in either PPH (paper-and-pencil–based homework) or WW (WeBWorK). | |
|---|---|
|
Students were allowed to make an unlimited number of attempts in WW and get immediate feedback, so the authors asked how often the students attempted a problem more than once when working on WW or PPH. When working on WW and PPH, more than 80% and 40%, respectively, of students reported attempting a problem more than once a majority of time (Figure 1B). The authors also asked how many attempts on average per problem the students made while working on PPH or WW. More than 70% of the students who took the survey reported that they tried one to two times for each PPH problem. On the other hand, in WW assignments, only 16.4% of students reported attempting each problem one to two times on average, and more than 80% of students reported attempting a problem three or more times on average (Figure 1C).
An increase in attempts per problem in WW assignments could be associated with software formatting requirements or guesswork in addition to complexity of the problem itself. In response to a question asking whether students were confused with formatting requirements and whether they guessed at the problems while working on WW assignments, 16.95% of students reported never having guessed at the problems, whereas 38.98% reported that they were not confused by the formatting requirements. The rest of the students reported guessing or being confused by the formatting requirements at least occasionally (Figure 1D), which could potentially be the reason for the increased number of attempts in WW per problem compared with PPH.
Students tend to do WW on own
With WW, students can complete assignments from anywhere they have internet access. Also, WW problems have randomized parameters with different values for different students to reduce the issue of students copying final answers. For PPH in this evaluation, students were encouraged to work in groups, but to write up solutions individually. Working in groups can benefit the students by fostering friendships and developing interpersonal skills. In WW assignments, the authors were interested in how the online nature of assignments had impacted working in groups, and the data shows that more than 50% of the students worked on WW assignments alone, whereas only 32% reported working alone on PPH (Figure 2A).
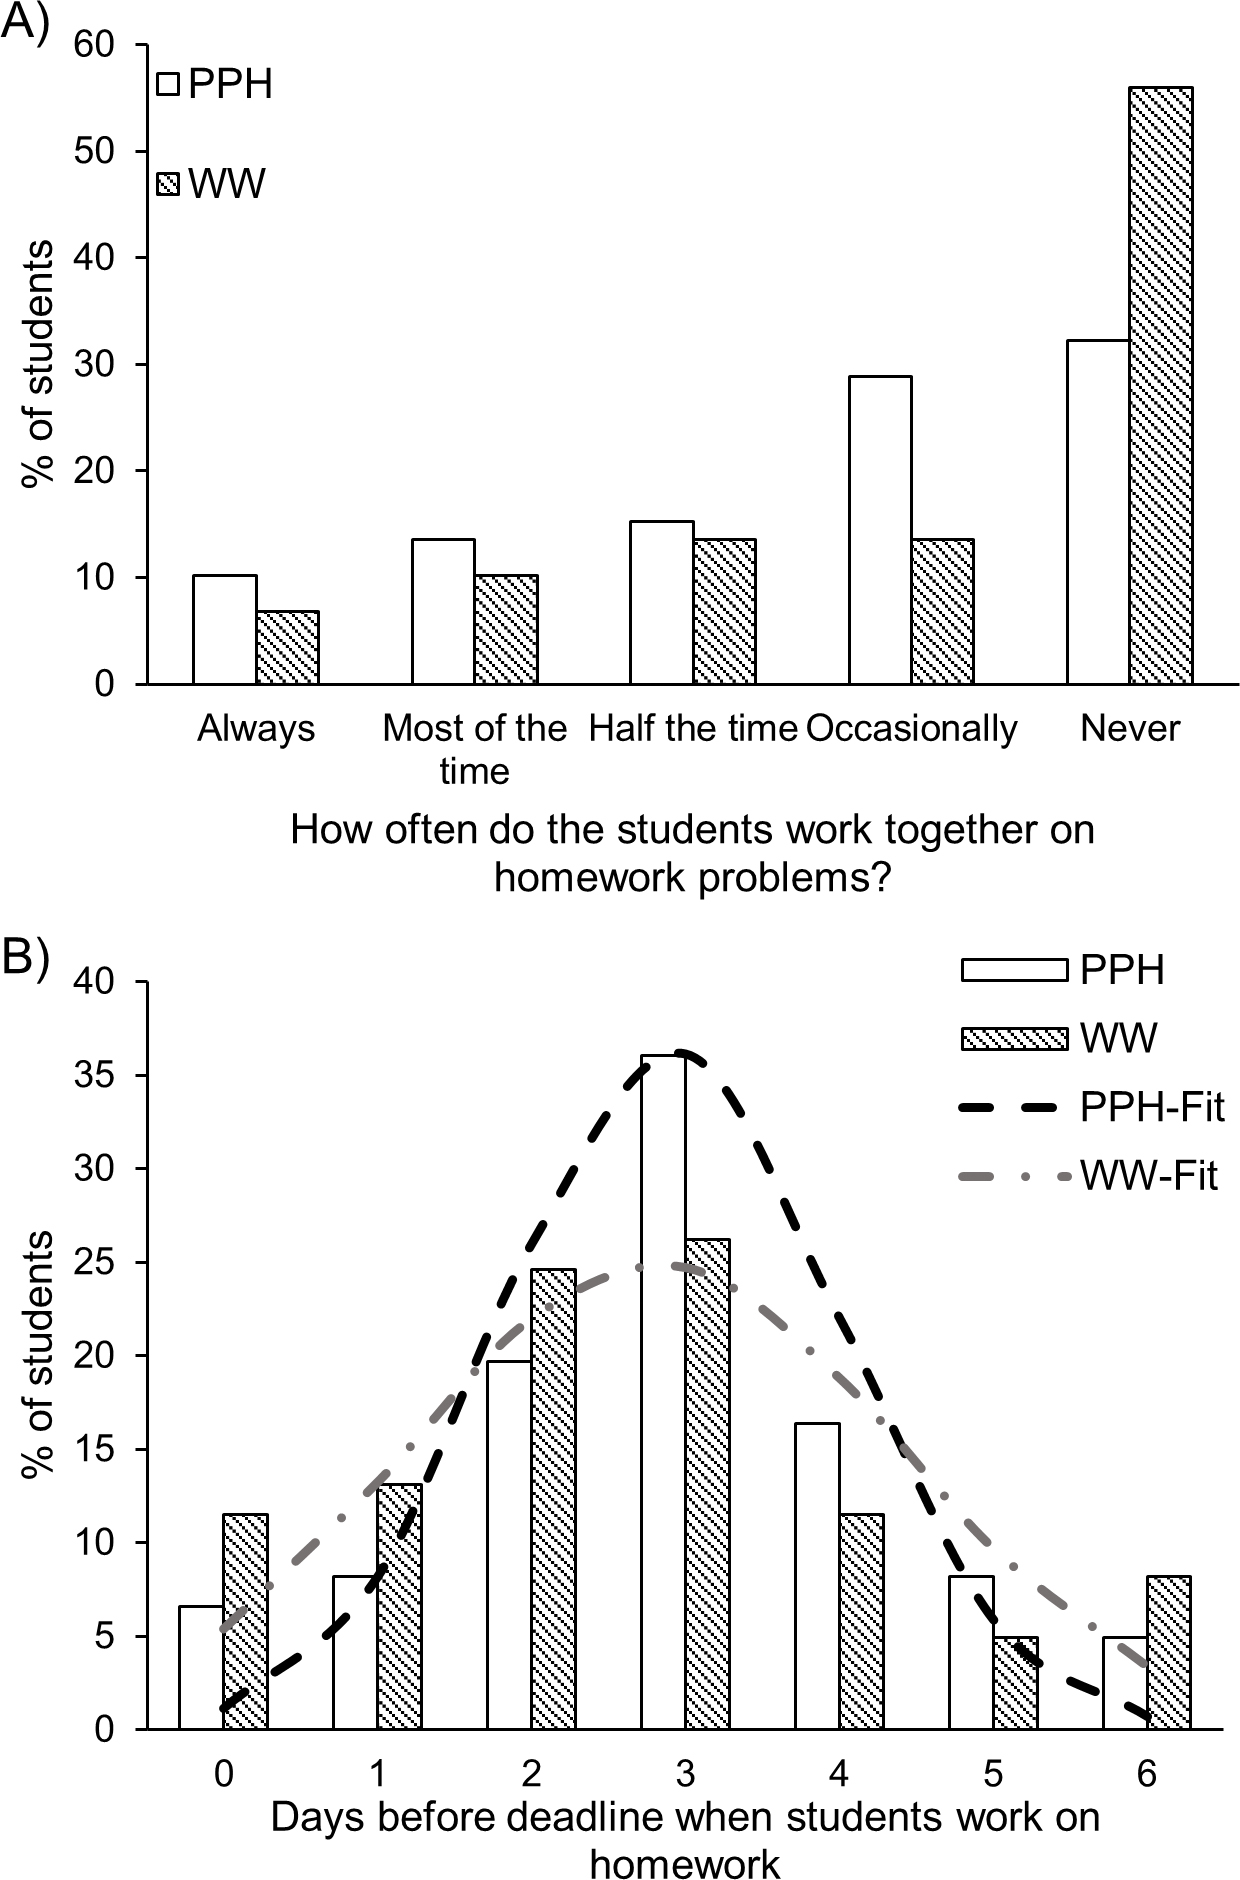
(A) Distribution of student responses to “How often do the students work together on homework problems?” (B) Distribution of student responses on the time when they start working on homework problems. The fit corresponds to normal distribution with µ = 2.9 and σ = 1.1 for PPH (pencil-and-paper–based homework) and µ = 2.8 and σ = 1.6 for WW (WeBWorK).
The authors also asked students about their timeline for working on assignments, specifically, “How many days before the deadline do you [the students] start working on the assignments?” The authors observed that the majority of the students started working on both PPH and WW 2 to 3 days before the deadline. It is important to note that the distribution of student response was much narrower for PPH (σ = 1.1) compared with WW (σ = 1.6), indicating that the students start to work on PPH at a similar time during the week. In WW assignments, on the other hand, the broader distribution indicates the students tend to work on the problems alone on their own schedule.
Similar reported resilience and self-efficacy
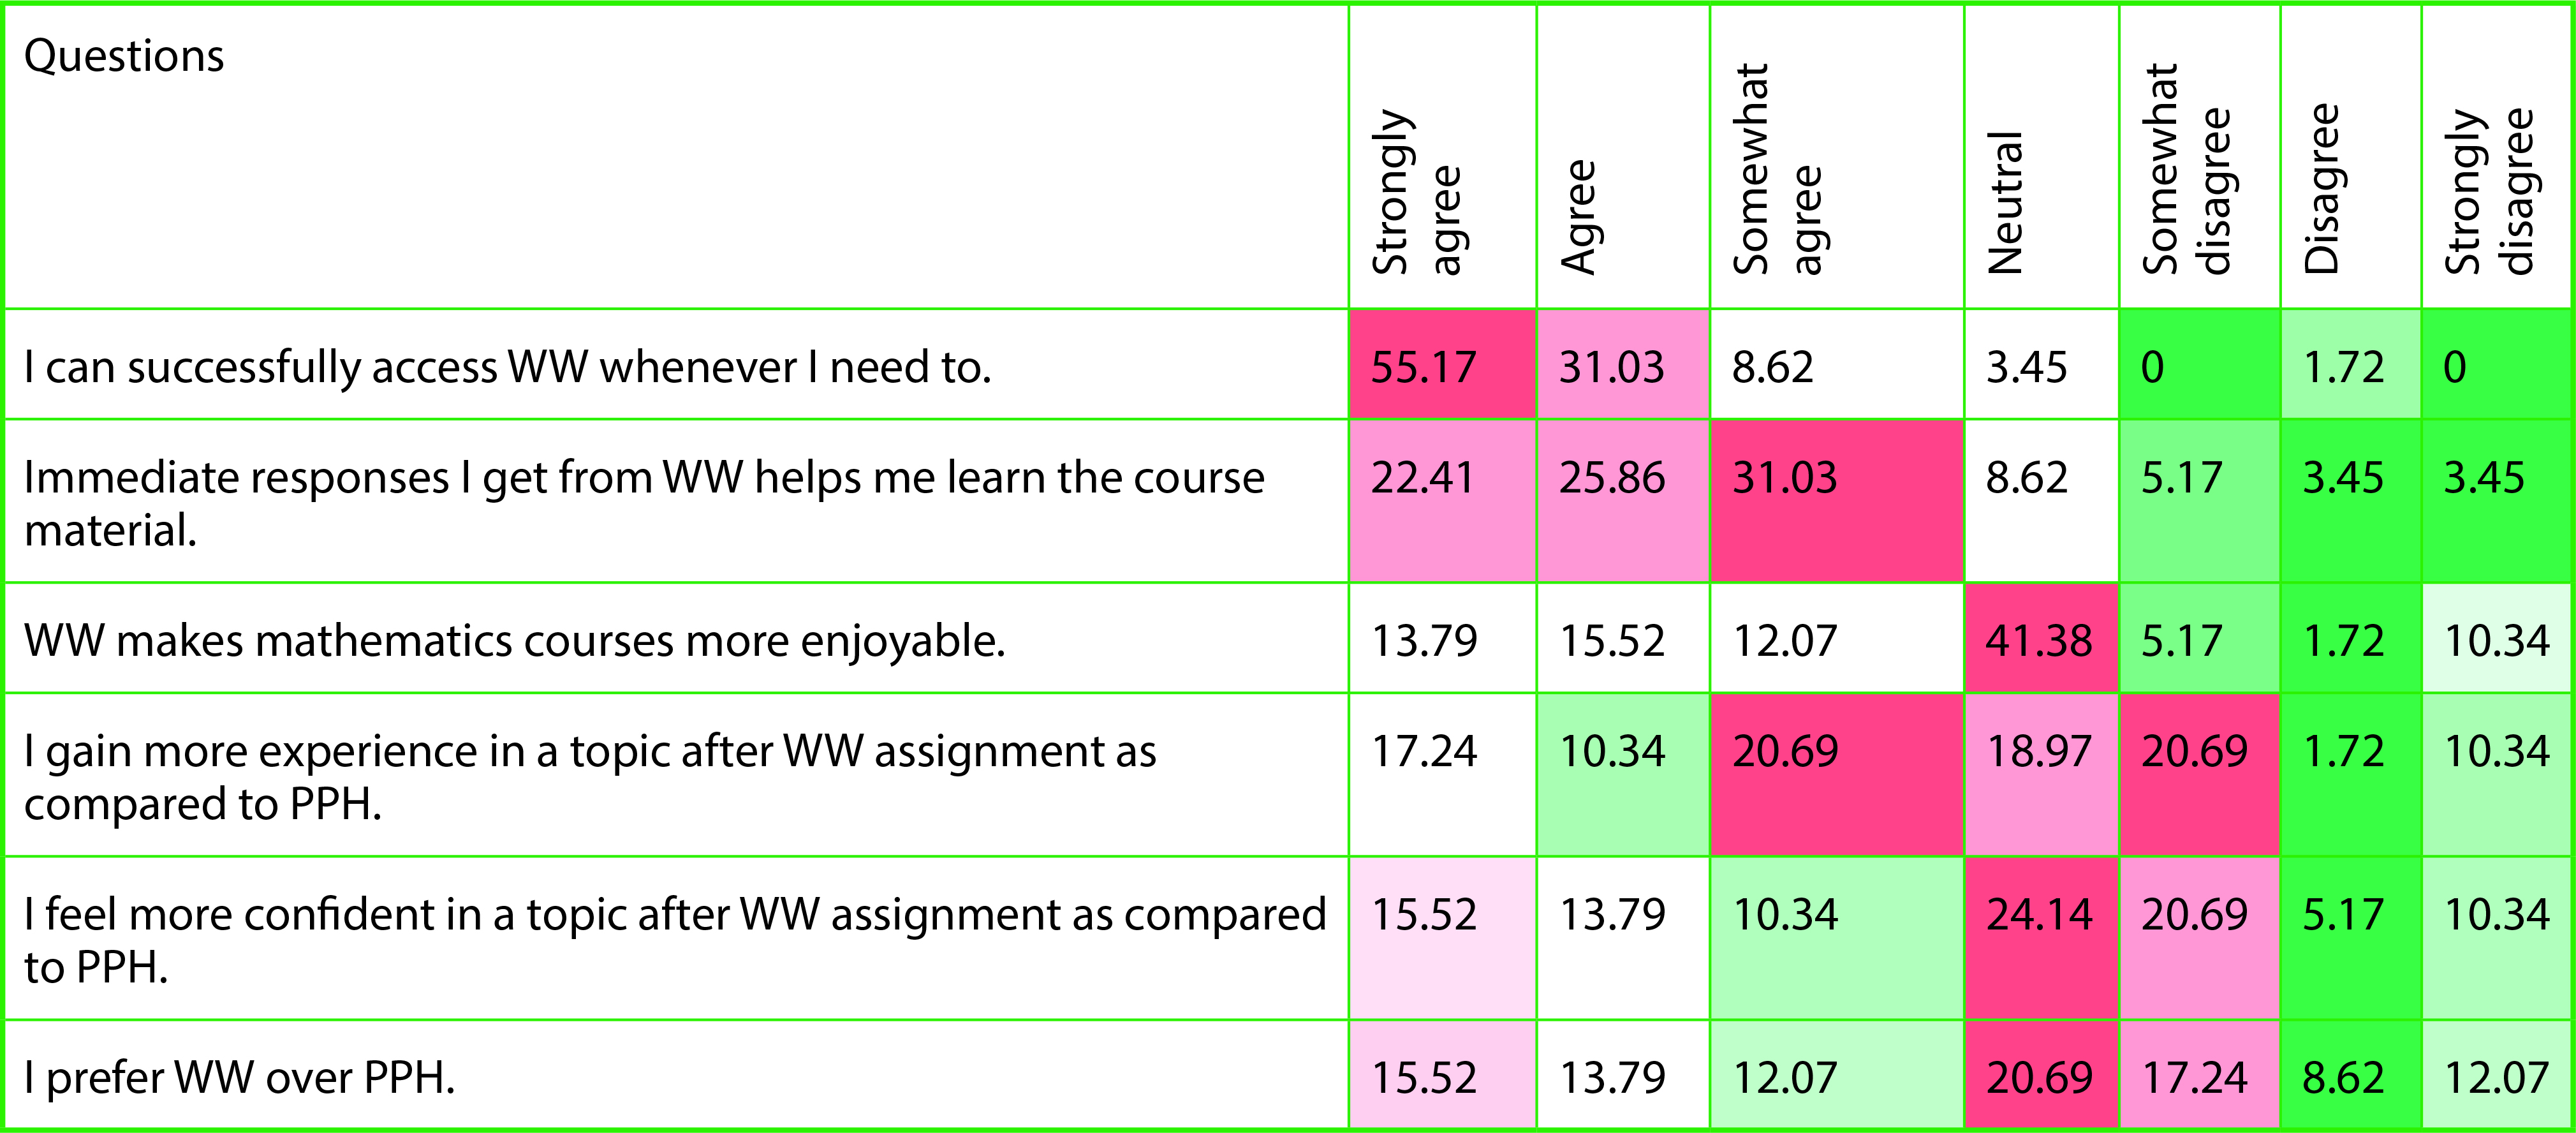
The majority of the students reported never giving up on a problem because of mathematical difficulty in both PPH (44.07%) and WW (50.85%; Figure 3A). The student response to giving up on a problem was very similar in both PPH and WW, indicating that the mode of assignment does not affect students’ resilience while solving problems. The authors next assessed self-efficacy by asking whether the students gained more experience in the topic and whether they felt more confident in their ability to solve a problem when working on PPH compared with WW. The student response was split evenly, with one half indicating that they agreed to some extent and the other half indicating that they disagreed with the above statements relating to self-efficacy. Overall, this response was also similar to students’ response to preference for the mode of homework, that is, PPH versus WW. Other general perceptions of students are shown in Table 2.
![(A) Distribution of student response to “How often do students give up on a problem due to mathematical difficulty?” (B) Word cloud for common terms used by students when asked “What did you [the students] dislike about using WW?” PHH = pencil-and-paper–based homework; WW = WeBWorK.](/sites/default/files/2020-12/JCST_08_Figure3.jpg)
(A) Distribution of student response to “How often do students give up on a problem due to mathematical difficulty?” (B) Word cloud for common terms used by students when asked “What did you [the students] dislike about using WW?” PHH = pencil-and-paper–based homework; WW = WeBWorK.
| Distribution of student response on different aspects including accessibility, immediate response, self-efficacy, and preference of WW (WeBWorK) over PPH (pencil-and-paper–based homework); red = high, green = low, with darker shadings indicating greater | |
|---|---|
|
The authors also asked students to express what they liked or disliked about WW by allowing for free space at the end of the questionnaire. Of the respondents, 67.6% liked the immediate feedback feature of WW, 13.5% liked the ability to attempt unlimited times, and 8.11% liked the ease of use of WW. The things that students did not like about WW included formatting issues, that just the final answer counts, and the lack of hints; these comments are summarized as a word cloud in Figure 3B, which includes only comments that were expressed by more than one student.
Similar student performance
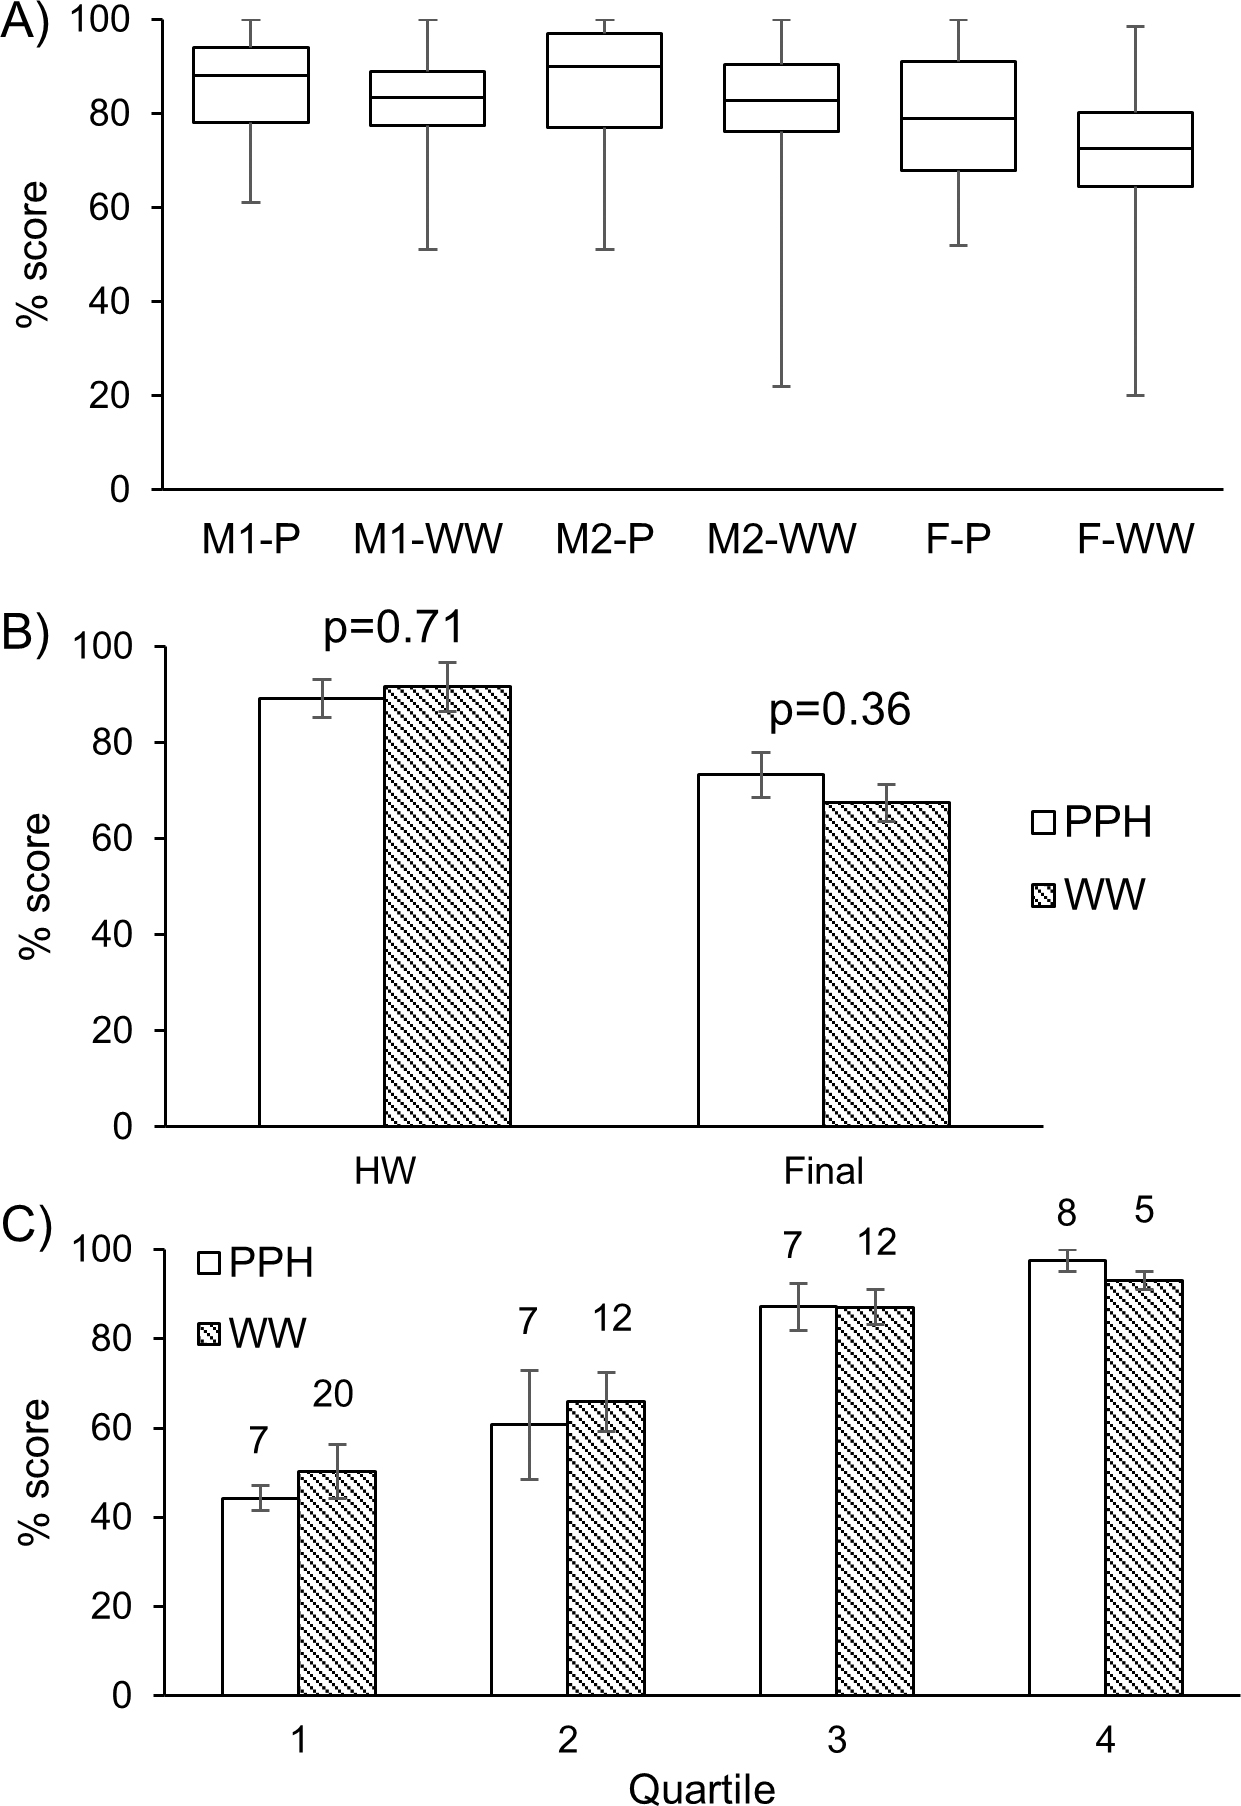
The authors investigated whether using PPH or WW as a mode of homework led to differences in student performance in exams. Students from two sections were divided randomly into two cohorts, and the same problems on one topic were assigned as WW (Cohort 1) or PPH (Cohort 2). The two cohorts had similar overall performance on the two midterm examinations and also the final exam (Figure 4A). The scores of students on the corresponding homework assignment were also similar in the two cohorts, assessed using a two-tailed t-test (Cohort 1, WW: mean(HW) = 91.58, SD(HW) = 27.64; Cohort 2, PPH: mean(HW) = 89.20, SD(HW) = 25.48; t(76) = 0.38, p = .71; Figure 4B). The performance of cohorts was compared by examining scores on a single, two-part final exam problem using a two-tailed t-test, and there was no statistically significant difference (Cohort 1, WW: mean(Final) = 67.45, SD(Final) = 27.04; Cohort 2, PPH: mean(Final) = 73.28, SD(Final) = 27.43; t(76) =—0.91, p = .36) between scores on that final exam problem (Figure 4B). Students from each cohort were further divided into four subgroups on the basis of their overall average scores in two midterms and one final exam, with the cutoffs for the four quartiles determined by the PPH cohort. The performance on the final exam problem of the students belonging to these quartiles is shown in Figure 4C. There was no substantial difference in student performance even in these subgroups.
Student performance on a topic is not affected due to WW (WeBWorK) compared with PPH (pencil-and-paper–based homework).
(A) Comparison of performance of the two cohorts that were assigned either PPH or WW on one topic. Lower error bars represent minimum scores while upper error bars represent maximum scores. Abbreviations: M1: midterm 1, M2 = midterm 2, F = final, P = PPH cohort, W = WW cohort.
(B) Percent scores earned by students in the homework on the topic of exponential random variables and final exam on Problem 7 (parts a and b), which dealt with similar concepts as those given in homework. PPH and WW groups correspond to students who either used PPH (N = 29) or WW (N = 49) as the mode of homework assignment for the same topic. Error bars represent SEM. Data was anonymized prior to analysis. Results not significant (p > .05) using student’s t-test (p = .71 on the homework and p = .36 on final exam Problem 7).
(C) Percent scores earned by students in the final exam on Problem 7 (parts a and b) for students from four quartiles. Cutoff was based on average performance of students in midterms and final exam in the PPH cohort. Error bars represent SEM. Data was anonymized prior to analysis. Numbers on each bar represent the number of students in each subgroup.
Discussion
Homework is critical in mathematics education, and its relevance in student learning is well established (Bas et al. 2017). The time spent on a problem correlates with student performance (Cooper, Robinson, & Patall 2006), and in this evaluation, the authors found that there was no significant change in the self-reported average time spent on a problem when working on PPH or WW, despite a higher number of attempts per problem while using WW. The students, potentially, spend less time per attempt on a problem when using WW compared with PPH. An increase in the number of attempts could be attributed to guesswork or formatting issues in WW, and previous studies found that the time spent per attempt is more important than the time spent on a problem (Bowman, Gulacar, & King, 2014). Bowman et al. (2014) recommended a limit on the number of attempts, which would force the students to think before attempting a problem (Bowman et al., 2014); however, this can also obstruct trial-and-error–based learning by the students. Also, having an unlimited number of attempts was a highly appreciated feature of WW among students in this evaluation. They recommended improving WW by showing the correct solution after the homework deadline or providing hints while solving the problem, both of which could be beneficial in validating students’ methodology and directing them toward the correct solution. Overall, the authors in this evaluation show that there is a negligible difference in total time spent on a problem by students while working on PPH or WW.
One of the advantages of PPH over WW appears to be students working more in groups outside the classroom, which can have beneficial effects on student learning and development. The percentage of students who never worked in groups for WW problems was 55.93%, compared with 32.2% for PPH. WW typically creates personalized questions for each student to discourage copying answers from another student; however, it may also discourage group interaction in general. Useful group interactions can be encouraged in other ways, for example, having some component of homework in the form of PPH or including group activities during class. It would be interesting to study what causes students to work in groups in the first place. There could be several factors, including the delivery method or the randomized parameters, that could lead to less group activity occurring in WW than in PPH.
The authors did not observe any differences in self-reported resilience and self-efficacy among students due to PPH compared with WW. The survey tested the theory that an increased number of attempts in WW would provide more experience and practice compared with PPH. Interestingly, the response from students indicates that despite an increase in attempts, they did not perceive any difference in confidence or experience. It would be interesting to evaluate whether the higher number of attempts in WW derives partly from guesswork or formatting errors, or from other sources.
The authors also studied whether using PPH or WW for a topic would affect students’ performance and observed that the students did not show any significant differences in their score on a problem in the final exam. This was also true for students divided in different quartiles on the basis of their average performance in midterms and final exam. Overall, students did not have any preference of WW over PPH, and using WW did not affect the students’ performance, resilience, self-efficacy, and average time spent on a problem. Because WW is a free, open-source software system, the cost involved with hiring graders for PPH is much higher than that associated with WW. Therefore, the results from this evaluation suggest that WW has the potential to be a useful supplement or partial replacement for some PPH in mathematics courses.
Acknowledgments
We would like to thank the DELTA Intern program at UW–Madison and also Devin Wixon for helping conceive of this project and providing useful suggestions for the overall approach.
Philip Matchett Wood (pmwood@math.wisc.edu) is an assistant professor in the Department of Mathematics at the University of Wisconsin–Madison. Vijesh Bhute is a postdoctoral researcher in the School of Clinical Medicine, Cambridge Institute for Medical Research, in Cambridge, England.
Mathematics Research Teacher Preparation Teaching Strategies