Middle School | Daily Do
How Can Feeding the Planet Change the Ocean?
Climate Change Disciplinary Core Ideas Is Lesson Plan Life Science NGSS Phenomena Science and Engineering Practices Three-Dimensional Learning Middle School Grades 6-8
Sensemaking Checklist


Summary
Middle school students investigate interdependent relationships in ecosystems to answer the following student–generated driving question: How can feeding the planet change the ocean? Students are introduced to two phenomena in the Gulf of Mexico (fish kill and algal bloom). After generating questions, students develop an initial model that offers a potential explanation for what is happening to two populations in the aquatic ecosystem. Students consider the cause-and-effect relationships within the ecosystem. Using information from several infographics, articles, and the film Our Beautiful Planet: In Search of Nitrogen, students revise their models to explain how nutrient pollution from farms led to a change in the aquatic ecosystem. Students use their model to discuss solutions that would produce the food needed by humans while also protecting aquatic ecosystems.
Click the Download PDF button above for the complete Lesson Plan.
Note: There is a typo in the Standards box of the PDF. In the lesson, students develop their understanding of the following DCI.
LS2.A: Interdependent Relationships in Ecosystems
- Growth of organisms and population increases are limited by access to resources.
Experiencing the Phenomenon
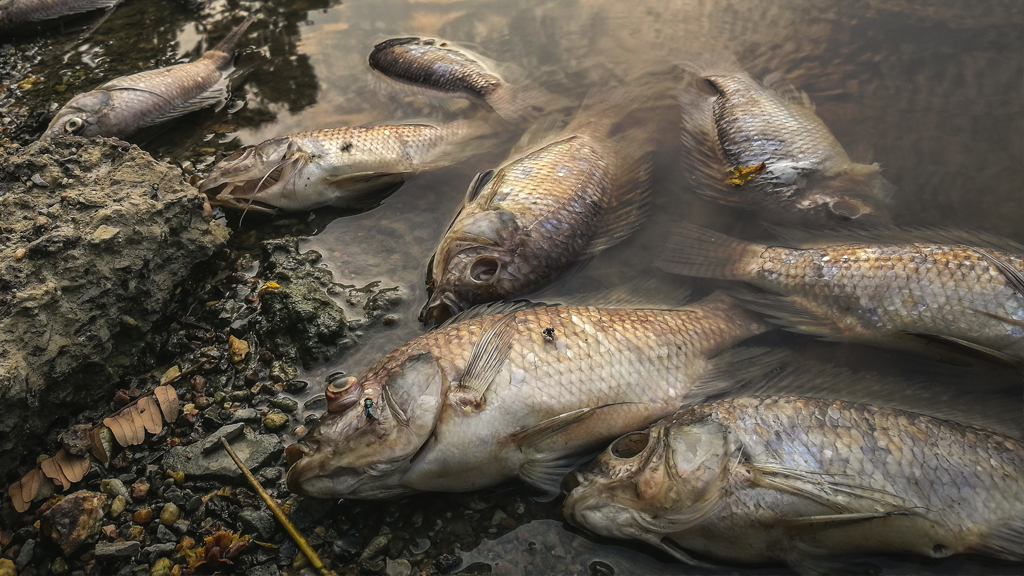
Tell students that you have two phenomena to share with them. These phenomena are becoming more and more common. Direct students to the three photos on page one of the In Search of Nitrogen Student Reference Sheet. Tell students that the photos were taken in August 2017 in the Gulf of Mexico. Ask them to consider these questions:
- What do you observe in the photos?
- Do you think these phenomena might be related to one another? Why do you think so?
- Have you experienced or heard about anything like this before?
After providing time for students to independently observe the photos, have them share their thoughts and experiences with a partner or small group. Tell students that when time is up, each group will need to share at least one observation and one question they have about the phenomena shown in the photos.
S= Discuss ideas and questions about the photos.
T= Circulate and listen for students who mention ideas about algae, or ideas about how organisms in an ecosystem affect one another.
Students’ questions may include these:
- Why did all the fish die?
- Why would algae make the water unsafe? Isn’t that where algae grow?
- Do algae (algal blooms) kill the fish?
- We swim in algae water all the time, and nothing happens. Are those algae poisonous?
- Could the fish eat the algae?
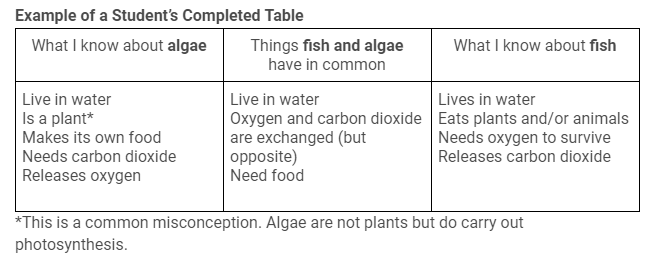
Point out that many of the questions are about the relationship between fish and algae in the (Gulf of Mexico) ecosystem. Ask students to work independently to document what they know about fish and algae, then identify what fish and algae have in common. Students can create a Venn diagram or use a three-column table (like the one shown below) to help organize their thinking.
Additional Guidance. The use of a thinking tool (e.g., Venn diagram, table) can help students narrow their focus on a small part or subsystem of a larger system.
Assign students to small groups and instruct them to collaboratively develop a model that explains the relationship between the algae and the fish phenomena. Encourage students to use words, pictures, symbols, colors, etc., to communicate their thinking.
Student models will vary and could represent different relationships between the fish and the algae. For example, some students may develop a model that includes the fish living because they ate the algae, while others may represent the algae as the cause of fish dying. Do not correct inaccurate ideas. At this point in the lesson, the class is still gathering ideas to explain their observations of the phenomena shown in the photos.
Next, engage students in a gallery walk to observe and record similarities and differences between their group model and other group models.
When the gallery walk has concluded, give students a few minutes in their groups to discuss the similarities and differences they observed before facilitating a whole-group discussion.
Figuring Out What We Know
Now that students have represented their ideas about how algae and fish phenomena are related, hold a class consensus discussion to identify what students agree and disagree on.
Start this discussion by asking students what similarities they noticed among group models. Students will likely share these common components among the models: fish, algae, water, the Sun, carbon dioxide, and oxygen. Models may also represent the flow of matter and/or energy between components.
Next, ask students to share the differences they observed. The group models will likely disagree on the relationship between the algae and the fish in the (Gulf of Mexico) ecosystem.
Ask students, “What types of data or information do you think we need to figure out if a cause-and-effect relationship exists between the algae and the fish?”
Provide time for students to discuss the question with their group members. Walk around the room and listen for students who share that they need more information about algae. Transition to a whole-group discussion, and call on these students first. Work toward consensus about the need to gather information about algae. You might say, “What new questions do we have about algae that might help us move forward?”
Gathering Data
Share the article “What is a harmful algal bloom?” (https://www.noaa.gov/what-is-harmful-algal-bloom) with students, and ask them to read Part 1 individually. Instruct students to document information they think will be helpful in explaining the fish and algae phenomena. Encourage them to record any questions they have about what they have read.
(Note: The article begins with a simplified explanation of algae that classifies algae as plants.)
Next, send students back to their small groups, and ask them to read the infographic What Is Nutrient Pollution? (https://www.epa.gov/nutrientpollution/infographic-what-nutrient-pollution) and discuss how the information provided can help them explain the events observed in the three photographs.
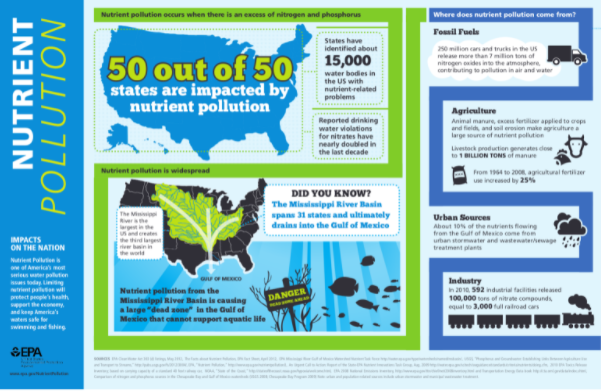
Source: United States Environmental Protection Agency
Ask student groups to complete the following cause-and-effect chain. Inform them that they can include as many boxes between nutrient pollution and dead zone as they need to describe the relationship.
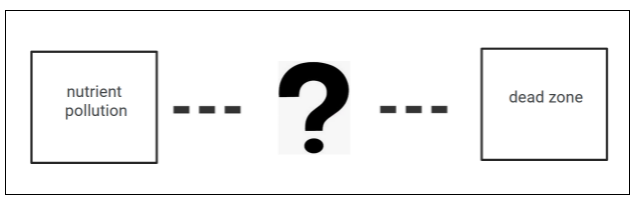
Bring students together to reach consensus on the cause-and-effect relationship between nutrient pollution and dead zones. Display the depiction of the cause-and-effect relationship where it is easily visible to all students.
Display the 2021 Gulf of Mexico Hypoxic Zone Size (https://www.epa.gov/ms-htf/northern-gulf-mexico-hypoxic-zone) map. Tell students the yellow, orange, and red colors collectively represent the area the dead zone covers. You might ask students to calculate the total dead zone area to help them appreciate the scale of the problem caused by nutrient pollution.

Source: United States Environmental Protection Agency
Next, ask students to share the sources of nutrient pollution in the Gulf of Mexico. If only a few students volunteer, direct them to revisit the What Is Nutrient Pollution? infographic, which identifies the sources of nutrient pollution as fossil fuels, agriculture, urban sources, and industry.
Share the data presented in the Sources of Nutrients Released Into the Gulf of Mexico graphic (below). Make sure students can identify agriculture as the largest contributor of nutrient pollution to the Gulf of Mexico.
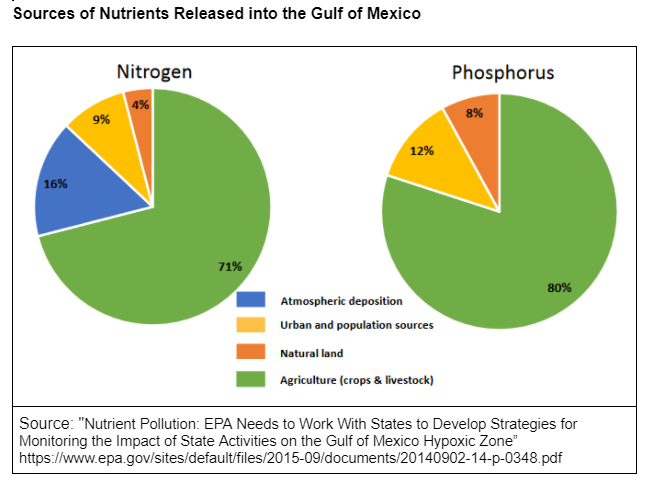
Ask students to turn to a partner and share their ideas about where the animal waste and fertilizer that enters the Gulf of Mexico comes from. Invite three or four students to share their ideas with the class; you might ask the other students in the room to put their thumbs up if they agree with the sharer, thumbs down if they disagree, and thumbs sideways if they are unsure.
Acknowledge that the class has different ideas about where the animal waste and fertilizer that enters the Gulf of Mexico comes from. Tell students you have a video that shares more information about the sources of animal waste and fertilizer. Play the film Our Beautiful Planet: In Search of Nitrogen from the start to 4:36.
Taking Stock
Lead a class discussion to create a list of what the class has figured out about how the algal bloom and fish kill phenomena are related. Students should have figured out these ideas:
- Fertilizer and animal waste are used on food crops.
- Only about half of the fertilizer is used by plants. The rest goes into the air or runs off into streams and rivers.
- The nutrients (nitrogen) from fertilizer runoff cause algal blooms.
- Bacteria that decompose dead algae use oxygen from the water and don’t leave enough oxygen for the fish and other animals. The fish die.
- The areas without oxygen (or with little oxygen) are called dead zones.
What Did We Figure Out? (Making Sense)
Ask students to return to their group models to revise their model (or create a new model) to explain how algal blooms and fish kills occur and how these phenomena are related to each other. Encourage students to use pictures, words, and symbols to communicate their thinking.
Look for the following components and interactions in the group consensus models:
- Nitrogen and other nutrients entering (or being present in) the ocean
- Algae using the nitrogen (nutrients) for growth
- Sun as the energy source for photosynthesis
- Dead algae decomposing
- Indication that oxygen is needed for the process of decomposition
- Fish dying from lack of oxygen in the water
To assess individual students’ understanding, consider asking them to share what they added to and/or changed on their group model and why they made these additions/changes.
Solving the Problem of Nutrient Pollution
Ask students to brainstorm with a partner how people might solve the problem of reducing the amount of animal waste and fertilizer that enters the Gulf of Mexico. As you walk around the room, use questioning to push students’ thinking deeper. For example, you might ask the following:
- How might you reduce the amount of fertilizer used without reducing the amount of food produced?
- How might you keep the fertilizer from running off into streams and rivers?
- How might you remove fertilizer from streams/rivers/the Gulf of Mexico?
Bring the students back together. Consider asking students to share their initial ideas about solutions. Record the ideas and display them in a space where all students can view them.
Tell students that scientists and engineers are working to design solutions to the problem of reducing the amount of nitrogen pollution entering the Gulf of Mexico and other large bodies of water.
Play Our Beautiful Planet: In Search of Nitrogen from 4:36 to the end. After students watch the film, lead a discussion about nitrogen and what new technology is being used to help stop nitrogen pollution (nutrient pollution). You might use the following prompts to facilitate the discussion:
- How could sensors help reduce the Gulf of Mexico dead zone and other areas?
- Besides reducing nitrogen pollution from bodies of water, what other changes are being made to reduce pollution?
Finally, share that because algal blooms are a concern in every state, students might explore citizen science opportunities to support efforts to solve the problem of nutrient pollution. If time permits, you might allow students time to visit the Citizen Scientists Track Algal Blooms (https://www1.grc.nasa.gov/citizen-scientists-track-algal-blooms/) website.
Meet Will Tarpeh
Will Tarpeh is an assistant professor of chemical engineering at Stanford University. Tarpeh’s research involves reimagining liquid waste streams as resources and enabling more efficient, less costly approaches to reducing harmful discharges to the environment. He is developing novel technologies to capture pollutants in effluent streams so that they may be used as valuable inputs to other processes. For example, municipal wastewater contains resources like energy, water, nutrients, and metals. The Tarpeh Lab develops and evaluates novel approaches to resource recovery from “waste” waters at several synergistic scales: molecular mechanisms of chemical transport and transformation; novel unit processes that increase resource efficiency; and systems-level assessments that identify optimization opportunities. His team employs understandings of electrochemistry, separations, thermodynamics, kinetics, and reactor design to preferentially recover resources from waste. They leverage these molecular-scale insights to increase the sustainability of engineered processes in terms of energy, environmental impact, and cost.
About the Our Beautiful Planet Film Series
This lesson is based on information provided in Our Beautiful Planet: In Search of Nitrogen. Our Beautiful Planet is a fascinating new series highlighting the work that climate scientists around the country are doing to solve some of the world’s most pressing issues. These dedicated scientists are seeking to better understand and plan for the realities of our changing climate. The scientists use cutting-edge technology and innovative problem solving, and their answers are sometimes found in rather surprising and unexpected places. This series transports the viewer to some of the most important field work being done today, taking the science out of the classroom and into the world. These compelling stories will not only teach viewers crucial scientific principles, but will also inspire them to use science to examine the issues their own communities face in this changing world and climate. Through these films, the producers hope scientists and citizens alike can come together to safeguard our environment and to protect our beautiful planet. Productions by Kikim Media. Support provided by Kennebunkport Climate Initiative.