
Middle School | Daily Do
How Can We Stay Safe When Lightning Strikes?
Crosscutting Concepts Disciplinary Core Ideas Earth & Space Science Is Lesson Plan NGSS Phenomena Science and Engineering Practices Three-Dimensional Learning Middle School Grades 6-8
Introduction
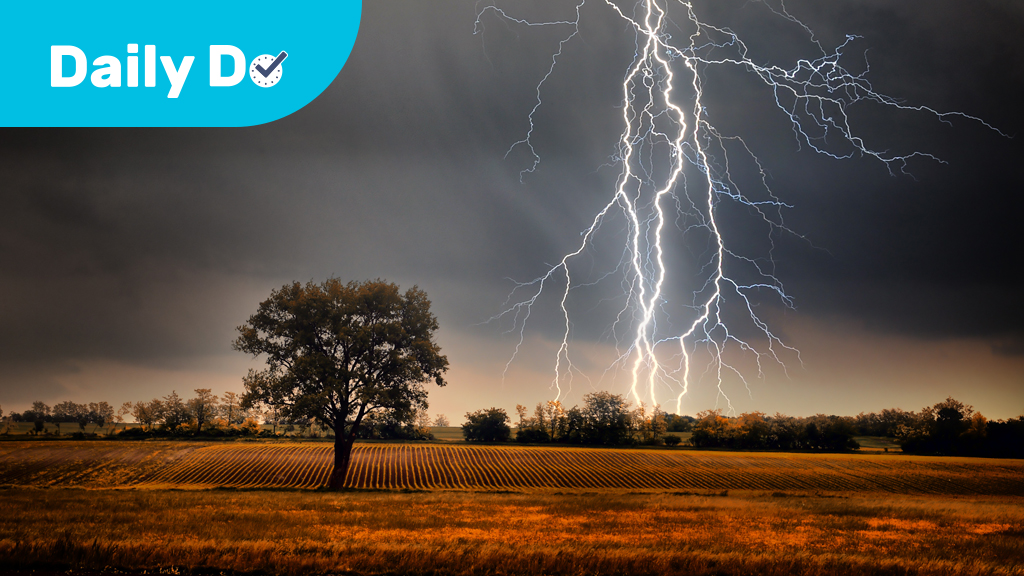
Lightning is both beautiful and dangerous. Many people are unaware that lightning kills more people in the United States than hurricanes or tornadoes.
In today's task, How can we stay safe when lightning strikes?, students analyze multiple sets of lightning data and use the thinking tool of patterns to explain why living in a state with low number of lightning strikes each year doesn't necessarily make you safe from lightning. This motivates students to learn how to stay safe when lightning strikes.
Lightning Strikes
Share the Lightning Strikes at 2019 U.S. Women's Open video and ask students to make and record observations. Next, ask students to think about a time when they experienced lightning (in person, through stories, or in media) and record one thing that was similar to what they observed in the video or one thing that was different.
Give students one to two minutes to share with a partner one observation from the video and the similar or different observation from their own experience. Students might notice the following:
- Lightning can look different (different shapes, cloud-to-ground, cloud-to-cloud, brightness).
- Lightning can strike when it isn't raining.
- Lightning can strike even when the sky still looks blue.
- Lightning can strike before, during, and after the storm has passed overhead.
- Sometimes it sounds like the lightning and thunder happen at the same time, and sometimes the lightning and thunder are seen/heard far apart.
Next, ask students to share with the class where the lightning they experienced occurred. If most of the locations are local, you might contribute one place you've experienced lightning outside the area and share that the lightning in the video occurred in Charleston, South Carolina.
You might navigate students to the task by saying, "We've noticed lightning occurs in many different places. Does anyone wonder where else lightning occurs?"

Investigation
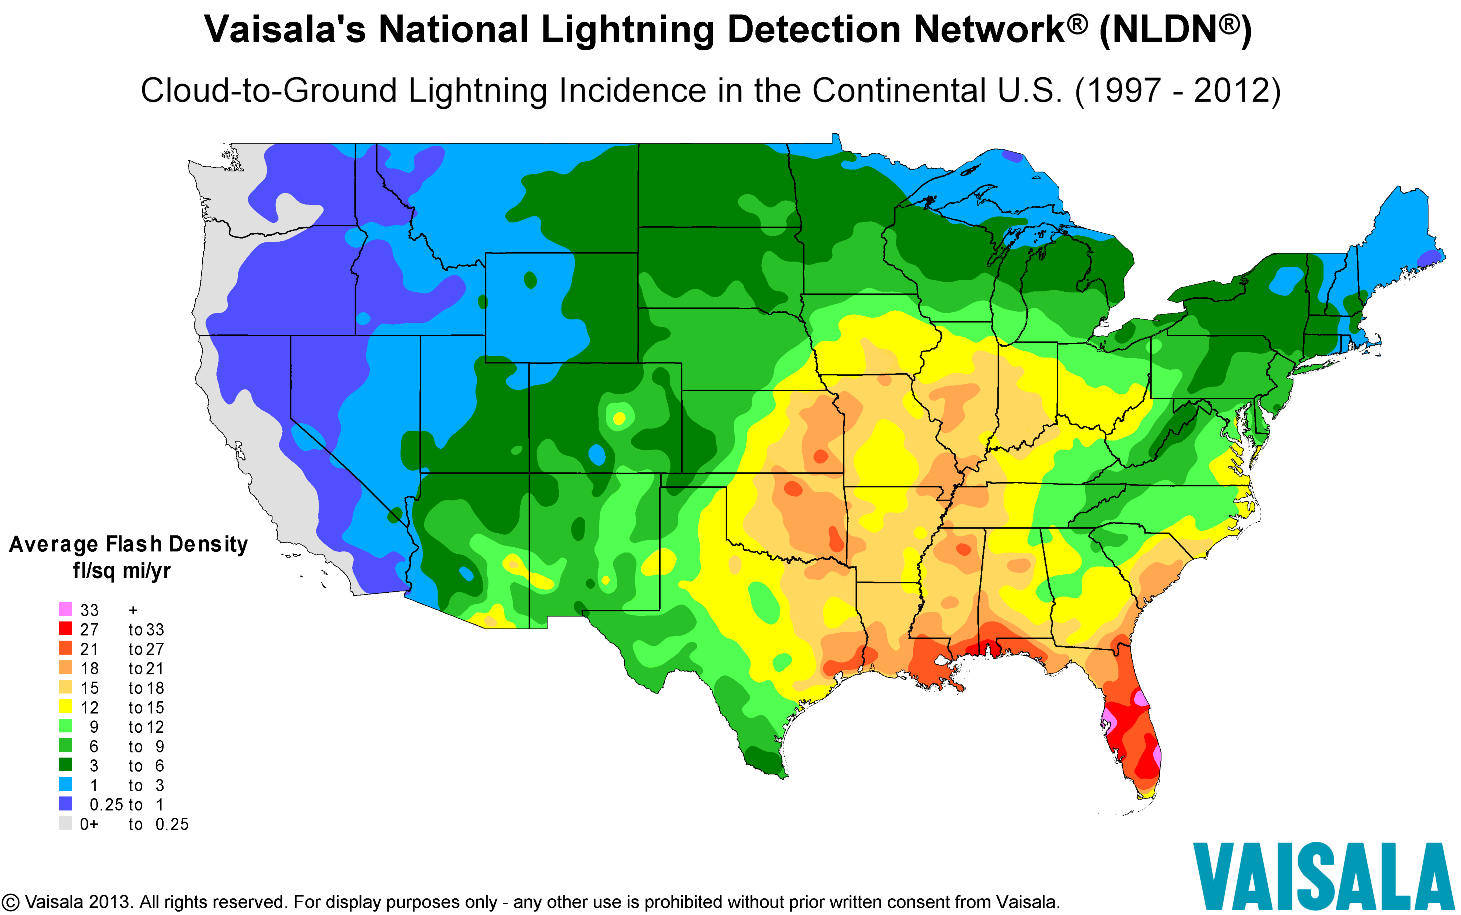
Share the Cloud to Ground Lightning Incidences in the Continental U.S. (1997–2012) map with students. Tell students that the colors represent the average amount of lightning that occurs within an area each year. Red is used to show the highest average amount of lightning that occurs and dark blue shows the lowest average. Grey means the average amount of lightning that occurs each year is zero. (Depending on the age of your students, you might need to share that an average of zero doesn't mean lightning never strikes in this area.)
Ask students to work in pairs to identify patterns in the data represented on the map and record them. Then ask students to share the patterns they observed with the class. Students might say the following:
- Most lightning happens in Florida.
- Florida is the only state with pink.
- The colors form a rainbow. ("Would you tell me a little bit more about that?")
- As you get away from Florida, the amount of lightning becomes less and less.
- Every state gets some lightning.
- The amount of lightning mostly goes down as you get away from Florida, but there are some small spots with lots of lightning.
Ask students to turn and talk with their partner to answer this question: "Based on this data, which states do you think have the most fatalities (deaths) caused by lightning? Which states do you think have the least?" Ask students to record their predictions.
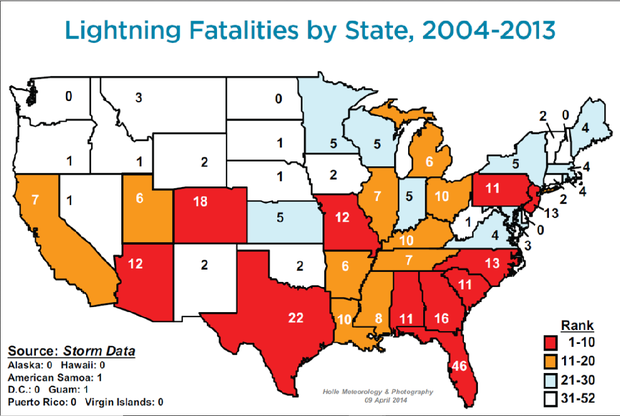
Share the Lightning Fatalities by State, 2004–2013, map with students. Ask students if they correctly predicted which states would have the most fatalities and the least fatalities. Students likely included California on their list of states with the least fatalities.
Ask students, "How might we explain why California has a high number of lightning fatalities when the amount of the lightning that occurs is so low?" Give students time to independently think and record ideas. Assign students to groups to share their ideas with one another. Listen for groups to share ideas about the type of jobs or the type of activities people were doing when they were struck by lightning. When you ask groups to share their ideas with the class, make sure to call on the students who shared ideas about the relationship between types of jobs and/or activities and danger of being struck by lightning.
Tell students you have more lightning data to share with them that may help answer the question. Share the Who's at the Greatest Risk From Lightning? video from The Weather Channel. Stop the video at the times noted below to allow students to observe data and to add to or change their ideas about why California has a high number of lightning fatalities:
- 0:19 Time of Day (What time of day does most lightning occur?)
- 0:59 Type of Activity (What type of activity is the most dangerous when lightning is occurring?)
- 1:18 By Leisure Activity (What recreational activity is the most dangerous when lightning is occurring?)
Students might wonder what types of activities are popular in California. Tell them California is known for recreational activities including hiking, camping, fishing, swimming, and golfing. You might share maps of California showing the locations of parks, forests, and recreation areas. (For example, you can click on different regions and reveal the numbers and locations of parks, forests, and recreational areas to give students an idea of the sheer number of places people can hike, camp, fish, swim, etc.)
Ask students to return to their small groups. Remind students of the question they are trying to answer, "Why does California have a high number of lightning fatalities when the amount of lightning that occurs is so low?" Ask students to share their original or revised ideas and support them using evidence from data (which is represented in the maps, bar graphs, and pie charts they've analyzed).
Tell students you have one more video to share (In recent years, camping has been responsible for the most lightning deaths in California). Ask, "Does this match the claim you and/or your group made?"
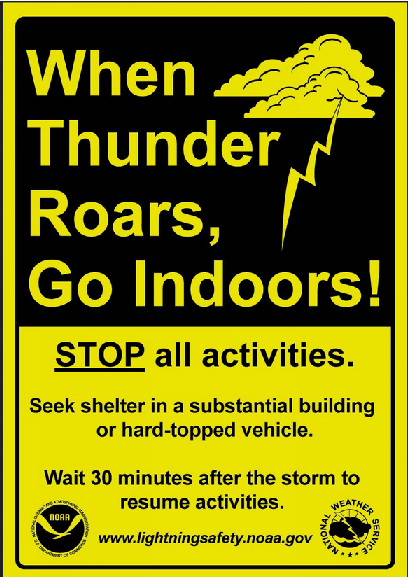
Ask students, "What do you think the newscasters meant by Californians being at higher risk because they aren't 'thinking about' lightning?" Students will likely say that since lightning doesn't strike very often, people don't worry about it and/or they don't know what to do to be safe. Share Lightning Safety for You and Your Family with students. Encourage students to read about lightning safety with their families.