
Elementary | Daily Do
How Can We Use Data to Predict the Length of a Shadow?

Crosscutting Concepts Disciplinary Core Ideas Earth & Space Science Is Lesson Plan NGSS Phenomena Science and Engineering Practices Three-Dimensional Learning Elementary Grade 5
Sensemaking Checklist


Introduction
In today's task, How can we use data to predict the length of a shadow?, students engage in science and engineering practices and use the thinking tools of patterns and cause-and-effect to make sense of the science idea that orbit of the Earth around the Sun and the rotation of Earth on its axis causes changes in the length and direction of shadows.
This Daily Do was inspired by the book Florence The Data Scientist and Her Magical Bookmobile, written by Ryan Kelly and illustrated by Mernie Gallagher-Cole. Check out Reflect on Making Predictions with Data (at the end of this lesson) to learn how to use this story to extend student learning about making predictions using patterns in data and to introduce students to the field of data science.
View the How can we use data to predict the length of a shadow? NGSS table to see the elements of the three dimensions targeted in this lesson.
Materials
- Me and My Shadow formative assessment probe (project or print and share)
- meter stick or measuring tape (to measure shadow length)
- chalk, masking tape, or wire flags to mark shadow length (optional)
- camera/cell phone or tablet with camera (optional)
- open space that receives sunlight all day, like a parking lot, playground, field, or park
Notice and Wonder About Long Shadows
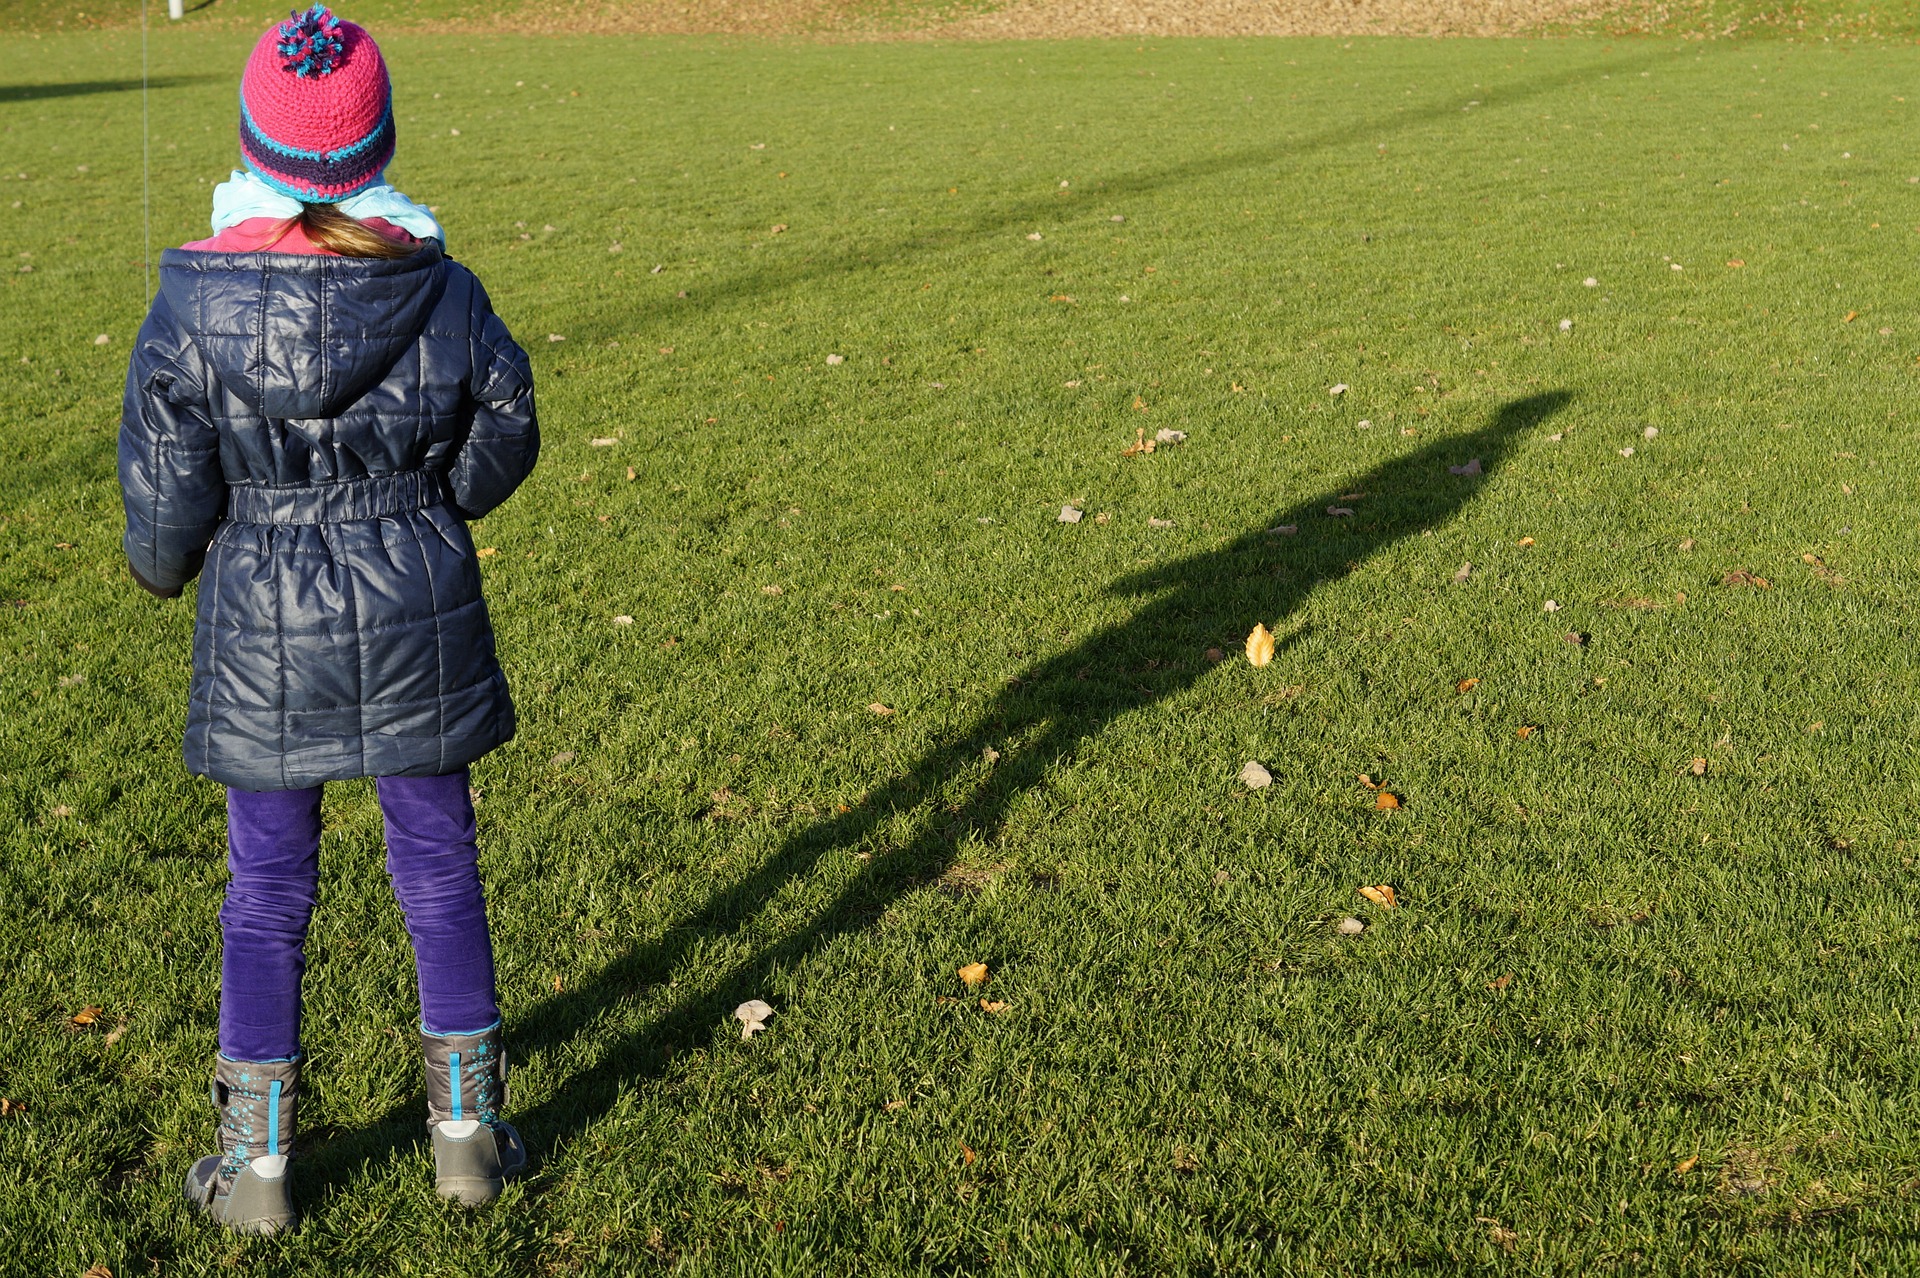
You might say to your students, "I found this interesting picture of a young person and their shadow. What are some things you notice or wonder about this picture?" Give students a minute or two to individually record observation/questions (Alone Zone), then ask them to share their noticings and wonderings with a partner. Bring the class back together and ask students to share their own noticing or a partner's noticing with the whole group. Students may say (with suggested teacher follow-up questions) the following:
- The shadow is long. (How long is the shadow?) The shadow is longer than the person/the shadow looks twice as long as the person.
- The shadow is skinny. (How skinny is the shadow?) The shadow is thinner than the person/the person is wider than the shadow.
- The shadow is dark. (What do you mean by dark?) The shadow doesn't have any color. The shadow is black. You can't really see the color of the grass because the person is blocking the light. (What is the source of light being blocked? Where do you think the sun is compared to the person?)
- The shadow doesn't have details. (Would you say a little bit more about that?) You can't tell what the person is wearing by looking at the shadow. You can't see the person's face in the shadow. You can't see both arms in the shadow.
Say to students, "Many of us noticed the shadow is really long - much longer (taller) than the young person. This makes us wonder when our own shadows are long and if the length of our shadows change (daily/weekly/season to season)."
Share Initial Ideas About Shadow Length
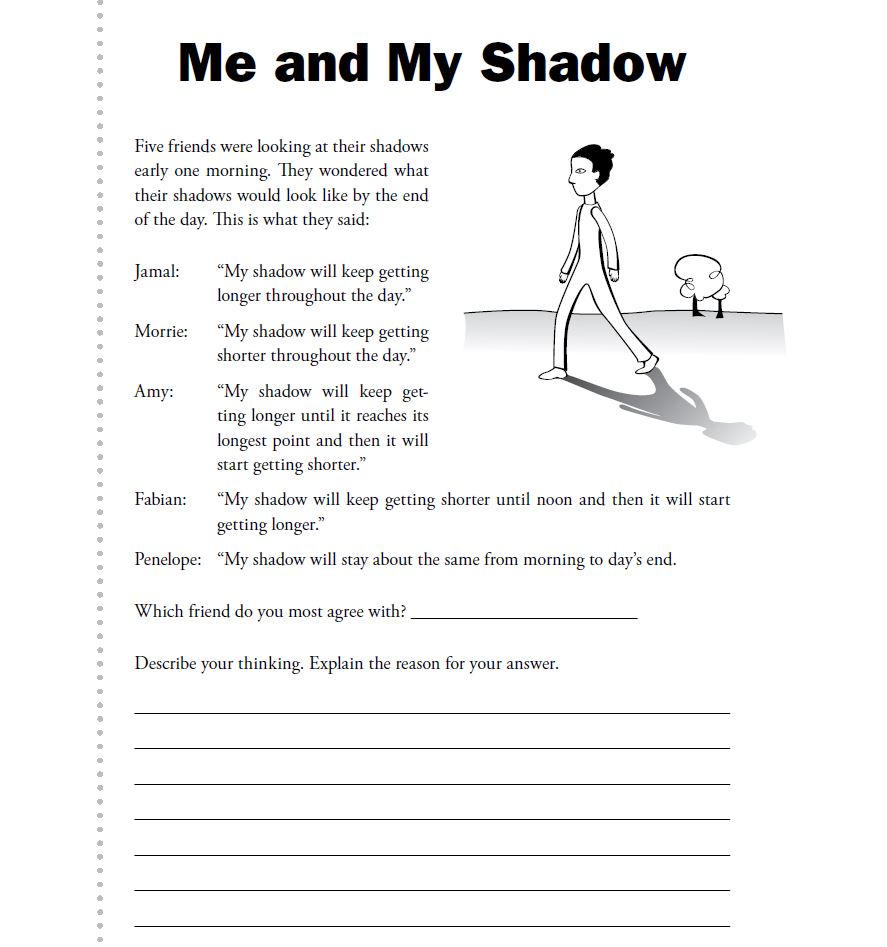
Share the Me and My Shadow formative assessment probe with your students. Ask students to choose the person they most agree with and record their thinking using words, pictures, and/or symbols. Next, ask students to share their thinking with a partner. If you are completing this Daily Do in a distance-learning scenario, consider sharing this Google Docs version of the Me and My Shadow probe with students; digital tools such as Google Slides, Jamboard or Padlet can be used to provide students an opportunity to share ideas with a partner or small group.
Bring the class back together and invite students to share their ideas with the whole class. Consider using these talk moves to support equitable participation and help deepen student thinking about shadows:
- Do you agree or disagree with [Student]'s reason for agreeing with Jamal/Morrie/Amy/Fabian/Penelope? Why do you say so?
- [Student A], can you repeat in your own words what [Student B] just said about why they agree with Jamal/Morrie/Amy/Fabian/Penelope?
- Would someone like to say more about the reasons why some of you chose Jamal/Morrie/Amy/Fabian/Penelope?
Students will likely continue to disagree about which friend they most agree with. This is OK. Welcome all students' ideas and experiences with shadows.
Investigate Shadow Length
Ask students, "How might we investigate which friend—Jamal, Morrie, Amy, Fabian, or Penelope—best explains how shadow length changes during the day?" Give students time to think independently and record their ideas. Then ask them to share their ideas in a small group. As you move around the room, you might ask student groups some or all of the following questions:
- What data do we need to collect?
- How might we measure (quantify) the length of our shadows?
- When should we measure the length of our shadows? Why do you say so?
- What do we need to keep the same each time we go outside to collect data? (How will we keep the tests fair?)
Consider (informally) ranking the groups' investigation plans from least detailed to most detailed to determine the order in which to call on groups when you bring the class back together. This will allow for all groups to genuinely contribute to the class investigation plan. (Do not share rankings or strategy with students).
Bring students back together. Invite groups to share their investigation plan. You might choose to call on the group with the least detailed plan to share first, as described above. Record the "big ideas" in a location easily viewable by all the students in the room (whiteboard, poster, or shared digital space); label these ideas Class Investigation Plan. As each group shares in turn, add to and/or revise the class plan. Consider asking students if they agree (thumbs up) or disagree (thumbs down) with additions/changes to the plan after each group's turn. Investigation plans will vary from class to class, but all plans should include these elements:
- What data will be collected. Students will identify shadow length. You may need to prompt students to include time and other observations.
- How many measurements will be collected. Students should collect data (measure shadows) at least three times during the day: morning, noon (as close to solar noon as possible), and afternoon. Ideally, students would collect two measurements before noon, one measurement at solar noon, and two measurements after noon. Students may also suggest using standard time increments (every hour, every two hours, etc.).
- Units of measurement. Meters are suggested for length, but use units most appropriate for your students (based on current science and math learning). Time may be recorded using AM and PM or a 24-hour clock.
- Measurement "protocol." Students should decide how data will be collected. For example, a partner marks (with chalk, tape, wire flag, etc.) the bottom and top of the shadow, while the person casting the shadow stands tall and still. (Each student then measures their own shadow.) Students may also share (a) they need to stand in the same location for each measurement and (b) define "what counts" as the bottom and top of shadows to keep the tests fair.
You might collaboratively create a data table template, then ask students to draw the table in their science notebooks, or provide each student with a blank data table.
Before bringing students outside, you might consider the following adaptations:
- Making measurements in a space where you can leave shadow length markers in place throughout the day will help students notice (and have a clear record) of a second pattern: The direction of their shadows changes throughout the day.
- Using a meter stick (or other object) to cast shadows will reduce the amount of time it takes students to collect data (three to four students working together to measure and record the length of a shadow cast by their meter stick versus students working in pairs to mark and measure their shadows). Pros—It speeds up data collection and makes data more easily comparable among groups. Con—It may reduce engagement because students are no longer personally connected to the measurements.
Take students outdoors to collect data. Make sure to follow your school's safety guidelines. Additionally, make sure to continually remind students not to look directly at the sun.
While moving from group to group, help students connect their current thinking with the class' initial observations of the young person's long shadow (in the photograph). You might ask these questions:
- How can you change the shape of your shadow?
- What do you think is causing your shadow to appear? When you say "you are blocking the light," where is the light you are blocking coming from?
- In the sun-you (object)-shadow system, where is the sun compared to you and your shadow?
- Would you say the sun is low in the sky? High in the sky? Somewhere between low and high in the sky?
Encourage students to record observations of their shadows (in addition to length) and the location of the sun compared to the direction/location (and length) of their shadow.
Analyzing Shadow Length
After the investigation is completed, ask students to independently record any patterns they observe in their data. Move students into small groups to share these patterns and identify similarities and differences among the patterns shared by their group members. As you move around the room, encourage students to look for patterns in all of their data (qualitative), not just shadow length measurements (quantitative). Consider using one or more of the following prompts:
- What else did you notice changing during the day besides the length of your shadow?
- How might you describe those changes?
- Do you think the changes/patterns are related? How might you complete these sentences?
As ________ changed, ________ changed, too.
As ________ [describe change here*], ________ [describe change here].
*longer/shorter, higher/lower, moved east/moved west, etc.
Bring the students back together. Ask groups to share the patterns they identified; record the groups' shares. Students will likely identify the following patterns (with suggested teacher follow-up responses):
- Our shadows went long—short—long. What time of day were your shadows the shortest? The longest? At about what time did shadows stop getting shorter and begin getting longer?
- Our shadows were long when the sun was low and short when the sun was high. So let me see if I got your thinking right: The higher the sun gets in the sky, the shorter our shadows get.
- Our shadows didn't always point in the same direction. Would you say a little more about that? What was the pattern you observed (or was the shadow direction random)?
- Our shadows were on one side of us and the sun on the other side of us. Would someone repeat in your own words what [student] just said?
Acknowledge with students, "Wow! That is a lot of patterns! And some of the patterns we noticed about shadows have other patterns in them! (For example, the sun moving from low to high to low in the sky during the day.)"
Refer again to the formative assessment probe Me and My Shadow. Remind students, "We planned our investigation to find out which friend best explains how shadow length changes during the day." Read each person's response (Jamal, Morrie, Amy, Fabian, and Penelope), then say, "When I count to three, say out loud the name of the person you most agree with." Count to three. Students will mostly likely agree that Fabian has the best description.
Note: Some students may say "Morrie" has the best description. If so, ask students to return to their small groups and use evidence from their data to make a claim about whose response, Morrie's or Fabian's, best explains how shadow length changes throughout the day. Bring students back together and poll the class again.
Next, ask students, "How could we use our data to predict how long our shadows would be at [insert time halfway between two measurements]?" Ask students to turn to a partner and share their ideas. Then take three sharings from the class. Students will likely say the length will be halfway between two measurements. Next, ask students, "What if I wanted to predict how long our shadows would be at [insert time before first measurement] or [insert time after last measurement]? Could we still use our data to make a prediction?" Accept all ideas.
Create a Graph to Make Predictions About Shadow Length
Say to students, "We represented our shadow-length data in a table. What is another way we might represent our data?" Students will likely say graphs (they may give examples of different types of graphs, like pie charts, bar graphs, and line graphs). Say to students, "Let's try representing our data on a graph and see if that helps us answer our question about using the data we collected to predict shadow lengths before [insert time of first measurement] and after [insert time of last measurement]."
You might consider these different options for constructing graphs with your students:
Paper and pencil. If you don't want to invest a lot of instructional time but want to give students an opportunity to develop their graphing skills, consider providing them a graph template with numbered x- and y-axes.
Google Sheets. With assistance, upper-elementary students can use Google Sheets to create graphs. Google Sheets recognizes "clock" time when times are denoted AM and PM. Consider sharing the shadow length Google Sheets template with students; each student will need to make their own copy before entering their data. Watch Graph Shadow Lengths in Google Sheets to learn how to use this program with students.
Independent of the graphing method you choose to use, the x-axis minimum value should be sunrise and the maximum value, sunset. Ask students why they think this is the case.
Provide students time to graph their data (whichever method you choose).
Project your own graph or a student's graph in a place easily viewable by all students. Ask students, "How might we use our graphs to predict our shadow lengths at [time in between data points on graph]?" Ask students to share their ideas with a partner. Bring the students back together and ask for a volunteer to show on the projected-image how they would use the graph to predict shadow length at the given time. Quickly survey the students whether they agree (thumbs up) or disagree (thumbs down) with the student's idea. Invite one of the students who disagree to show their thinking using the projection. Continue in this manner until students all agree that shadow length can be predicted by (1) locating the time of interest on the x axis, (2) moving their finger vertically until it intercepts the line, then (3) tracing their finger horizontally until it meets the y-axis. This location on the y-axis is the predicted shadow length.
Return to the question that created the need (from students' perspective) to represent shadow length data in a graph. Ask students, "Now that we have represented our data on graphs, can we use our data to predict how long our shadows would be [insert time before first measurement] and [insert time after last measurement]? Give students time to turn and share their thinking with a partner. Bring the class back together. Ask for a student to volunteer to show on the projected-image how they would use the graph to predict shadow length at the given time (choose a time before the first or after the last measurement). The volunteer will most likely use the same method the class previously agreed on.
Ask students, "How might we test our prediction?" Students will suggest going outside at that time and measuring the length of their shadow. Next, ask students, "Would testing our prediction one time make you confident we can use our graphs to accurately predict shadow lengths at different times of the day? Why do you say so?" Students will likely say they would not be confident, although their reasons why may vary. Collaboratively arrive at the number of predictions to make, then the following day, go outside and test their predictions.
Students' excitement will likely grow throughout the day as they gain confidence in their ability to accurately predict the length of their shadow at different times of the day using their graphs.
Say to students, "Remember our question is this: Can we use the data we collected to predict shadow lengths before [insert time of first measurement] and after [insert time of last measurement]? Let’s stay focused on this question and see what we think we have figured out." Facilitate a building understanding discussion with students. Consider using the following prompts:
- What are some of your claims?
- What's your evidence?
- How well does this model (graph) fit the evidence we've gathered so far?
- What can we conclude?
Students should conclude that their data, when represented in graphs, can be used to predict shadow lengths between data points (interpolate) and predict shadow lengths before our first measurement and after our last measurement (extrapolate).
You might ask students, "Do you think our shadow lengths change from season to season? Do you think the pattern changes (our shadows getting shorter until noon, then getting longer again) from season to season?" Accept all answers. You might say, "Let's investigate!" Tell students you will save the class investigation plan and the patterns they identified until the next season.
Reflect on Making Predictions and Solving Problems With Data
Reflect with students on what they've accomplished. They identified patterns in shadow length measurements collected at different times during the day to make predictions about the lengths of shadows between data points (interpolate) and beyond data points (extrapolate). They noticed other patterns as well: (1) The sun rises higher in the sky until solar noon, then begins to descend; and (2) the sun and their shadow are always on "opposite sides" of the student in the sun-student-shadow system. Share with students they have just experienced thinking, acting, and talking like data scientists.
A data scientist is someone who collects data, analyzes it, and makes decisions using large amounts of data, or information.
You might ask students, "Who might need knowledge of these patterns we identified [point to the class list of patterns] to make predictions and/or solve problems?" Give students independent thinking time, then move them into small groups to share their ideas. Bring students back together and ask students to share their idea or an idea shared by a group member. Students' own school, family, or community experience might include the following:
- People planting vegetable gardens want to find a sunny spot to grow their vegetables.
- People planting trees want to provide shade for buildings (want trees to block sunlight so their apartment, house, school, etc. stays cool).
- People planting trees want to make sure that the trees don't block natural light or block sunlight from hitting solar panels.
- People designing baseball fields need to orient baseball diamonds to keep players from looking directly into the sun (at times of the day when games are played).
- People who make movies (video games) need to make sure shadows are in the right place for the time of day the scene is supposed to be taking place.
Say to students, "Let's put our data science knowledge and skills to the test in a different way." Introduce students to the book Florence The Data Scientist and Her Magical Bookmobile. Share with students that this story is about two data scientists: Florence, the owner of the magical bookmobile, and Beatrice, a young girl who wants the book Florence chooses for her to produce a dragon (it is a magical bookmobile, after all). Florence chooses books for children based on their answers to three questions. If Beatrice can identify which answer to give for each of the three questions using the answers other children in the neighborhood gave who received a "dragon" book (data), she, too, will have her very own dragon.
Consider challenging your students to gather and organize data from the story in a way that will enable them to identify the pattern that produces dragons. If students struggle to organize the data, consider giving them a copy of the companion student activity sheet. Did everyone who identified the dragon book pattern organize their data in the same way?
You might invite students to research what data scientists do. Can they find things in common between their own work identifying patterns in shadows and children's answers in Florence The Data Scientist and Her Magical Bookmobile and the work of data scientists?
Acknowledgements

Data science is one of the fastest-growing, in-demand professions today. Domino Data Lab is the Enterprise MLOps platform that more than 20% of the Fortune 100 chooses to unleash data science teams and the IT organizations that support them. Model-driven companies including Allstate, Dell Technologies, and Bayer use Domino to accelerate model velocity for breakthrough research, increase collaboration, and rapidly deliver high-impact models. Domino is backed by Sequoia Capital, Coatue, Bloomberg Beta, Dell Technologies Capital, Highland Capital Partners, and Zetta Venture Partners.