Elementary Middle School High School Informal Education | Daily Do
How is COVID-19 Impacting Families and Communities?
Biology Crosscutting Concepts Disciplinary Core Ideas Is Lesson Plan Life Science Phenomena Science and Engineering Practices Elementary Middle School High School Informal Education Grade 4 Grade 5 Grades 6-8 Grades 9-12
Sensemaking Checklist


In today's task, How is COVID-19 Impacting Families and Communities?, students and their families engage in science and engineering practices and use the thinking tool of cause and effect to explain the phenomenon of the rise, fall, and then rapid rise in new cases of COVID-19. In explaining this phenomenon, students and families also reevaluate the steps they are taking to reduce the risk of becoming infected with the coronavirus.
Today's task is adapted from the Smithsonian Science Education Center's COVID-19! How Can I Protect Myself and Others?, "Task 5: How is COVID-19 impacting families and communities?" and builds on ideas developed in the Why do we all have to stay home? Daily Do.
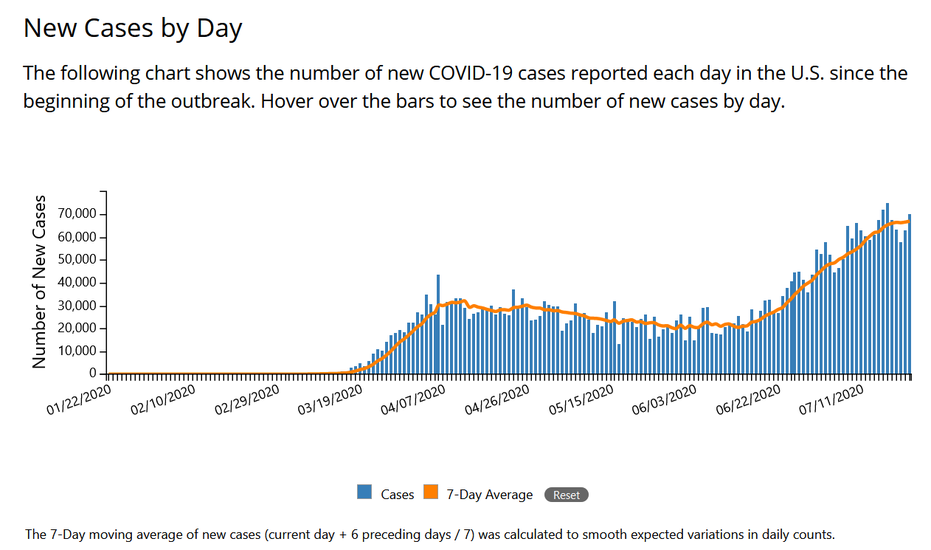
Tell students you have a puzzling phenomenon to share with them. Share the Center for Disease Control and Prevention's New Cases (of COVID-19) By Day graph (published 7.23.20) with students. Ask students, "What do you notice? What do you wonder?" Give students time to independently make and record observations. You might give students sticky notes to record questions that arise; instruct them to keep these questions to themselves for just a little while. As you walk around the room, you might ask questions such as:
- What is the x axis? y axis? What is the scale used on each axis?
- What does each blue bar (line) on the graph represent?
- How does the number of new COVID-19 cases change over time?
- What is the highest number of new cases of COVID-19? When (month) did it occur?
- What is the lowest number of new cases of COVID-19? When (month) did it occur?
- What pattern(s) do you observe in the data presented in this graph?
Help students keep focused on the what (observations), and not the why (explanation of observations).
Assign students to small groups (3-4 students) and ask them to share their observations. (You might consider asking students to use the talking stick protocol described in the Why are plane designs so different? Daily Do.) Task someone in the group to record all observations. Ask each group to also record patterns they observe in the data presented in the New Cases By Day graph. Give the groups additional time to share their questions with each other. Ask them to (1) group like questions together and (2) identify any questions they can now answer based on the group's observations of patterns in the data presented in the graph.
Now, bring the class back together. Ask the groups to each share one pattern they observed in the data, and then one or two unanswered questions related to that pattern. Make a public record of the patterns and questions shared. Student questions may include:
- Why did the number of new cases go up, down and then up again?
- Why did the number of new cases decrease (between May and June)?
- Why did the number of new cases increase so much at the end of June?
- How can some days have such a high number of new cases and the next day the number be so low?
- How many people died/recovered?
- How old were the people who got sick?
- Did more people get sick in some states (cities) than other states (cities)?
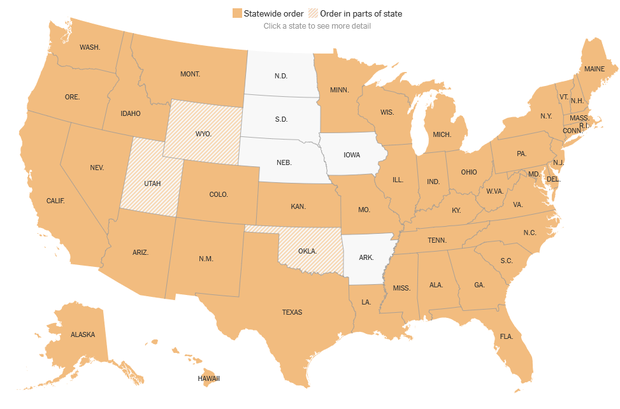
Tell students, "Many of us are wondering why the number of new cases decreased in May and June. I have one more set of data that may help answer this question." Share the See Which States and Cities Have Told Residents to Stay Home map (last updated 4.20.20) with students. Encourage students to independently make observations of the data presented in the map before sharing their observations with their groups. As you walk around the room, listen for students to share ideas about the stay at home orders causing the decrease in new cases of COVID-19. They might talk about their own experience with "shelter-in-place". Bring the class back together.
Ask the group who shared ideas about the stay at home order causing a decrease in the number of new COVID-19 cases to start the class discussion. You might ask some of the following questions to support the discussion:
- Do we all agree with that?
- I’m hearing (Idea X) and (Idea Y). Why (Idea X)? Why (Idea Y)?
- Who feels like their idea is not quite represented here?
- What new questions do we have that might help us move forward?
You might say, "We seem to agree the stay at home orders caused the decrease in new cases of COVID-19 cases. We think it's because people didn't come into contact with each other. But now we're wondering what changed - what caused the number of new cases to increase at the end of June?"
Ask students, "How many people do you think you've been in contact with, directly or indirectly, in the past week? Write that number down and set it aside for now."
Ask students to turn and share with a partner what they are doing (personally) to protect themselves from the coronavirus. Has the way they are protecting themselves today changed from the way they were protecting themselves in April? Next, ask students to share with the class something they are doing or something their partner is doing to protect themselves from the coronavirus. You might quickly poll the class to determine how many of the students are using each of the same method(s). Alternatively, you might use a digital tool like Mentimeter or Poll Everywhere to allow students to anonymously share what they are doing to protect themselves like staying at home, washing their hands, wearing a mask, etc. You might even create two polls so students can compare how they (as a class) protected themselves against the coronavirus in April and how they are protecting themselves today. Give students independent thinking time to observe the results of the poll(s). Consider asking students to work in pairs to identify patterns in the data represented by the polls (for example, word clouds).
If students have completed the Why do we all have to stay home? Daily Do, you might move to the next part of the task. If they have not, consider asking students probing questions about how they think the coronavirus is spread such as, "Why do you wear a mask?", "Why do you wash your hands? How long do you wash them?", and "Why do you stay at home?"
Who Are You Coming Into Contact With?
Say to students, "Let's see if we can figure out how many people we've come into contact with (clarify you don't mean physically touching another person) in the past week." Share the following directions with students:
- Make a list of everyone in your home. Then add anyone you have met or talked to in person in the past week. It does not matter where you met them or how old they are. These are your primary contacts.
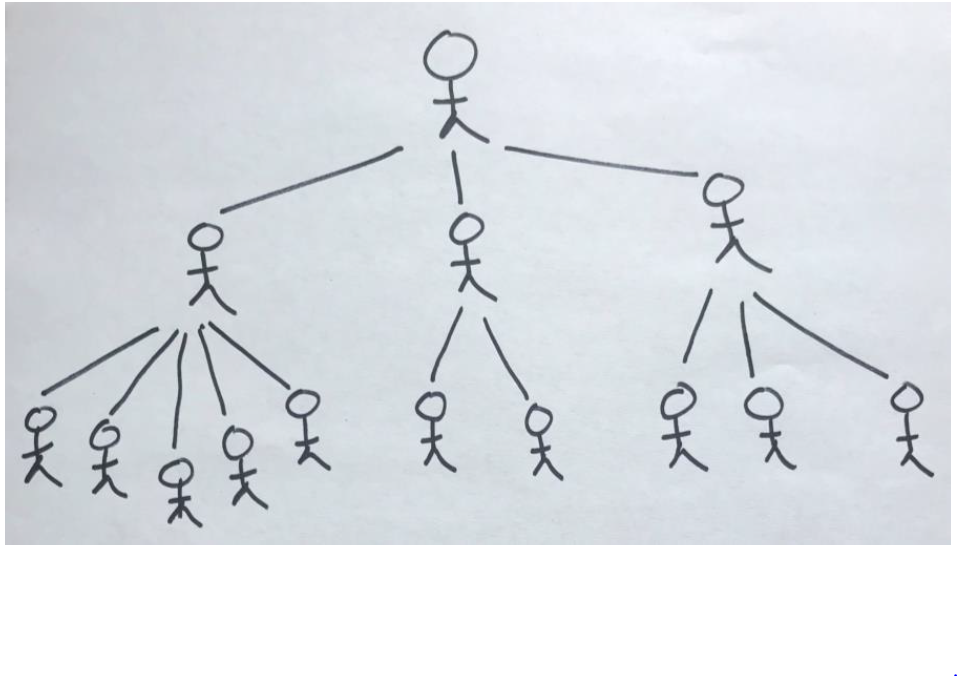
- Create a contact tree (see image upper right). You are the top of the contact tree. Represent your primary contacts in the second row (if you have four primary contacts, draw four people in the row). Consider labeling each of your primary contacts.
- Ask everyone in your home to make list of the people they have been in contact with in the past week. You might ask the additional people you were in contact with in the past week to make a list as well. All of these people are your secondary contacts.
- Create a third row on your contact tree; this row will represent your secondary contacts. Start by choosing one of your primary contacts. For every person your primary contact came in contact with, add one person to the third row. Use lines to show the connection between the primary contact and secondary contacts (see image upper right).
Note: Students need an opportunity to interview their families; split the task over two school days.
Ask students to look for patterns in their own contact data (contact tree). How does the total number of contacts compare with their predicted number? Do all of their primary contacts have the same number of (secondary) contacts? Why might some people have more contacts than others?
Next, assign students to small groups. Ask students to identify similarities and differences between their contact trees. Does everyone in the group have the same number of contacts? What patterns do you notice across the group's contact trees? As you move from group to group, you might ask, "How might you use this information to better protect yourself against the coronavirus?" Listen for groups to share ideas about using the contact tree to make choices to reduce the number of people they come into contact with.
You might also ask students to consider, "Think about the changes you've made in the way you protect yourself against the coronavirus between May 2020 and today. Do you think any of your contacts have made similar changes?"
Bring students back together and ask, "Could someone restate the question we are trying to answer?" Students should recall we are trying to figure out why the number of new cases of COVID‐19 started to rapidly increase at the end of June 2020. Facilitate a building understanding discussion using prompts such as:
• What are some of your claims?
• What's your evidence? (Gently push student to cite relevant evidence from data, both qualitative and quantitative).
• ____ and ____ , you made similar claims. Did you have the same evidence?
• ____ , what do you have to say to ____ about their idea? It sounds pretty different from yours.
• What can we conclude? What might we do next?
Students will likely conclude people came into contact with more people at the end of June 2020 than they did in mid-April 2020.
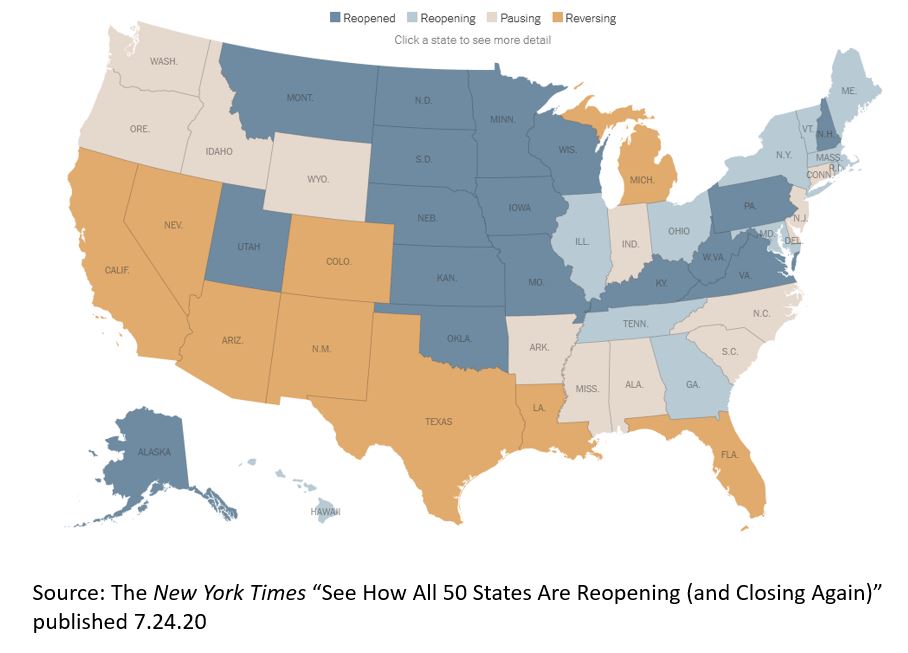
Share the following map with students. Ask them, “Does this new data set support or refute our conclusion?”