Middle School | Daily Do
Why Is Ocean Water Warming Faster in Some Places Than Others?
Climate Change Crosscutting Concepts Disciplinary Core Ideas Is Lesson Plan NGSS Phenomena Science and Engineering Practices Three-Dimensional Learning Middle School Grades 6-8
Sensemaking Checklist


Introduction
In this Daily Do lesson, Why is ocean water warming faster in some areas than others?, students are introduced to the phenomenon of the rapid increase in ocean water temperature in the Gulf of Maine through the film Our Beautiful Planet: A Search Beneath the Sea. Students analyze multiple data sets to try to explain why the Gulf of Maine is warming at a rate three times faster than the average rate of warming for the world's oceans.
View the Why is ocean water warming faster in some places than others? NGSS table to see the elements of the three dimensions targeted in this lesson.
Materials
- Our Beautiful Planet: A Search Beneath the Sea
- Whiteboard, poster paper (and markers), or digital space (to share groups' thinking)
- Sea surface temperature anomalies in the Gulf of Maine* (Figure 1, 2020 Gulf of Maine Warming Update)
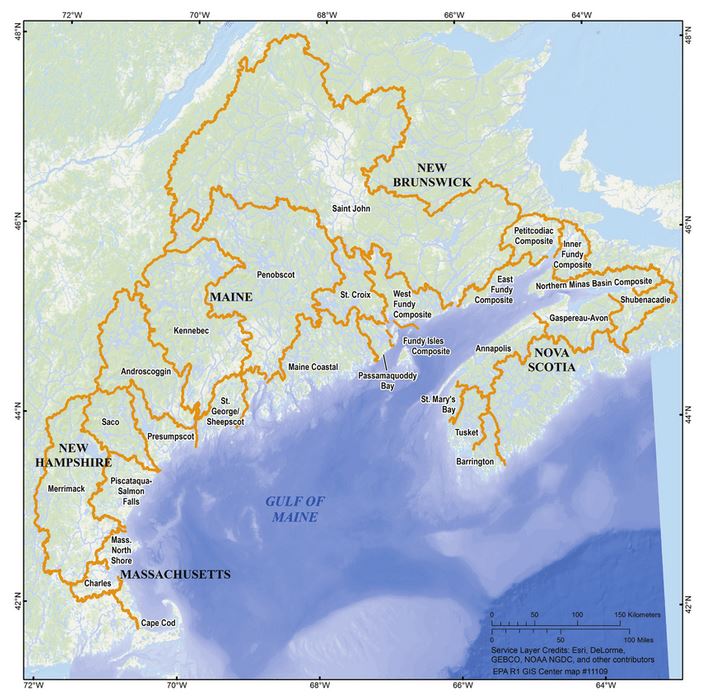
- Map of the Gulf of Maine watershed including the major basins (Figure 2, Watershed Status: State of the Gulf of Maine Report)
- Currents in the Gulf of Maine (Figure 2, The Gulf of Maine in Context)
- Progress Toward Greenhouse Gas Reduction Goals (Maine Department of Environmental Protection: Climate Mitigation)
- Maine statewide annual average [air] temperature, 1895–2018 (page 10, Scientific Assessment of Climate Change and Its Effects in Maine)
- Maine June-July-August Average Temperature Anomaly (Maine Climate Office: Maine 2019 Summer [JJA] Climate Summary), optional
Introducing the Phenomenon
Tell students that something unusual is happening in the Gulf of Maine. Show students on a map where the Gulf of Maine is located, then introduce students to the film Our Beautiful Planet: A Search Beneath the Sea. Play the film from the beginning (0:00) to 1:23.
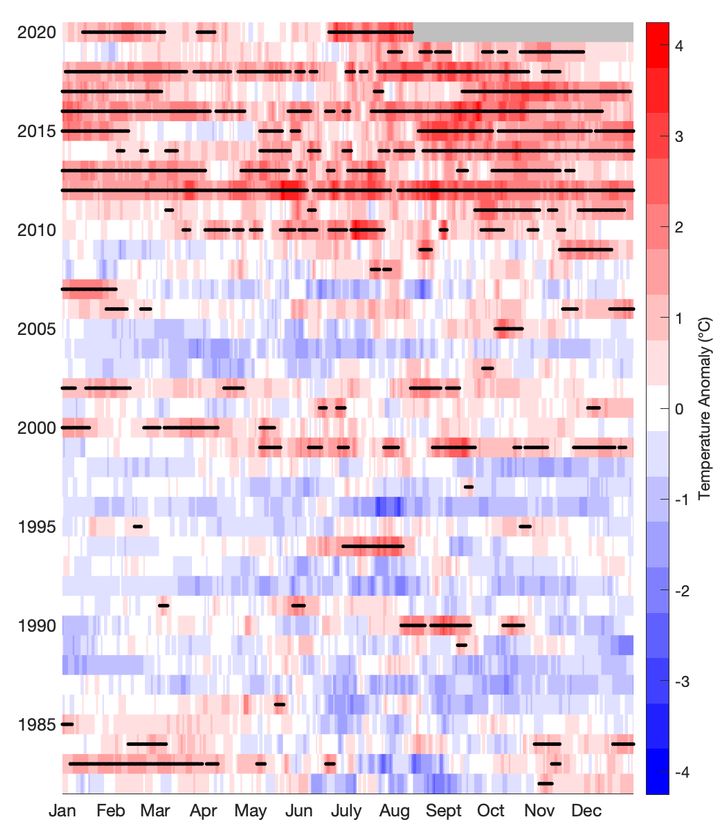
Share with students the sea surface temperature anomaly data for the Gulf of Maine. Students could obtain information about the data set from the 2020 Gulf of Maine Warming Update, or you might provide them with the following information:
- Each row represents one year.
- Red represents days on which sea surface temperature was above average.
- Blue represents days on which sea surface temperature was below average.
- Black dots represent heatwaves.*
*Marine heatwaves are defined as five or more consecutive heatwave days. To qualify as a heatwave day, the temperature for that day must be higher than 90% of the same calendar days during the 30-year baseline period (1982–2011).
- Teacher–While heatwaves (both land and ocean) are defined by specific criteria, you might choose to use the term more generally (e.g., a prolonged period of abnormally high temperatures) with students.
- Students–Independently observe the data and record patterns they identify.
Next, assign students to small groups and provide each group with a whiteboard, large sheet of paper, or digital space to work with. Ask students to share the patterns they identified, or other information extracted from the data, with their group members. Instruct groups to record these patterns and/or information and be prepared to share their noticings with the class. Group noticings may include these:
- The number of "red" days increase a lot after 2010.
- There were mostly "blue and white" days before 2009.
- Some years, like 1992 and 1996, have very few "red" days.
- 2012 had a heatwave that lasted almost the entire year.
- After 2010, heatwaves always occur, but before 2010, some years didn't have any.
Ask students to share questions they have about the sea surface temperature anomaly data and the information provided in the film clip with their group.
- S–Groups rank their questions from most common to least common.
Have each group share their top one or two common questions with the class. Common questions will likely include these:
- Why is the sea surface temperature rising so fast?
- Did something happen in 2010 to make the water warmer all the time?
- Could the rise in sea surface temperature affect the fish?
- Why hasn't the water temperature decreased like it has in the past (for example, in 1992, 1996, and 2004)?
- How does a big body of water/the ocean get warmer in just one spot?
- Is the water polluted? Is pollution in the water making it warmer?
- Is the ocean water warmer in this spot because it is close to land?
Record students' questions in a shared space where they can be easily seen by the whole class. Acknowledge that students have many questions about what is happening in the Gulf of Maine. Point out that the answers to these questions might help answer the question presented in the film: Why is the Gulf of Maine warming at such an alarming, accelerating rate? Write this question across the top of the class list of questions.
Building Initial Ideas
Ask students to turn to a partner and brainstorm (for about two minutes) possible causes for the rapid rise in sea surface temperature in the Gulf of Maine. Bring the students back together and ask them to share their idea or a partner's idea about why the warming trend might be occurring. Students may share the following ideas:
- Pollution is causing global warming. (Greenhouse gas emissions are causing climate change.)
- The ocean water is getting warmer from the warmer air temperature.
- An underwater volcano is making the water warmer.
- Someone is dumping chemicals into the Gulf of Maine, and that is making the water warmer.
- T–As students share their ideas, use talk moves to get them to think more deeply about their ideas, such as these:
- Can you say more about why you think we need to know more about the air temperature?
- Does anyone else have anything to add to the idea of knowing more about air temperature?
- What data do you think we might need to figure out if pollution is causing the sea surface temperatures to rise in the Gulf of Maine?
Next, tell students you have some data to share that might help them figure out what is happening in the Gulf of Maine. Ask students to return to their small groups, and provide each group with a different data set to analyze. Encourage them to write down any questions they have about the data.
-
Map of the Gulf of Maine watershed including the major basins (Figure 2, Watershed Status: State of the Gulf of Maine Report)
-
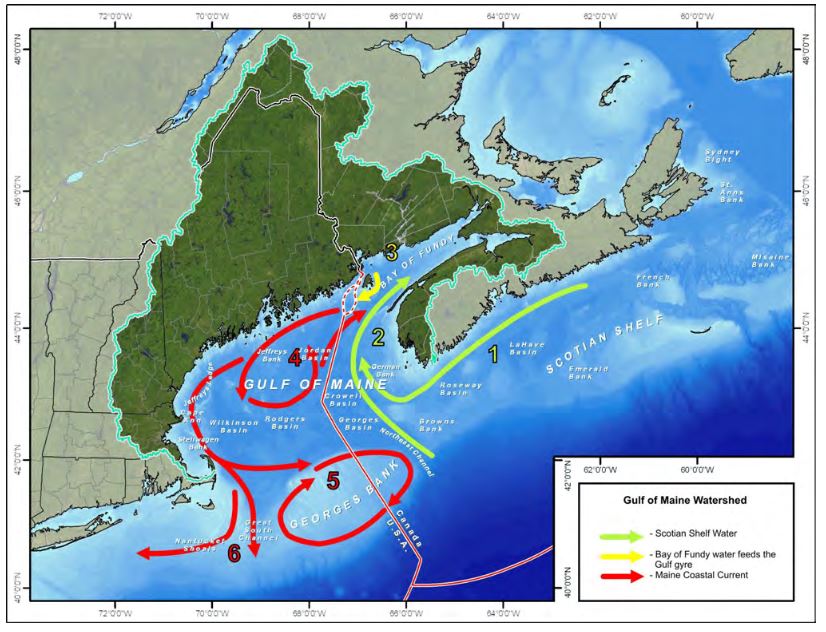
Currents in the Gulf of Maine (Figure 2, The Gulf of Maine in Context)
-
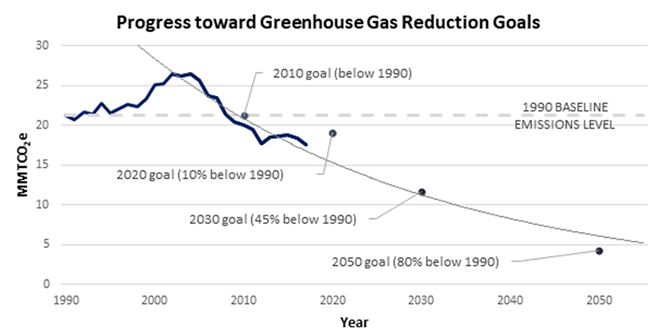
Progress Toward Greenhouse Gas Reduction Goals (Maine Department of Environmental Protection: Climate Mitigation)
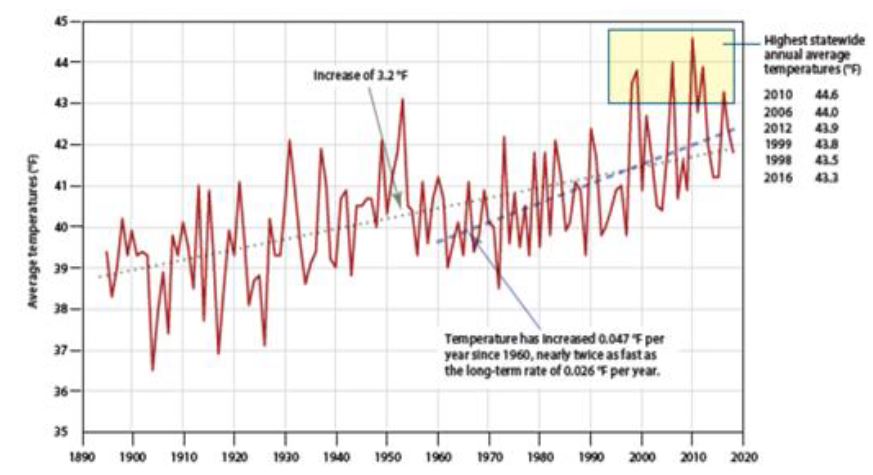
- Maine statewide annual average [air] temperature, 1895–2018 (page 10, Scientific Assessment of Climate Change and Its Effects in Maine)
Have groups share patterns they identified and/or information they obtained from their assigned data set with the rest of the class.
Common noticings may include these:
- The Gulf of Maine has a large watershed that could be dumping warm water into the ocean.
- Cold water currents come in from the north, but most of the currents entering the Gulf of Maine seem to be warm water.
- Warm water currents seem to get stuck in a loop in two places. We think that means the warm water just stays there and doesn't move out.
- Greenhouse gases are decreasing. We thought these would be going up, since we heard that greenhouse gases make the air temperatures rise.
- Air temperature in Maine is getting warmer, and we think that could make the water warmer. (But we're not sure why the air temperature is increasing.)
- T–This activity could be completed as a jigsaw: (1) return students to small groups; (2) assign each group member a different data set; (3) move students into new groups based on their assigned data set; (4) provide time for students to work collaboratively with their new group members to analyze their assigned data set; and (5) send students back to their original group to share information gleaned from their assigned data sets.
Taking Stock
After all groups have presented their findings to the class, ask, "Do you think we can use these data sets to help us explain why the Gulf of Maine is warming at such an alarming, accelerating rate?"
Give groups time to develop an initial (consensus) explanation about why the sea surface temperature is rapidly rising in the Gulf of Maine.
- S–Students collaborate with group members to develop an initial consensus explanation using words, pictures, and/or symbols to help communicate their thinking.
- T–As you move from group to group, ask students, "Do you think the data support one cause for the warming of the Gulf of Maine, or do you think the warming could have many different causes? What's your evidence?"
Ask students if they remember from the film clip how much faster the Gulf of Maine is warming compared to other parts of the ocean. (Three times faster) Tell students what scientists don't know is why the Gulf of Maine is warming at such a rapid rate. Ask students, "We've looked at many different kinds of data for the Gulf of Maine. What do you think?"
- T–Consider having each group briefly present their explanation to the class. Work with students to create a class record of similarities and differences among groups' initial explanations. You might ask students to identify what they still need to know to develop a class consensus explanation.
Show students the rest of the film Our Beautiful Planet: A Search Beneath the Sea.
- S–Note (record) the types of data the scientist and his students are using to explain why the Gulf of Maine is warming at such an alarming, accelerating rate. Compare the explanation shared by the scientist to the initial consensus explanations shared by the groups in the class.
Putting the Pieces Together
Have students revisit their initial explanations. How did their explanations compare to what scientists currently understand about why the Gulf of Maine is warming so rapidly?
Students should conclude that several factors are working together to warm the Gulf of Maine at a rate three times faster than the average rate of warming of the world's oceans. Air temperature, ocean currents, and the rivers that flow into the Gulf of Maine all contribute to warmer waters. Carbon emissions also contribute to a rise in ocean temperature, even though data clearly show the carbon emissions in Maine are decreasing.
Next Steps
Remind students that the study of Earth's global ocean is ongoing. Explaining why the Gulf of Maine is warming rapidly leads to new questions that must be investigated.
If students raise questions about the effect of rising ocean temperatures on life in the ocean and on land, consider navigating to the Daily Do lessons Why Does the Green Crab Love Climate Change? and Why Is Something That’s Happening Out in the Ocean Such a Danger to Us on the Land?
Meet Charles Tilburg, Oceanographer
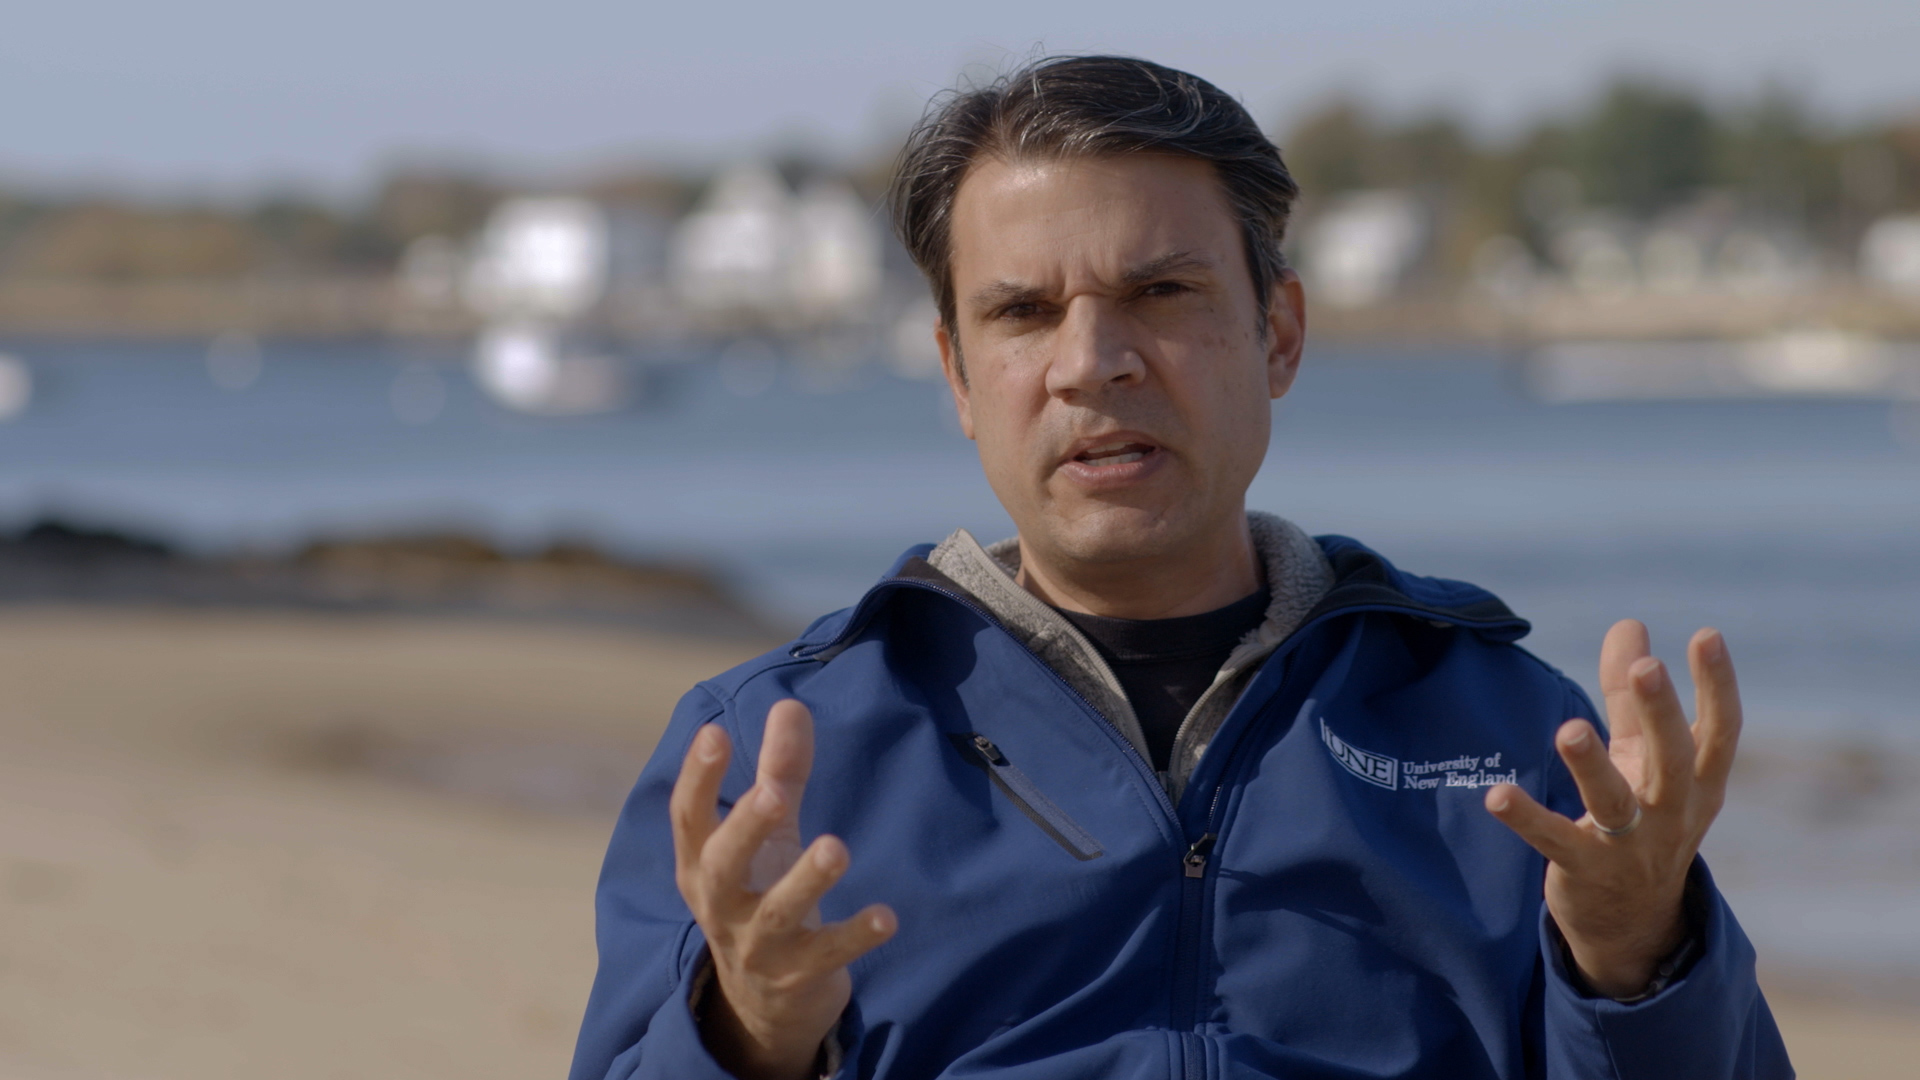
Dr. Charles Tilburg is Director of the School of Marine and Environmental Programs, Director of the Arthur P. Girard Marine Science Center, and a Professor of Marine Sciences at the University of New England. He earned a Bachelor of Science in Aerospace Engineering and a Master of Science in Environmental Engineering from the University of Texas and a PhD in Oceanography from Florida State University. He has 20 years of research and teaching experience in physical oceanography, numerical modeling, and biophysical coupling of marine systems. He has authored more than 40 peer-reviewed publications and received more than $3 million in research funding. Tilburg previously taught in the marine science departments of the University of Georgia and the University of New England.
About the Our Beautiful Planet Film Series
This lesson is based on information provided in the film Our Beautiful Planet: A Search Beneath the Sea. Our Beautiful Planet is a fascinating new series of films highlighting the work that climate scientists around the country are doing to solve some of the world’s most pressing issues. These dedicated researchers are seeking to better understand the many different ways we are being impacted by our changing climate and determine the ways we can most effectively respond. Using cutting-edge technology and innovative problem-solving strategies, they sometimes find their answers in surprising and unexpected places. Our series, by enabling viewers to experience firsthand some of the most important field work being done today, takes science out of the classroom and puts it right into the world. These compelling stories will not only teach our viewers crucial scientific principles, but will also inspire them to use science to examine the issues that confront them in their own communities. Through these films, we hope scientists and citizens alike can come together to safeguard our environment and to protect our beautiful planet. The films are produced by Kikim Media. Support is provided by Kennebunkport Climate Initiative.