
Ed News: NGSS Science Promotes Phenomena-Based Learning
By Cindy Workosky
Posted on 2019-02-22

This week in education news: California gears up for tests on their new science standards; an in-depth look at how Next Generation Science Standards promote phenomena based learning; OpenSciEd’s work to create curriculum aligned with the NGSS; and the movie “Black Panther” broke additional ground in a way most people may not realize–in the comics, the character is actually a scientist and engineer.
NGSS Science Promotes Phenomena-Based Learning
District Administration magazine delves into the emerging science concept called phenomena-based learning that taps into students’ natural desire to make sense of their world. Read more about how this approach encourages students to observe natural phenomena and then investigate why it occurs. Read the article featured in District Administration Magazine.
California Students May Not Be Ready For New Science Test
Next month California students will start to be tested on the state’s new science standards for the first time, but with little instruction in the subject in elementary school and few aligned textbooks they aren’t likely to be ready. Read why in this article from Edsource.
Long Game: Inside the Carnegie Corporation’s Quest to Improve Science Education
The Carnegie Corporation has put $4 million into OpenSciEd, the new nonprofit tasked with creating curriculum to align with the Next Generation Science Standards (NGSS). Read more about this effort in Inside Philanthropy.
Black Panther and Its Science Role Models Inspire More Than Just Movie Awards
“Black Panther” also broke additional ground in a way most people may not realize: In the comics, the character is actually a scientist and engineer. Read all about it in The Conversation.
Studies About STEM Achievement and New Parents in STEM
A study published in Diverse Issues in Higher Education finds that professors’ beliefs about intelligence play a measurable role in the success of STEM students, especially underrepresented minorities. And a new report from the National Academies of Science finds substantial attrition of new parents, nearly one-half of new mothers and nearly one-quarter of new fathers, leave full-time STEM employment after having children.
During a border wall rally earlier this month, Donald Trump Jr. drew cheers when he urged young conservatives to “bring it to your schools” because “you don’t have to be indoctrinated by these loser teachers that are trying to sell you on socialism from birth.” Read the article featured in The Washington Post.
Stay tuned for next week’s top education news stories.
The Communication, Legislative & Public Affairs (CLPA) team strives to keep NSTA members, teachers, science education leaders, and the general public informed about NSTA programs, products, and services and key science education issues and legislation. In the association’s role as the national voice for science education, its CLPA team actively promotes NSTA’s positions on science education issues and communicates key NSTA messages to essential audiences.
The mission of NSTA is to promote excellence and innovation in science teaching and learning for all.
Follow NSTA
 |
 |
 |
 |
 |
Pasco's Wireless Light Sensor Revisited using SPARKvue…
By Edwin P. Christmann
Posted on 2019-02-22
Introduction:
The PASCO Wireless light sensor is a wireless device that measures ambient and directional light. Moreover, it has the capacity to stream data to devices via a Bluetooth connection, e.g., laptops, iPhones, or Android phones. There is a picture of the sensor that can be seen in Image 1. The light sensor has an ambient sensor on the back of the device to measure light’s illuminance, UVA, UVB, and the UV Index. Subsequently, light levels can be measured with a spot aperture that can detect color. For a more in-depth description and to order the product, feel free to visit the PASCO website at: https://www.pasco.com/prodCatalog/PS/PS-3213_wireless-light-sensor/index.cfm.
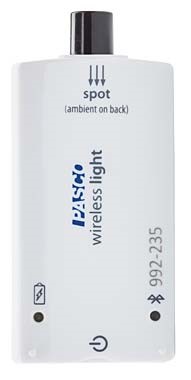
Image 1: Displays a picture of the sensor. The small sensor is approximately the size of the palm of an adult’s hand.
In order to begin data collection, student will need to connect their sensor to a device (e.g., cellphone) via a Bluetooth connection. To make this connection, they will need to use the PASCO data collection software. There are two choices of software to make this connection, i.e. SPARKvue or PASCO Capstone. We selected SPARKvue for our test of this product, which was very easy to download from the Apple “App Store.” Once that’s done and users are ready to connect their device to the light sensor, they must click on the Bluetooth icon within the PASCO data collection software. Next, they will select the device from the “Wireless Devices” list, matching the device ID number that’s found on the sensor. The Bluetooth light will blink green when their device is connected to the sensor. Once you get the greenlight, you are ready to start collecting data!
https://www.bing.com/videos/search?q=pasco+wireless+sensor&&view=detail&mid=561461DF848D60D55B53561461DF848D60D55B53&&FORM=VRDGAR
Video 2: PASCO Wireless Sensors: Getting Started with SPARKvue
To begin data collection, the first step is to start a new experiment. When starting a new experiment, users can choose the dependent variables (or in other words – what they are measuring). As an example, if using the ambient light sensor, measurements of UVA, UVB, UV, illuminance, solar irradiance, or solar PAR can be measured and reported. Moreover, if using the spot light sensor, it’s possible to measure white, red, green, and blue light-levels. Users have the option to select multiple measurements at a time if they wish (see Image 2). In addition, students are able to select how they would like their data displayed e.g., a graph, a table and a graph, or in digital form (see Image 3). To collect the light data, students need to hold their sensor towards the source of light being testing. Next, to initiate data collection, they need to push the start button (i.e., the green button located at the bottom portion of the screen). For users finish collecting data, all that’s necessary is to press the red stop button to stop data collection. Screenshots of the data in digital and graph format also appear below in Images 4.
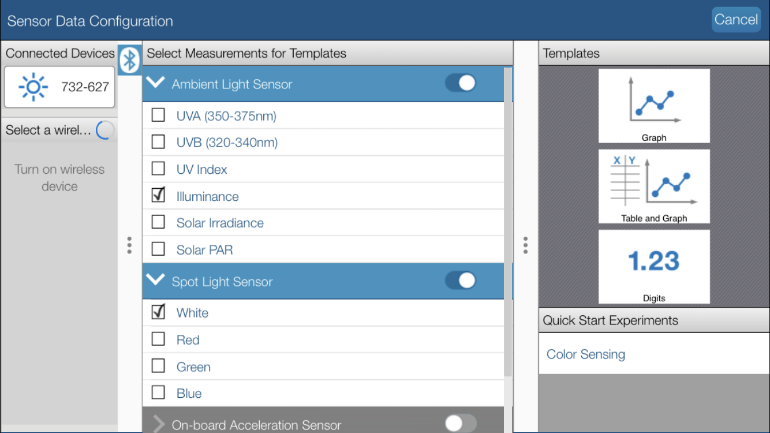
Image 2: A screenshot of the options users see on the screen when setting up their new experiment.
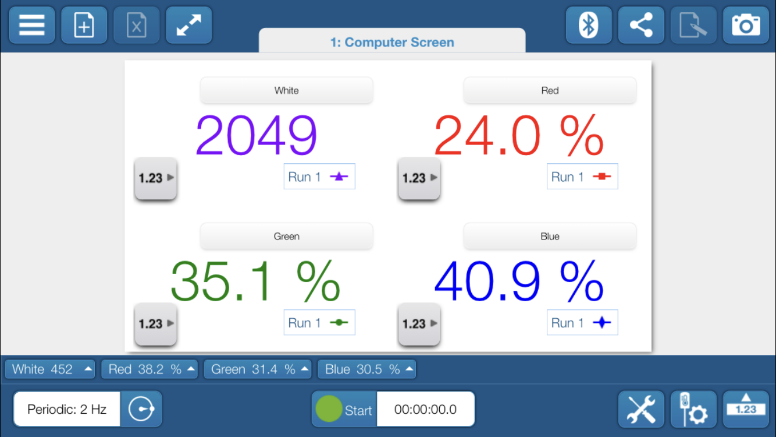
Image 3: A screenshot of how data appears if users choose for their data to be displayed in digit format. The data shows the amount of white, red, green, and blue light emitted from a computer screen.
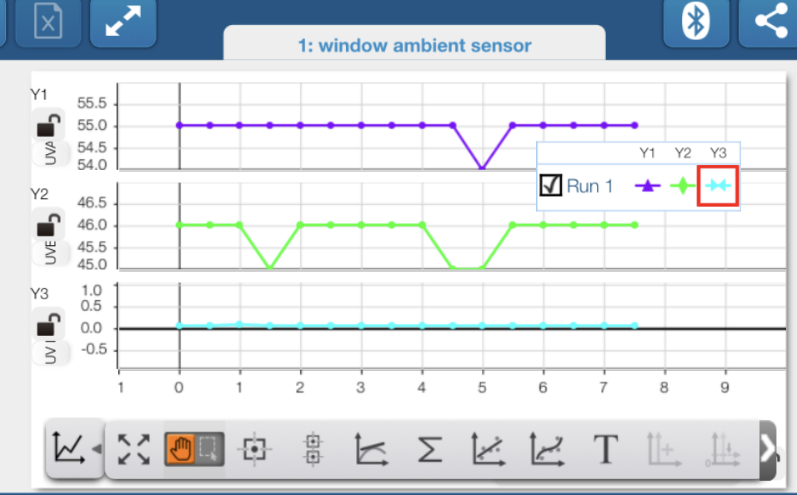
Image 4: A screenshot of what data looks like if users opt to have their data displayed in graph form. The data shows the amount of UVA, UVB, and UV found in the natural light coming through a window.
Classroom Applications:
The PASCO Wireless light sensor has a multitude of possible uses in a variety of subjects for students of various ages. There are a variety of ideas for classroom uses of the sensor provided for free on the PASCO website under the “Training and Resources” tab. After clicking this tab, users go to https://www.pasco.com/resources/videos/index.cfm for additional information. We found that PASCO’s Wireless Light Sensor is an excellent scientific instrument that is reasonably priced and easy to use! Moreover, PASCO’s SPARKvue is SPARKvue is a an excellent data collection tool with many applications for uses in STEM learning. If you are studying light and are looking for an easy and user-friendly way to collect data, consider using Pasco’s Wireless Light Sensor with SPARKvue.
Specifications:
Sensing Element
– Dual 5 channel radial photodiodes
Spectral Response
– Approximately 300 nm to 1100nm
– UVA (350-375 nm)
– UVB (320-340 nm)
Measurement Options
– Light intensity, RGB, UVA, UVB, and UV index
Resolution
– +/- 0.01 lx (spot aperture)
– +/- 2 lx (ambient aperture)
Sample Rate
– Ambient- Default: 1 Hz
– Ambient- Maximum: 2 Hz
– Spot- Default: 5 Hz
– Spot- Maximum: 20 Hz
Logging
– Yes
Battery
– Coin cell (expected battery life of over one year)
Connectivity
– Bluetooth Smart
Maximum Wireless Range
– 30 meters (unobstructed)
Cost:
$59 per device
Edwin P. Christmann is a professor and chairman of the secondary education department and graduate coordinator of the mathematics and science teaching program at Slippery Rock University in Slippery Rock, Pennsylvania. Emily Ferraro is a graduate student in the mathematics and science teaching program at Slippery Rock University in Slippery Rock, Pennsylvania.
Introduction:
Supporting Science through Interdisciplinary Instruction
By Korei Martin
Posted on 2019-02-19
The Next Generation Science Standards (NGSS) have totally transformed my students’ learning experiences in STEM. However, like most teachers, my biggest challenge has been finding the  additional time that students need to observe, question, investigate, and interpret results. Thinking and learning takes time. Interdisciplinary instruction within my elementary classroom provides authentic, relevant learning experiences that support the NGSS and my state’s learning standards for Math, English Language Arts, Social Studies, and 21st Century Skills.
During my Life Science Unit this year, my fourth graders were learning about the internal and external structures that support the growth and survival of animals. Students also learned about how an animal’s body structures were adaptations for the ecosystem(s) they live in. In Reading, my kids read about Christian the Lion and how he was affected by being kept as a pet. For those of you not familiar with the story, he was rescued and rehabilitated by two people who learned about his confinement. The text can be presented through Guided Reading, Shared Reading, or independently (depending on the needs of individual students). Students connected information from the text and discussed the needs of lions and other wild animals. From there, we moved into an Opinion writing piece about whether or not wild animals should be kept as exotic pets. My students had very strong opinions about this question. They worked with partners to research the pros and cons of keeping exotic pets. Then, they wrote their opinions and engaged in a spirited debate. In Math, students can create bar graphs to represent different exotic animals being kept as pets and then use that data to discuss the impact within ecosystems when those animals are taken out. The Social Studies connection includes research and discussion on the economic impact within specific countries from businesses that buy and sell exotic animals. As students  discover the range of reasons for the existence of this market, students naturally start discussing laws that either encourage or discourage this practice.
In another science lesson (Earth Science), students were learning about the effects of weathering, erosion, and deposition on the surface of the earth. Students read about the three processes (in small groups and independently), as well as natural disasters including hurricanes and earthquakes. The reading standards addressed were: identifying important information and note taking as well as informational text features and structures. The Social Studies connection including a focus on map reading skills. Students identified and researched natural disasters that occur in the United States. They placed events on a U.S. map and identified any patterns they noticed between the Earth’s surface and the location of particular events. As a culminating activity, students had to design and build an earthquake or hurricane resistant structure. They tested it, recorded the results, and redesigned when appropriate. The Math connection occurred during the design process as well as in the reflection process by identifying geometric shapes that provided the best stability.

Interdisciplinary instruction has years of research that support it. But, more importantly perhaps, is the observation that when I watch my students learn in this kind of environment they are able to transfer and apply their understandings from one subject to another. They quickly identify and discuss the connections with each other and learn to engage in argument based on evidence acquired across all subject areas. My advice is to take it slow. My lessons have evolved over the years as I’ve observed my students learn and reflected on it. As you get more comfortable making those connections, you’ll be able to add more to the instructional design. Have fun with it!
Author: Debbie Ericksen, 4th Grade Teacher, Adamsville Primary School, Bridgewater-Raritan RSD
Email: debe506@att.net OR dericksen@brrsd.k12.nj.us 
Twitter: @DebbieEricksen5
Social Media Tags: PAEMST, NCTM, NSF, @BRRSDAdamsville
The Next Generation Science Standards (NGSS) have totally transformed my students’ learning experiences in STEM. However, like most teachers, my biggest challenge has been finding the additional time that students need to observe, question, investigate, and interpret results. Thinking and learning takes time.
Gain Valuable STEM Teaching Strategies and Resources at the Elementary STEM Showcase
By Carole Hayward
Posted on 2019-02-19

The 8th Annual STEM Forum & Expo, hosted by NSTA this coming July in San Francisco, offers valuable resources for educators and organizations seeking to learn more about STEM education from preK through university. You will walk away from the STEM Forum & Expo with ideas you can use immediately in the classroom.
And for elementary educators, a lot of those ideas will come from the Elementary STEM Showcase, a featured program during the STEM Forum that provides a variety of preK–5 STEM teaching strategies and resources. The Showcase takes place Thursday morning, July 25, and is the only elementary-level session offered during the time slot (so that no one has to miss out).
Effectively integrating STEM into elementary school lessons is an important component to helping students become innovative thinkers and problem solvers. During the Showcase, participants will engage in hands-on activities and interact with presenters about STEM investigations and ways to incorporate STEM into their already busy classrooms. Featured materials during the Showcase include NSTA Press® books, award-winning books from the Best STEM Books list, and strategies from the NSTA preK–5 journal, Science & Children.
The Early Bird Registration deadline for the 8th Annual STEM Forum & Expo, hosted by NSTA is May 13; register early to save. Visit the conference website for up-to-date information on the STEM Forum and Expo. We hope to see you this July in San Francisco!
Follow NSTA
|
|
|
|
|
- Read more about Gain Valuable STEM Teaching Strategies and Resources at the Elementary STEM Showcase
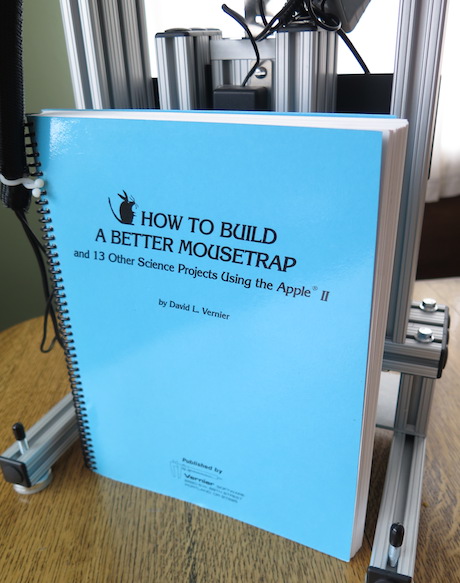
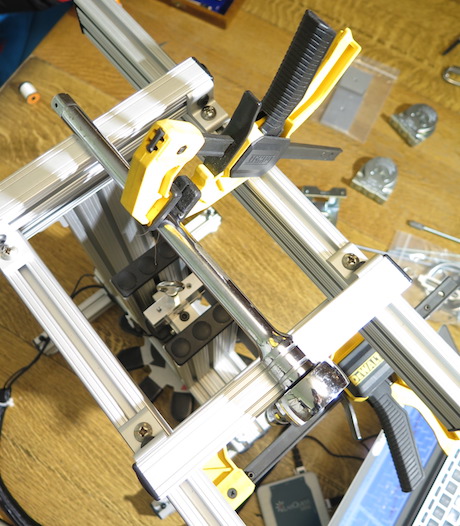
Vernier Structures and Materials Tester: An Engineering Marvel To Test Student's Engineering Marvels
By Martin Horejsi
Posted on 2019-02-18
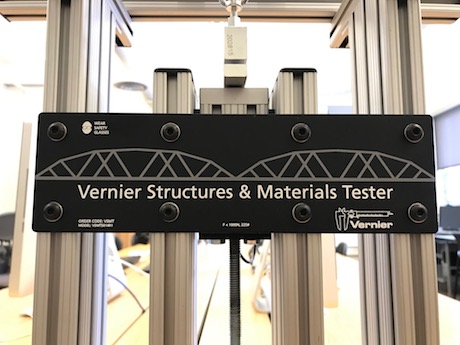
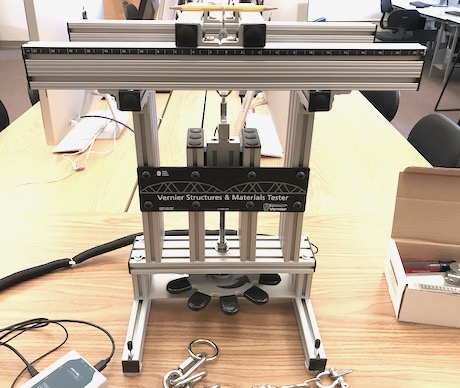
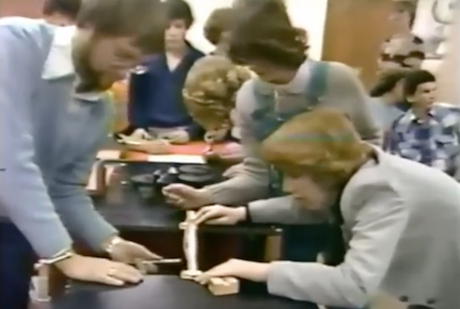

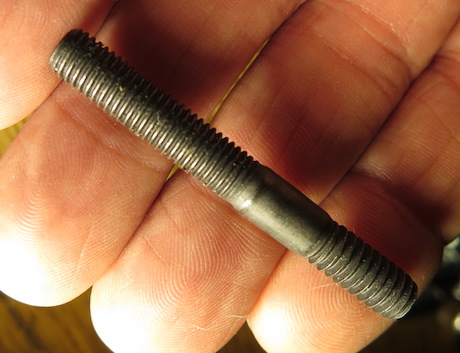
The VSMT Displacement Sensor uses a quadrature optical (incremental type) encoder to measure the amount and direction of rotation. The encoder, which is attached to the threaded rod that causes the force sensor to move up or down, consists of a coded pattern of opaque and transparent sectors. The quadrature encoder produces two pulse output patterns 90o apart in phase. The movement of the threaded rod is determined by counting the pulses. The phase relationship between the output signals determines the direction of rotation. The encoder counts a pulse every 22.50 or 16 pulses per revolution of the wheel.
The VSMT uses this count to determine the revolutions of the wheel (or fractions, thereof). The VSMT Displacement Sensor and the VSMT Force Sensor are linked by a threaded rod with a pitch of 16 (16 threads per inch). For each counter clockwise revolution the Force Sensor moves down 1/16 of an inch.
Ahh, inches. Inches are so hard to let go of. I know that. I grew up in inches. My education was in inches. I used inches in science, in sport, in poetry. But we really have to let inches go. The rest of the world revolves quite well with metrics. Yes, I get that the centimeter is an ugly unit for poetry. its clumsy in sport, and impersonal in song. Maybe we could move the fractional measurement system to another field where it is used with historic appreciation and activity-specific vernacular?. But again, I digress. Let’s breaks some stuff, shall we?
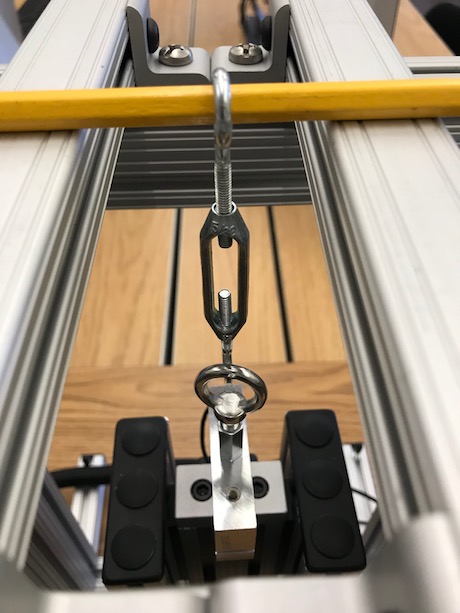
Before attacking structures that have some serious student engineering and time invested, learning the VSMT system and its predictable operation requires some practice. Pencils anyone?
As every teacher knows, the quality of the classic yellow pencil is only skin deep. Some pencils are wood, some are not. Some are stronger than others. Some bend, some melt, and some are a pleasure to write with. For this inspection, a handful of various brands of yellow pencils were in fact injured in the name of science. After standardizing the conditions of the test, namely the width of the support platform and the hardware connecting the pencil to to the sensors. With that in place, it was pencil breaking time.
Here is the data from a lot of broken pencils.
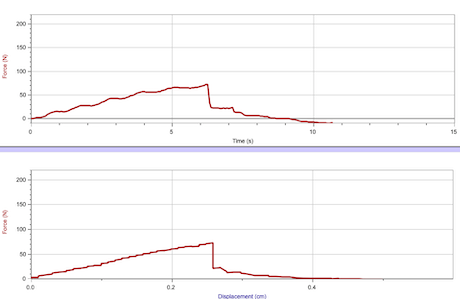
No-name pencil given away as promotion.
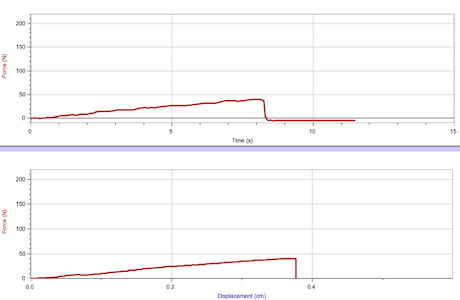
Sanford EarthWrite Pencil
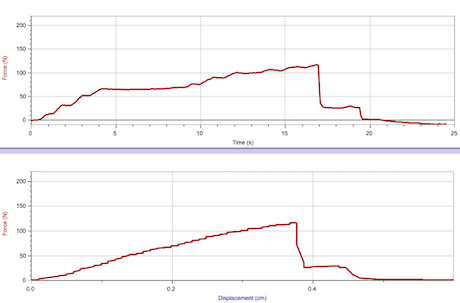
Dixon #2 Pencil
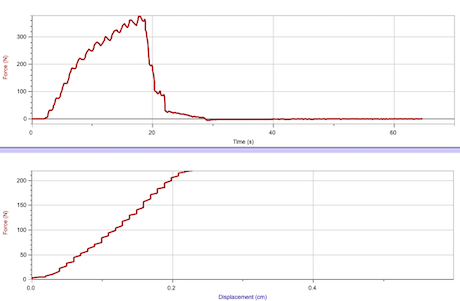
Craftsman carpentry pencil (oversized)
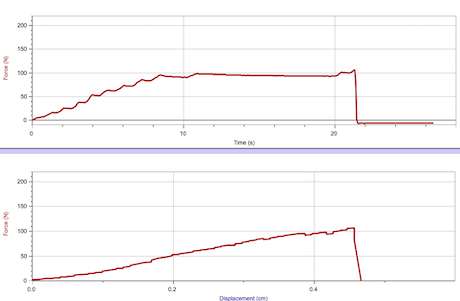
Charles Leonard #2 pencil
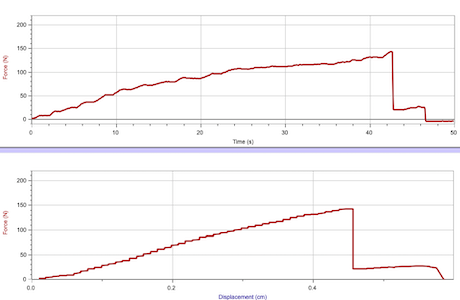
Bazic #2 pencil
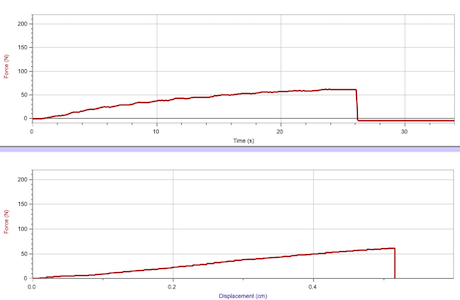
Americas Gold #2 pencil
Americas Gold pencil-Chewed on weakening it
A River Runs Through It
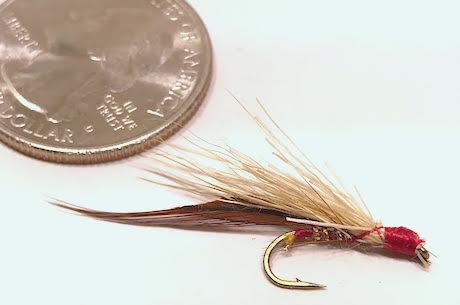
The first ever “Hellgate Knight” dry fly. Tied by a junior at Hellgate High School. Yes, that is the actual name of the school and the school’s colors are red and gold.
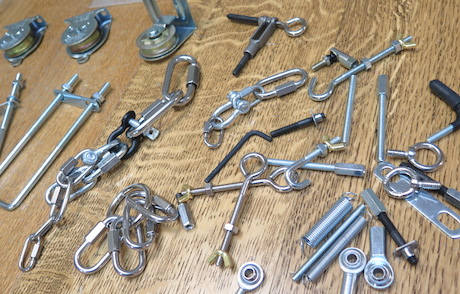
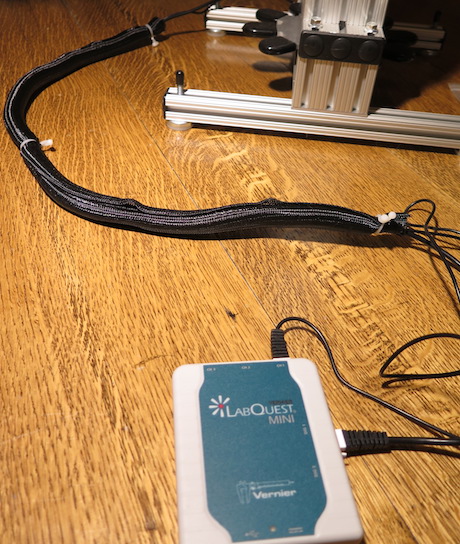
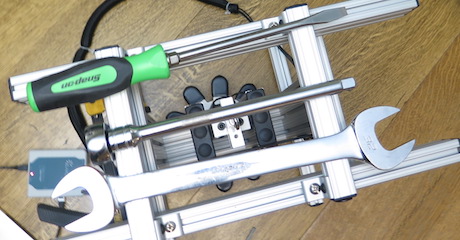
Another tangential use of the Vernier Structures & Materials Tester is of hometown interest given that the River really does run through it. Fly fishing is popular activity, and strength the knots and flies is a large part of understanding the interaction of the art of fishing and what is being fished for, So testing the knots, line and flies would be both fun and topical. Two high school students chose some popular knots and weights of line to test. But the tricky part was building the harness that would allow proper testing given the variables of holding onto filament line. A bend over a small or sharp corner might introduce a weakness, so a mechanism needed to be assembled to allow the line a clean route from anchor to tester. Another issue was that this was no mere bridge failing through minor deformation, this test was to complete failure and separation. That meant that the anchor apparatus must also be controlled since it would fly free once the line broke. Hardly rocket science, but still some good experimental protocols needed to be defined.
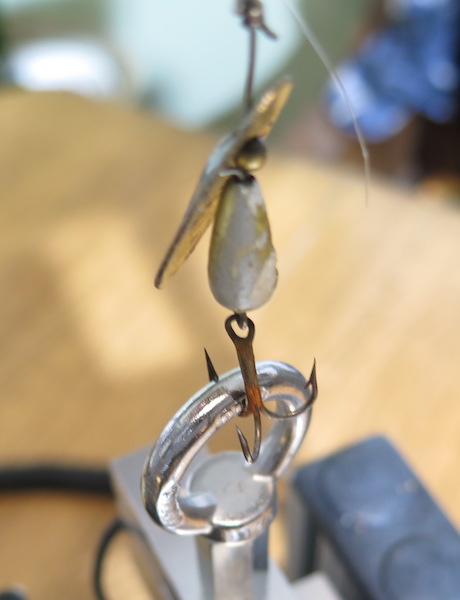
As a proof of concept, a few testing paths were developed and several knots tested. First the Vernier Structures & Materials Tester tackle had to be configured to pull apart fishing tackle. For this initial inspection into line and knot strength, a smooth but strong cylinder was needed on which to wrap fishing line to move the weakness downstream to the lure or fly. If the line was simply tied onto another small piece of hardware, the weakness could just as easily appear at the apparatus attachment as it could the actual point of interest.
Several solutions for the non-knotting connection were explored including a large screwdriver shaft, a large smoother wrench shaft, and finally the one decided upon, a 1/2 inch ratchet extension complete with ratchet for stability. Anchored with some woodworking trigger clamps, the ratchet and extension complements the stainless steel ring attached to the force sensor. Between the two are some fishing line and exactly one knot. The smooth curve of the ratchet extension provides little additional stress on the line while also securing it completely for this test through a series of loops around the chromed steel shaft. A second rubber-jawed trigger clamp was used to hold the line in place on the ratchet extension. I won’t claim to have come up with this idea on my own. Rather it is a smaller version of a design I once read about in an engineering article that explained how climbing ropes were tested.
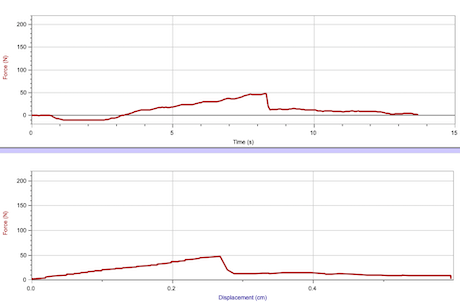
Several variations of knots were tested, with all of them connected to a conventional and popular fishing lure. And that lure in turn simply hooked as defined to the installed stainless steel ring. The results in the best case had the line breaking at about 20N or through a few conversions, a loss of about 20% of the advertised strength of the line from the factory. Again, from what I know about climbing rope testing, a loss of 1/5th of the overall system strength due to a knot is actually pretty good. Some knots can cut the system strength in half, which is actually much better than those knots that come undone. There are some fishing knots that are reported to retain 95% or more of the original line strength with a few sources claiming 100%. But we didn’t come close to that.
I guess it’s a matter of perspective. And for knot perspective, the reef or 4000 year old square knot or reef knot is popular but week and some have suggested that the square knot has unintentionally killed more people than any other knot. Of course the knot that has killed the most people intentionally is the hangman knot. For our cases, we used several different traditional fishing knots including the most common, the Improved Clinch Knot.
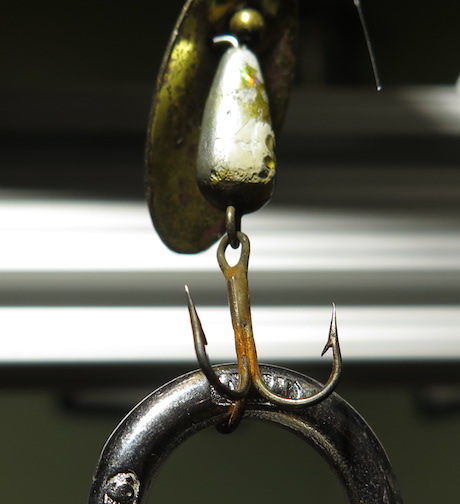
The data collected from using the Vernier Structures & Materials Tester showed that the knots tested were some of the best knots for fishing in terms of strength. One knot slipped, but at the maximum Newton number at breakage did show that any fish worth its salt will push the equipment to it limit making the fish-fisherman fight a true test of skill.
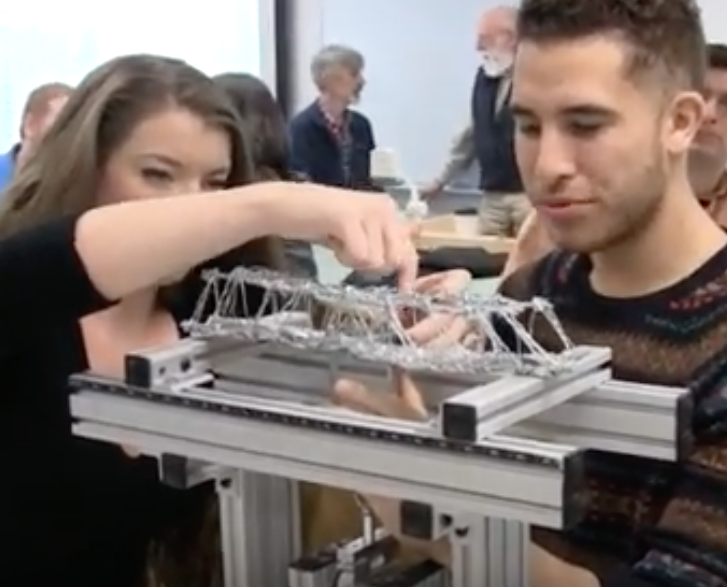
The Clark College Engineering design competition video below should satisfy your appetite for breaking bridges with the Vernier Structures & Materials Tester.
The PASCO Wireless Smart Car
By Edwin P. Christmann
Posted on 2019-02-18
Introduction:
The PASCO Wireless Smart Cart is a device with Bluetooth capabilities that has sensors for force, position, velocity, rotational motion, and three degrees of freedom in acceleration. The wheels on the Smart Cart moves with low friction. A nice touch is that the Smart Cart offered in different colors, i.e., red or blue. Moreover, the Smart Cart features a tray on top where different masses can be placed so students can explore how different masses effect the measurements of various dependent variables. Image 1 shows a blue Smart Cart.
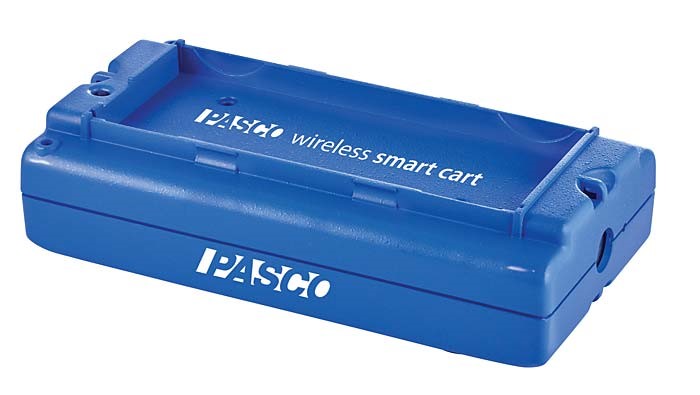
Image 1: A picture of the PASCO Wireless Smart Cart in blue.
Before users can begin data collection with the Smart Cart, it must be charged. Hence, a micro USB cable is included to charge the device. According to PASCO, the Smart Cart has a battery life of 11 hours for high sample rates and 70 hours for low sample rates. Therefore, science teachers and students will have several days to use it before it needs to be recharged. More specifically, the user manual (found at https://www.pasco.com/file_downloads/Downloads_Manuals/Wireless-Smart-Cart-Manual-ME-1240-1.pdf) mentions that with typical use, the Smart Cart’s battery should last from one to four weeks. To improve battery life (when inactive) the Smart Cart turns itself off after a few minutes. While charging, the battery indicator LED light appears yellow; however, once the Smart Cart’s battery is fully charged, the battery indicator LED turns green. When using a wall outlet, a full battery charge should take approximately 3-hours. However, since we used a computer to charge it, it took a slightly longer than three hours for a full charge.
After charging the battery, students can begin to collect data. Subsequently, data from the Smart Cart can be streamed to various devices, e.g., laptops, tablets, or cell phones. Uploading can be done wireless (i.e., a Bluetooth connection) or be using a USB connection. If you are interested in wireless, simply set-up the wireless Bluetooth connection by opening the PASCO data collection software. PASCO offers two forms of data collection software – Capstone and SPARKvue, which are compatible with Mac or Windows devices.
We used SPARKvue when we tested this device. From our experience, we suggest that when students connect the device of their choosing to the Smart Cart, they should open the PASCO data collection software and click on the Bluetooth icon. After clicking the Bluetooth icon, they can select the device from the “Wireless Devices” list (make sure it matches the device ID number located on their Smart Cart). When this is complete, the Bluetooth LED indicator will flash with a green light.
Once the Bluetooth connection is complete, users can begin to experiment. A nice feature of the Smart Cart is that it offers a variety of choices for beginning the experiments. For example, students can choose to enter data manually, collect data with a sensor, open a PASCO experiment, or even open an experiment that has been saved. A picture of the different options that users have is shown below in Image 2. When we tested the Smart Cart, we chose the “Collect Sensor Data” option. Once this option was selected, there were a variety of measurements we could take that included: position, velocity, acceleration, force, and more.
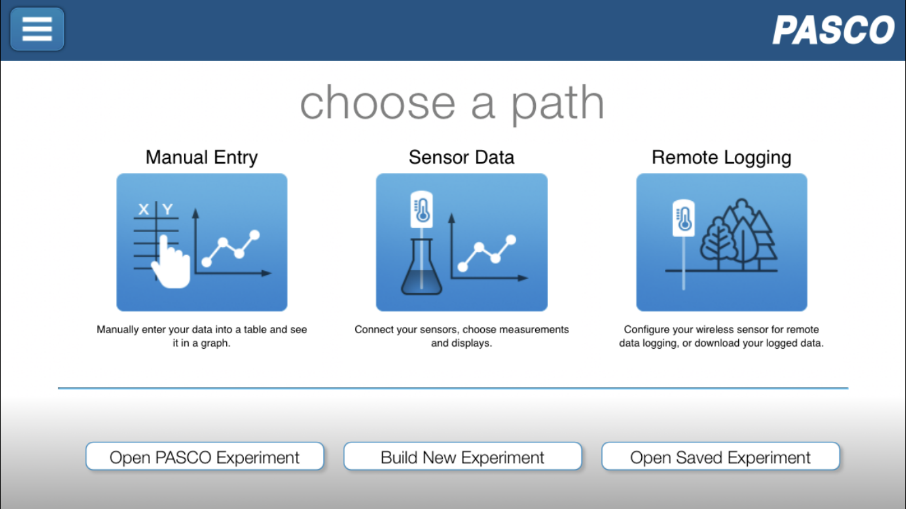
Image 2: Users have a variety of choices to choose from when they start a new experiment.
Additionally, users can choose the template they want for their data (e.g., an individual graph or a graph with a table). Hence, an image displaying the data collection choices users are presented with is displayed in Image 3. After selecting the desired measurement and template, users can start collecting data. To begin collecting data, students must click the green start button at the bottom of the screen. Conversely, to end data collection, students can click the red stop button. Images of sample graphs can be found below in Image 4 and Image 5.
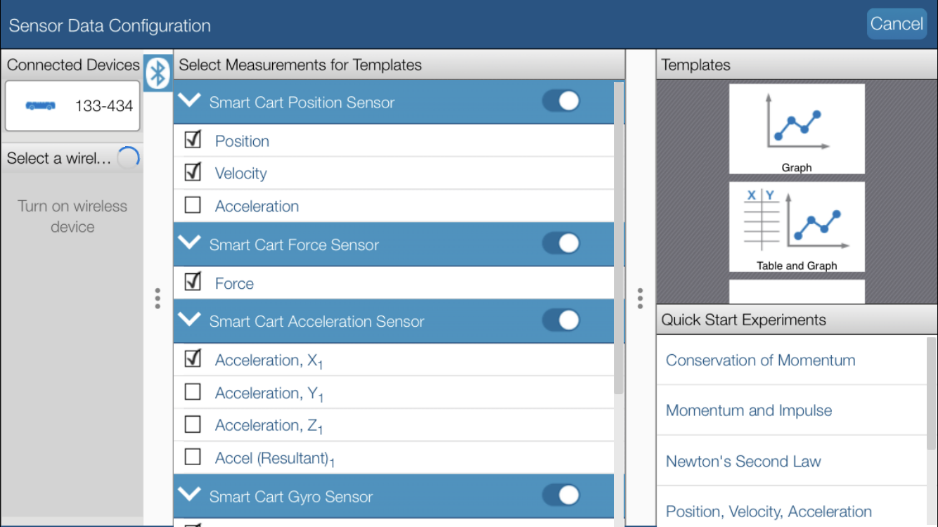
Image 3: Users can select which measurements they would like to measure for their experiment. One measurement or multiple measurements can be selected, and the data can be displayed in different templates.
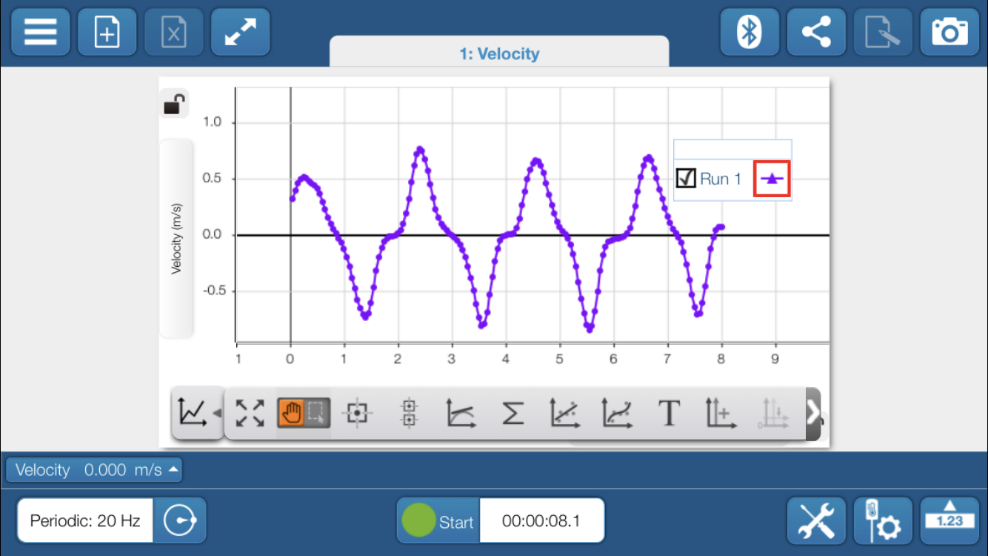
Image 4: A graph illustrating the velocity of the Smart Cart.
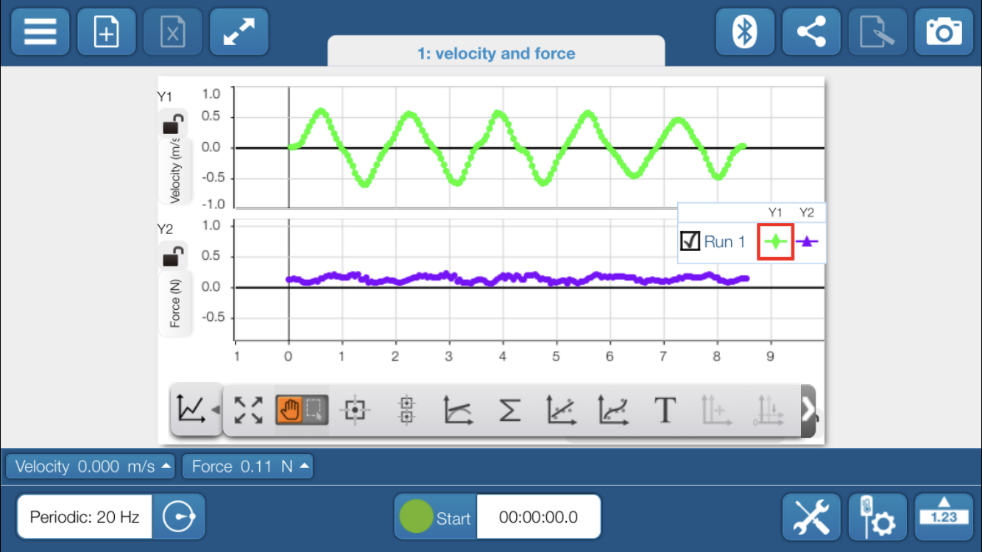
Image 5: A graph illustrating the velocity (shown in green at the top) and force (shown in purple on the bottom) of the Smart Cart.
Classroom Applications
The PASCO Wireless Smart Cart is a useful tool for physical science labs and experiments. Students can use the Smart Cart to examine several physical science concepts e.g., mechanics, kinematics, Newton’s Laws, conservation of energy, conservation of momentum, and elastic/inelastic collisions. On the PASCO website, you can find samples of different labs and experiments for using the Smart Cart in your classroom. These free resources are excellent and can be found at https://www.pasco.com/digital-library/index.cfm.
Additionally, another resource that we found to be valuable is a compatible software program called “MatchGraph!” In the program, students are provided with different graphs and instructed to use their Smart Cart to replicate a graph by attempting to “match” the path displayed on the graph. Below you will find a brief video showing how to use MathGraph.
In Conclusion
From our experience, there is no doubt that the Smart Cart is a major improvement over the equipment that science teachers have used in the past (Remember those old metal carts with rusty wheels?). The Smart Cart is easy to use and is compatible with virtually every device that today’s science teachers and students have access to in contemporary classrooms. In summary, we believe that Pasco’s Smart Cart is a winner!
What’s Included:
– Smart Cart with onboard sensors
– Hook
– Rubber bumper
– Magnetic bumper
– USB cable for charging
Specifications:
– Force
o Range: +/- 100 N
o Resolution: 0.1 N
o Accuracy: +/- 2%
o Maximum Sampling Rate: 500 samples per second
– Position
o Resolution: +/- 0.2 mm
– Velocity
o Maximum Velocity: +/- 3 m/s
o Maximum Sampling Rate: 100 samples per second
– Acceleration
o Range: +/- 16g (g=9.8 m/s2)
o Maximum Sample Rate: 500 samples per second
– Bluetooth Distance
o Maximum Wireless Range: 30 m (unobstructed)
Cost:
– $169 per Smart Cart
About the Authors:
Edwin P. Christmann is a professor and chairman of the secondary education department and graduate coordinator of the mathematics and science teaching program at Slippery Rock University in Slippery Rock, Pennsylvania. Emily Ferraro is a graduate student in the mathematics and science teaching program at Slippery Rock University in Slippery Rock, Pennsylvania.
Introduction:
Surviving the Long Haul
By Gabe Kraljevic
Posted on 2019-02-18
 I hope 20 years from now I can still get excited about being a part of kids’ lives. I am looking for suggestions on how to enjoy teaching for a long time. — J., Missouri
One of the best compliments I ever received was in my last year of teaching: “I walked past your classroom this morning and I just hope I have the same passion when it’s my time to retire!” I really don’t know how to address your question without talking about my approach to my career.
I always expected that some students in every class would pose difficulties and planned accordingly. Similarly, I could only expect a few students to actually be enthused about my course. This led me to focus on developing life-long learners, not scientists or engineers. I shared my passion for learning and tried to make learning fun to accomplish this. I dedicated myself to creating fun environments, being a bit zany, and always being passionate about what I taught, which incidentally made it fun for me.
I embraced change and kept current in my subjects and teaching approaches (life-long learning.) I also tried to distance myself from colleagues who were generally negative and frequently complained. Sure, we all have bad times and need to vent but to live in a negative funk all the time is not good for anyone.
And I had a lot of hobbies.
Hope this helps!
I hope 20 years from now I can still get excited about being a part of kids’ lives. I am looking for suggestions on how to enjoy teaching for a long time. — J., Missouri
Ideas and inspiration from NSTA’s February 2019 K-12 journals
By Mary Bigelow
Posted on 2019-02-15
In addition to an overview/review of the 5E model and the STEM disciplines, the Guest Editorial: Using the BSCS 5E Instructional Model to Introduce STEM Disciplines (in Science & Children)has a framework and suggestions for integrating the Model and STEM disciplines into planned and purposeful instruction. (An interesting read for all grade levels.)
Regardless of what grade level or subject you teach, check out all three K-12 journals. As you skim through titles and descriptions of the articles, you may find ideas for lessons that would be interesting for your students, the inspiration to adapt a lesson to your grade level or subject, or the challenge to create/share your own lessons and ideas.
The Science Teacher – Scientific Reasoning and Argumentation
Editor’s Corner: Scientific Reasoning and Argumentation – “When students defend and critique scientific explanations, experimental designs, or  engineering solutions, they learn to create and evaluate arguments using evidence and logical reasoning. Through critical discourse, they are challenged to distinguish opinion from evidence. They learn that argumentation is how scientists collaboratively construct and revise scientific knowledge.”
The lessons described in the articles include a chart showing connections with the NGSS. The graphics are especially helpful in understanding the activities and in providing ideas for your own investigations.
- Incorporating argumentation does not necessarily mean a need to develop new lessons or investigations. A New Twist on DNA Extraction illustrates a modification of a traditional DNA extraction activity from follow-the-directions to an emphasis on protocol design and collaborative problem solving. The article includes examples of student work.
- The authors of Using Scientific Argumentation to Understand Human Impact on the Earth use the High Adventure Science project that guides students through the process. “When students hear “construct an argument” they often think in terms of an exchange of opposing viewpoints or an attempt to persuade others that an idea is correct or incorrect. Scientific arguments are different; developing a scientific argument involves defending a claim based on evidence, and should also include an examination of the evidence to determine its limitations and merits.”
- Let’s Invent! has suggestions for incorporating invention as a way to engage students in engineering design and local problems. The article describes two strategies that any teacher could use to start students inventing: Grab Bag Inventing and Problem Finding.
- Formatively Assessing NGSS addresses a need that many science teacher have: how to assess the three dimensions of the NGSS. The authors describe three models for assessment–sequential, concurrent, and embedded—with examples and tips. There is a helpful table showing how formative assessment strategies that teachers may already use can align with these models.
- “Proxy data are preserved physical characteristics of the environment that stand in—serve as proxies—for direct measurements.” Proxy Climatology shows how students used tree rings to investigate climate change. The author includes a link to the lesson, including rubrics and data sets.
- Focus on Physics: Quickly Teaching Speed, Velocity, and Acceleration—Part 1 takes a realistic look at prioritizing the number and depth of topics and distinguishing between the tool and concepts of physics.
These monthly columns continue to provide background knowledge and classroom ideas:
- Career of the Month: An interview with paleontologist Emily Lindsey
- Right to the Source: Learning to Think – An 1856 book from the Library of Congress encourages thinking in children.
For more on the content that provides a context for projects and strategies described in this issue, see the SciLinks topics Acceleration, Climate Change, Dendochronology, DNA, Motion, Paleontologist, Paleontology, Speed, Velocity
Many authors share resources related to the lessons and strategies in their articles. These resources include rubrics, graphic organizers, handouts, diagrams, lists of resources, and complete lessons. You can access these through the Connections link for The Science Teacher.
Keep reading for Science & Children and Science Scope.
 Science & Children – STE and M
Editor’s Note: STEM Lessons for All – “STEM is more than just the collection of science, technology, engineering, and mathematics, or even the discrete attention to these four disciplines; it is the integration of disciplines used to find answers, solve problems, and create solutions. This month’s focus on STEM offers ideas for incorporating all four elements of STEM and provides support and guidance in creating STEM lessons for all students.”
The lessons described in the articles have a chart showing connections with the NGSS. Many are based on the 5E model and include classroom materials, illustrations of student work, and photographs of students engaged in the activities.
- Crossing the Amazon by LEGO integrates robotics and the engineering design to solve a problem. The authors also discuss low-tech options.
- Simulating a Non-Native Invasion includes a detailed unit plan for engaging students in the design of a computer simulation to model and predict how the introduction of an invasive species to an ecosystem affects native populations.
- You don’t need a lot of specialized equipment to engage students in STEM activities, as described in A Water Wheel Challenge! (check out the photographs). Students design, build, test, and refine a water wheel as they study energy conversions.
- Unpacking the STEM Disciplines exemplifies how STEM and the 5E model are a natural fit. In this unit, students take a global issue and personalize it at a local level as they are “guided through the four STEM disciplines in a personalized learning experience about the general theme of humans’ impacts on Earth and a specific place-based project on the use and disposal of plastic water bottles in the school.”
- What may appear to be play in The Early Years: Teaching the M in STEM is actually an investigation in which young learners observe motion and the properties of matter.
- Teaching Through Trade Books: Seasonal Weather Patterns has two related lessons. Sunshine and Seasons (K-2) focuses on observing the amount of daylight and the angle of the Sun’s rays. In A Picture of the Weather (3-5), students gather and graph data to look for patterns.
- Engineering Encounters: Authors and Engineers describes how students can learn engineering principles as they design, construct, and test pop-up books based on their own writing. The article includes photos of student work and has links to download materials.
- No excuses! Students of all ages are natural STEM learners. Teaching Teachers: Seven Myths of STEM debunks common misconceptions about designing and implementing STEM education activities and suggests sources for free or low-cost activities.
- Methods & Strategies: Improving the Quality of Engineering Design Challenges has five “optimizations” for guiding teachers, as students apply what they are learning to problem-solving designs.
These monthly columns continue to provide background knowledge and classroom ideas:
- Science 101: Why Does Water Swirl When it Goes Down a Drain? clears up misconceptions about this phenomenon.
- Formative Assessment Probes: Balance Beam has hands-on opportunities for students to explore algebraic equations.
- The Poetry of Science: Poetry by the Numbers
- Early Childhood Resources Review: Creative Investigations in Early Engineering & Technology
For more on the content that provides a context for projects and strategies described in this issue, see the SciLinks topics Coriolis Effect, Design, Energy Transformations, Engineering Structures, Environment, Forces and Motion, Invasive Species, Levers, Momentum, Physical Properties of Matter, Science of Bridges, Seasons, Weather, Weather and Climate, What Causes Earth’s Seasons?
Many authors share resources related to the lessons and strategies in their articles. These resources include rubrics, graphic organizers, handouts, diagrams, lists of resources, and complete lessons. You can access these through the Connections link for Science & Children.
 Science Scope – Stability and Change
From the Editor’s Desk: Stability and Change—Integral to Systems – “Discussions and investigations related to topics such as erosion, evolution, and climate change can serve to explicitly highlight the connection of stability and change to systems…Possessing a deep comprehension of systems and how systems respond to change is essential when solving problems. Involving your students in this work parallels that of scientists and engineers and helps them see the interconnectedness of human-made and natural systems.”
Articles in this issue that describe lessons (many of which use the 5E model) include a helpful sidebar documenting the big idea, essential pre-knowledge, time, safety issues, and cost. The lessons also include connections with the NGSS.
- Cougars and Bears and Wolves, Oh Elk! has a lesson in which students modeled population changes, analyzed graphs, used their research as evidence to support a claim, and produced a written summary. The authors provide samples of handouts and rubrics.
- The question Is Our Water Safe to Drink? could apply to many communities. This project provided an authentic opportunity for students to investigate. The article includes a timeline for the lesson, student sketches, and suggestions for designing a filtration tool.
- Investigating Bark Beetle Outbreaks was the task of middle school students as they studied the effects of climate change on beetle populations and used a computer simulation to study changes over time and identify causes.
- Focusing on one of the NGSS performance expectations, Using Storylines to Support Three-Dimensional Learning in Project-Based Science describes a process and a planning tool to engage students in making sense of phenomena using a “storyline” that runs through a unit.
- Practical Research: Sound Practices in Climate Change Education elaborates on three themes: “connecting students with local climate change impacts; encouraging students to collect, analyze, and draw conclusions from their own data; and fostering relationships between climate scientists, teachers, and students.”
- The process in Teacher’s Toolkit: Using the Five Practices to Facilitate a Meaningful Discussion on Plate Tectonics in a Middle School Classroom includes anticipating, monitoring, selecting, sequencing, and connecting. The authors include examples from a middle school lesson.
- Citizen Science: Plant Phenology for Budding Biologists describes an ongoing project in which students observe changes over time and contribute their observations to a database about seasonal plant growth.
- Teacher to Teacher: Making Sense of Stability and Change notes how students should understand the concept of “systems” in order to contextualize their observations on how things change and how they stay the same. The authors discuss what this would “look like” in a real classroom (including a graphic organizer).
These monthly columns continue to provide background knowledge and classroom ideas:
- Disequilibrium: Surface Tension and Surfactants
- Scope on the Skies: The Van Allen Radiation Belts
- Interdisciplinary Ideas: Expanding the Power of Data Analysis with Google Sheets
- Science for All: Building a Bridge Over Homework—How to design at-home assignments that are both valuable and effective. The article includes a table on how to differentiate homework assignments.
- Making in the Middle: Robots and Sequences
For more on the content that provides a context for projects and strategies described in this issue, see the SciLinks topics Changes in Ecosystems, Changes to the Earth’s Surface, Climate Change, Ecosystems, Energy Transformations, Forces, Forests, Homeostasis, Limiting Factors, Plant Growth, Plate Tectonics, Predator/Prey, Radiation from the Sun, Robots, Seasons, Systems, Water Quality
Many authors share resources related to the lessons and strategies in their articles. These resources include rubrics, graphic organizers, handouts, diagrams, lists of resources, and complete lessons. You can access these through the Connections link for Science Scope.
In addition to an overview/review of the 5E model and the STEM disciplines, the Guest Editorial: Using the BSCS 5E Instructional Model to Introduce STEM Disciplines (in Science & Children)has a framework and suggestions for integrating the Model and STEM disciplines into planned and purposeful instruction. (An interesting read for all grade levels.)
10 Reasons High School Teachers Should Join NSTA in St. Louis in April
By Carole Hayward
Posted on 2019-02-15
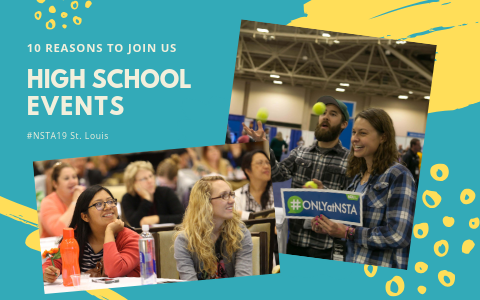
“I work at a school in a science department that needs a little bit of re-innovation. I am trying to invigorate my department and help connect them with ideas that will help our students shine!” High school teacher Meghan W. had a great reason for wanting to be at NSTA’s National Conference last year, and no doubt many science teachers feel the same. NSTA conferences have great science ed PD, and we bring together the brightest minds in the field. Here are 10 more reasons high school educators won’t want to miss #NSTA19 in St. Louis this April.
- High School Share-a-Thon—Saturday, April 13, 9:30–11:00 AM
Join NSTA’s High School Division Director, Carrie Jones (ncscienceteacher@yahoo.com) for a high-energy morning designed just for high school educators. Session organizers say this is the place to come if you need new lessons for your high school classroom. Stop by for networking, great ideas, fun activities, handouts, and door prizes.
(See page 13 of the program preview for more information.) - NGSS@NSTA Forum—Friday, April 12, 8:00 AM–4:30 PM
Held annually, this forum is considered to be the best place to explore three-dimensional teaching and learning. This year’s NGSS@NSTA Forum will focus on instructional materials. At the opening session, you’ll discover tools you can use to evaluate resources; and then five additional sessions will highlight instructional units designed to address three-dimensional standards. Click here for a list of the sessions.
(See page 11 of the program preview for more information.) - Dozens of sessions will be led by high school educators. Below is a small sampling of what you’ll find when you search the session browser for events targeted for high school science teaching:
- Developing Inclusive, Three-Dimensional Science Communities in High School Chemistry Classrooms, Thursday, April 11, 8:00–9:00 AM
- A Generation of Citizen Stewards, Thursday, April 11, 8:30–9:00 AM
- STEP UP 4 Women: Bringing the Representation of Women in Physics to 50% with High School Interventions, Thursday, April 11, 12:30–1:30 PM
- Creating a High School Physics Course in the NGSS Style, Friday, April 12, 8:00–8:30 AM
- Adventures in Flipped-Mastery: The Do’s and Don’ts of Changing a Traditional Classroom into a Flipped Learning and Standards-Referenced Environment, Friday, April 12, 9:30–10:30 AM
- Integrating E-Books into the Secondary Classroom Friday, April 12, 11:00 AM–12 Noon
- NGSS Session: What Can and Should We Do with CRISPR? A Next Generation Storyline That Connects Science to Students’ Interests and Concerns, Saturday, April 13, 12:30–1:30 PM
- HHMI Night at the Movies—Thursday, April 11, 6:00 PM, at the Ferrara Theatre in America’s Center.
Admission is free! Complimentary refreshments before the show.
(See page 33 of the program preview for more information.) - Global Conversations: Welcome to My High School Classroom (W-2)—Wednesday, April 10, 7:20–11:45 AM
Welcome to My Classroom is a program sponsored by NSTA’s International Advisory Board and is intended primarily for international participants to view science classrooms. Those with W-2 tickets will visit the Collegiate School of Medicine and Bioscience, an innovative college preparatory grades 9–12 high school with high expectations for its academic team and student body. For more information, visit slps.org/collegiate.
(See page 18 of the program preview for more information.) - Association of Science-Technology Centers (ASTC)–sponsored session: Citizen Science Investigations—Data-Rich Learning at Your Doorstep—Thursday, April 11, 3:30–4:30 PM
Experience how citizen science provides a context for developing students’ understanding of data and variability along with science skills and concepts through local ecosystem investigations.
Click here to see more ASTC-sponsored sessions. - Learn how to get published in The Science Teacher (NSTA’s high school journal) or any of NSTA’s journals—Saturday, April 13, 9:30–10:30 AM
Meet the editors of NSTA’s four grade-level teaching journals. Find out what types of articles they’re looking for, why it’s important to use your own classroom experience as the subject matter, how the review process works, and more. Would-be authors will find that it’s not so daunting to share their great ideas with peers. - Meet the authors of your favorite NSTA Press books and share ideas for using their innovative strategies in the classroom. All NSTA Press sessions will be held in America’s Center. Click here to see all of the sessions. Many of the sessions are great for high school teachers, including the following:
- Integrate Engineering into the Science Classroom Using Case Studies
Thursday, April 11, 5:00–6:00 PM
Struggling to add more engineering to your science class? Join us for hands-on case studies for grades 6–12 physical and life sciences. - Reading Nature—Engaging Biology Students with Evidence from the Living World
Friday, April 12, 9:30 AM – 10:30 AM
Engage adapted primary literature using an NSTA Press publication that allows biology students to not only understand core ideas, but understand how they are justified. - Beyond the Egg Drop-Infusing Engineering into High School Physics/Science Classrooms
Friday, April 12, 2:00 PM–3:00 PM
Egg drop, marshmallow tower, motor-building…we certainly don’t lack “activities” in our science classroom. How can we go beyond trial-and-error? Explore concept-based engineering infusion and assessment options. - Once Upon an Earth Science Book
Sunday, April 14, 9:30 AM–10:30 AM
Want your students to read and write more effectively? Join Jodi Wheeler-Toppen, author of the Once Upon a Science Book series, for lessons that integrate literacy and Earth science content.
- Integrate Engineering into the Science Classroom Using Case Studies
- The Exhibit Hall—Daily
Some call NSTA’s exhibit hall the “science teacher’s playground,” and while it truly is fun, you’ll also pick up a lot of PD and get to try top-notch science ed resources while there. Check out this blog to see what happens there (and only there)—from the whacky to the wonderful. View the exhibit floor and plan your route here (and don’t forget to leave room in your suitcase for all the swag). - Meet your fellow high school teachers at the First-Timers Session—Thursday, April 11, 8:00–9:00 AM.
This may be last on our list, but it should be first on yours. You’ll find tables marked “High School” (among other topics you may choose from like STEM and NGSS), where you can meet other attendees with similar interests, get to know the NSTA leadership, win prizes, and have a lot of fun. It’s the best way to kick off your conference experience!
Can’t Attend But Want the Experience?
Follow along on Twitter and Instagram using #NSTA19, like NSTA on Facebook and check out our St. Louis album, or follow The Science Teacher editor on Twitter for high school–specific information about the conference and other happenings at NSTA.
Pro Tips
Check out more sessions and other events with the St. Louis Session Browser. Follow all our conference tweets using #NSTA19, and if you tweet, please feel free to tag us @NSTA so we see it and share.
Need help requesting funding or time off from your principal or supervisor? Download a letter of support and bring it with you.
And don’t forget, NSTA members save up to $90 off the price of registration. Not a member? Join here.
Future NSTA Conferences
2019 National Conference
St. Louis, April 11–14
8th Annual STEM Forum & Expo, hosted by NSTA
San Francisco, July 24–26, 2019
The mission of NSTA is to promote excellence and innovation in science teaching and learning for all.
Follow NSTA
|
|
|
|
|
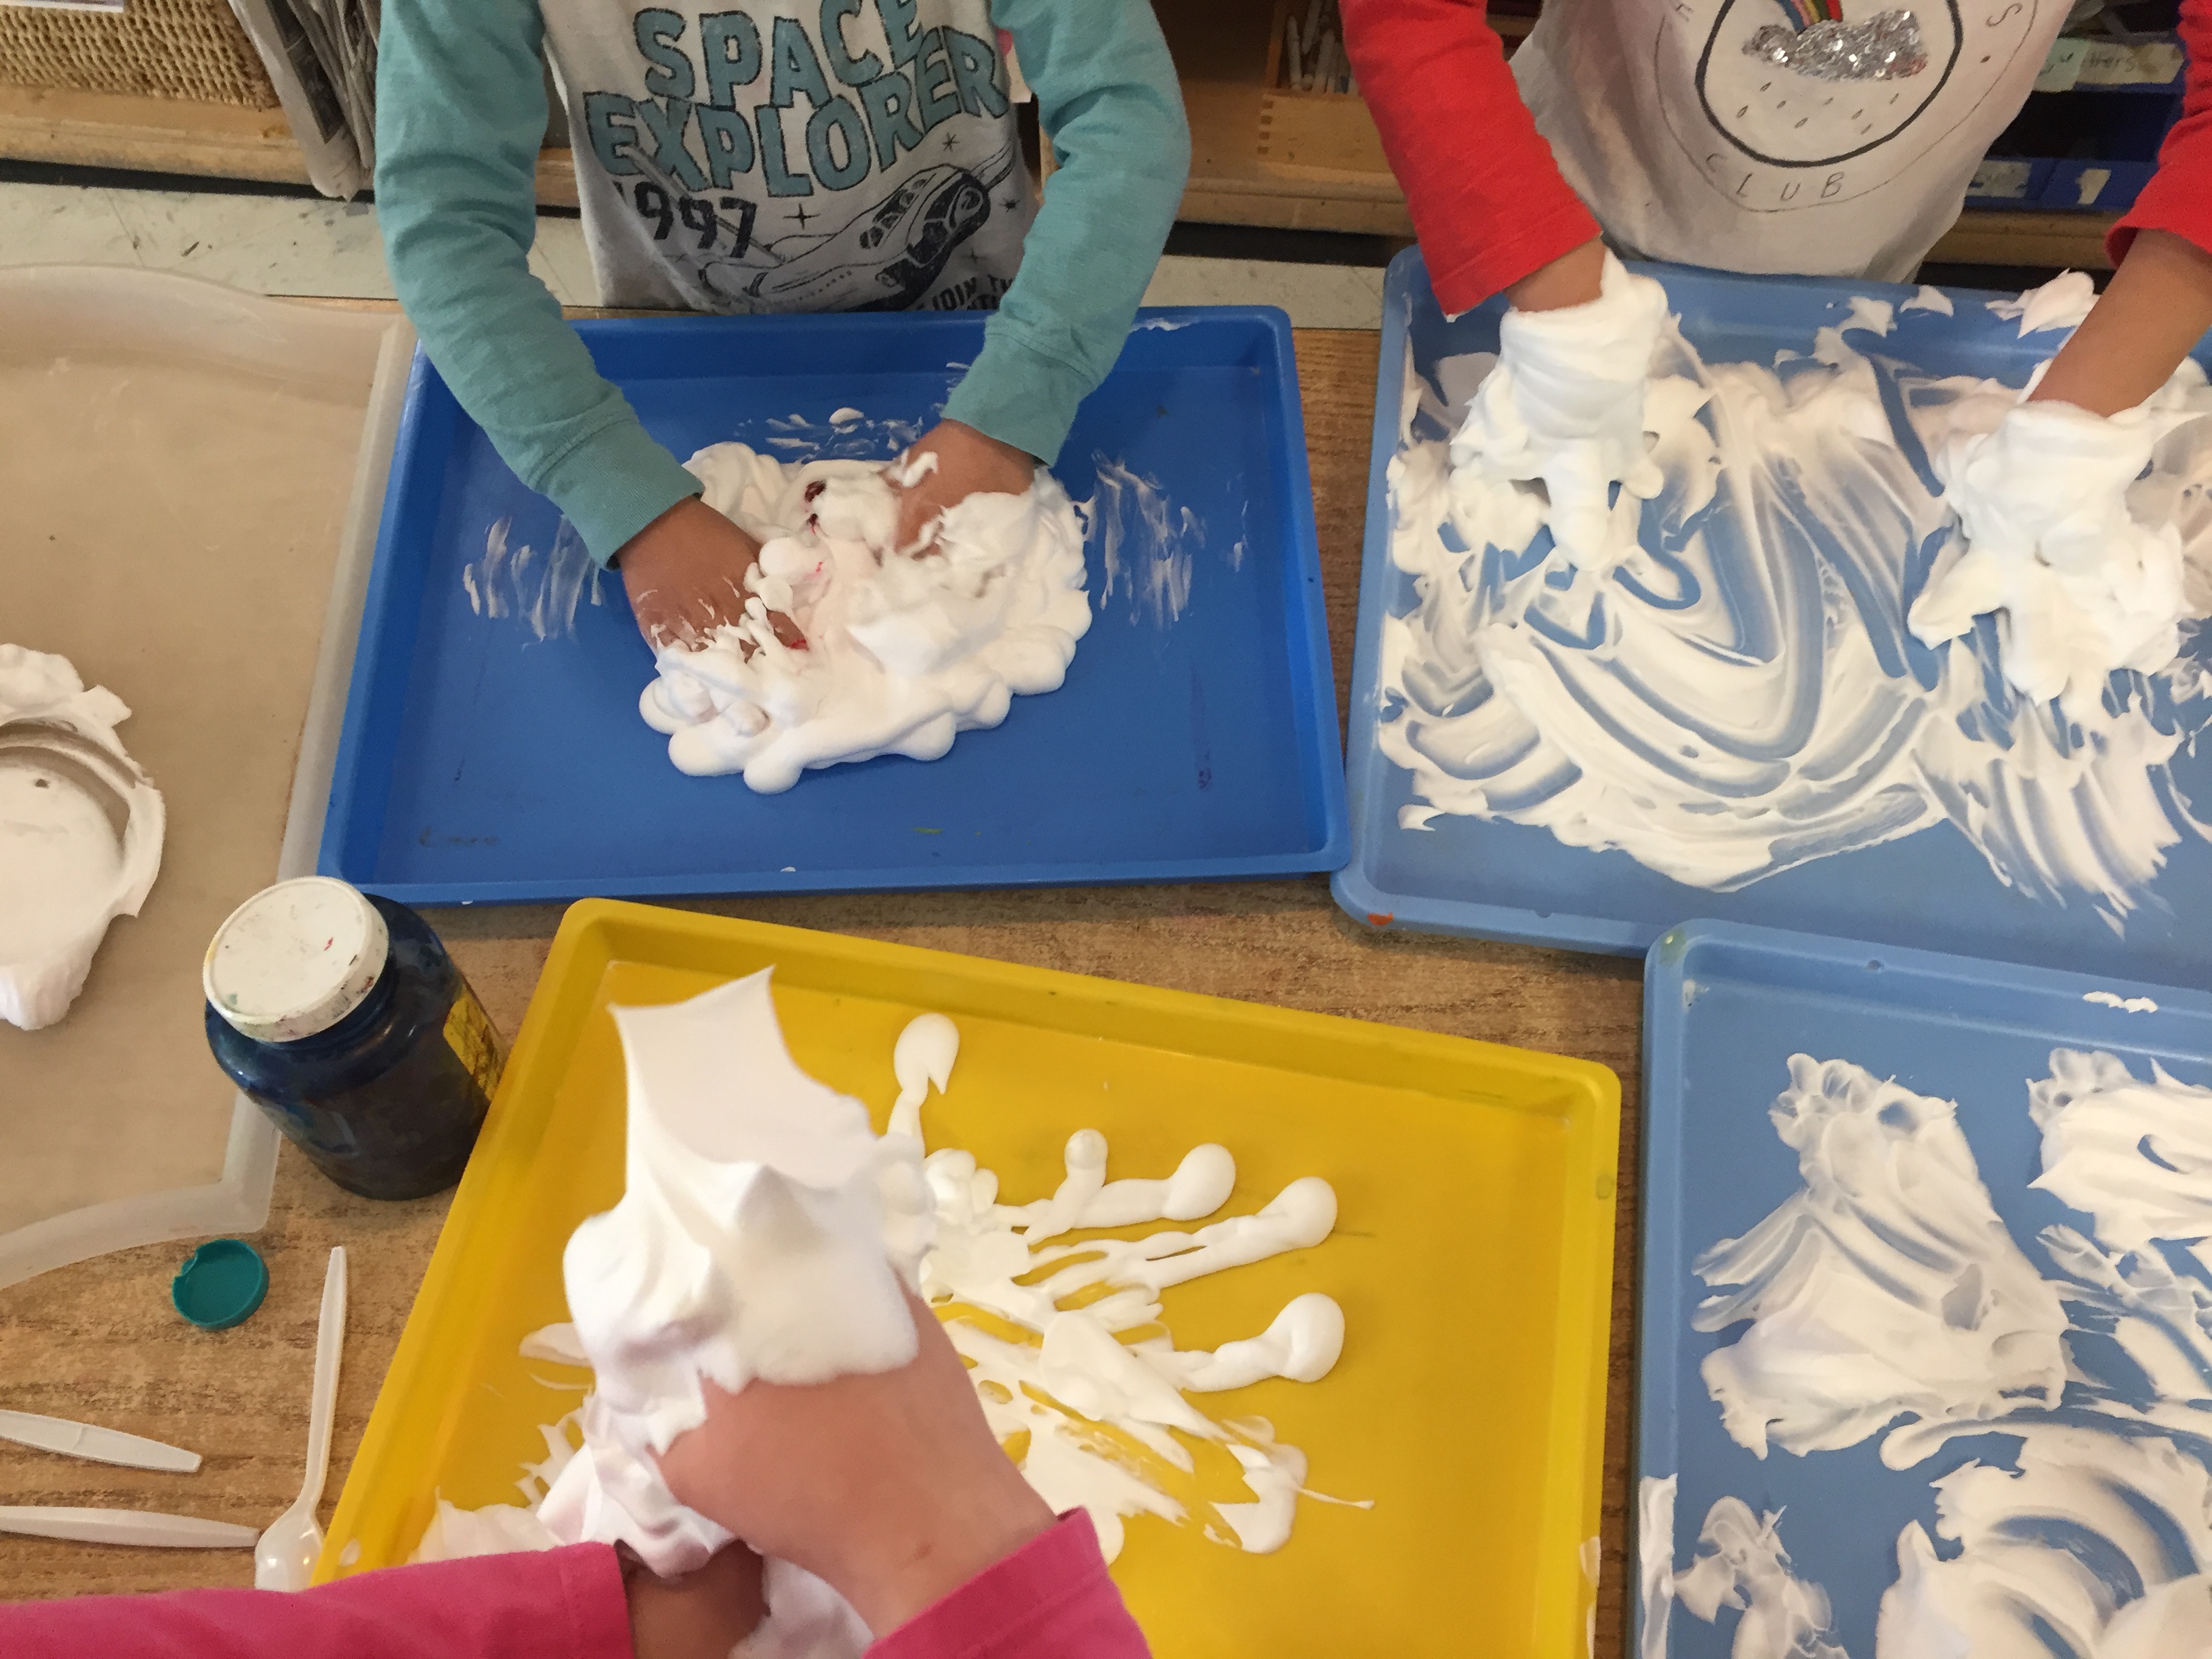
Sensory play for science learning
By Peggy Ashbrook
Posted on 2019-02-15
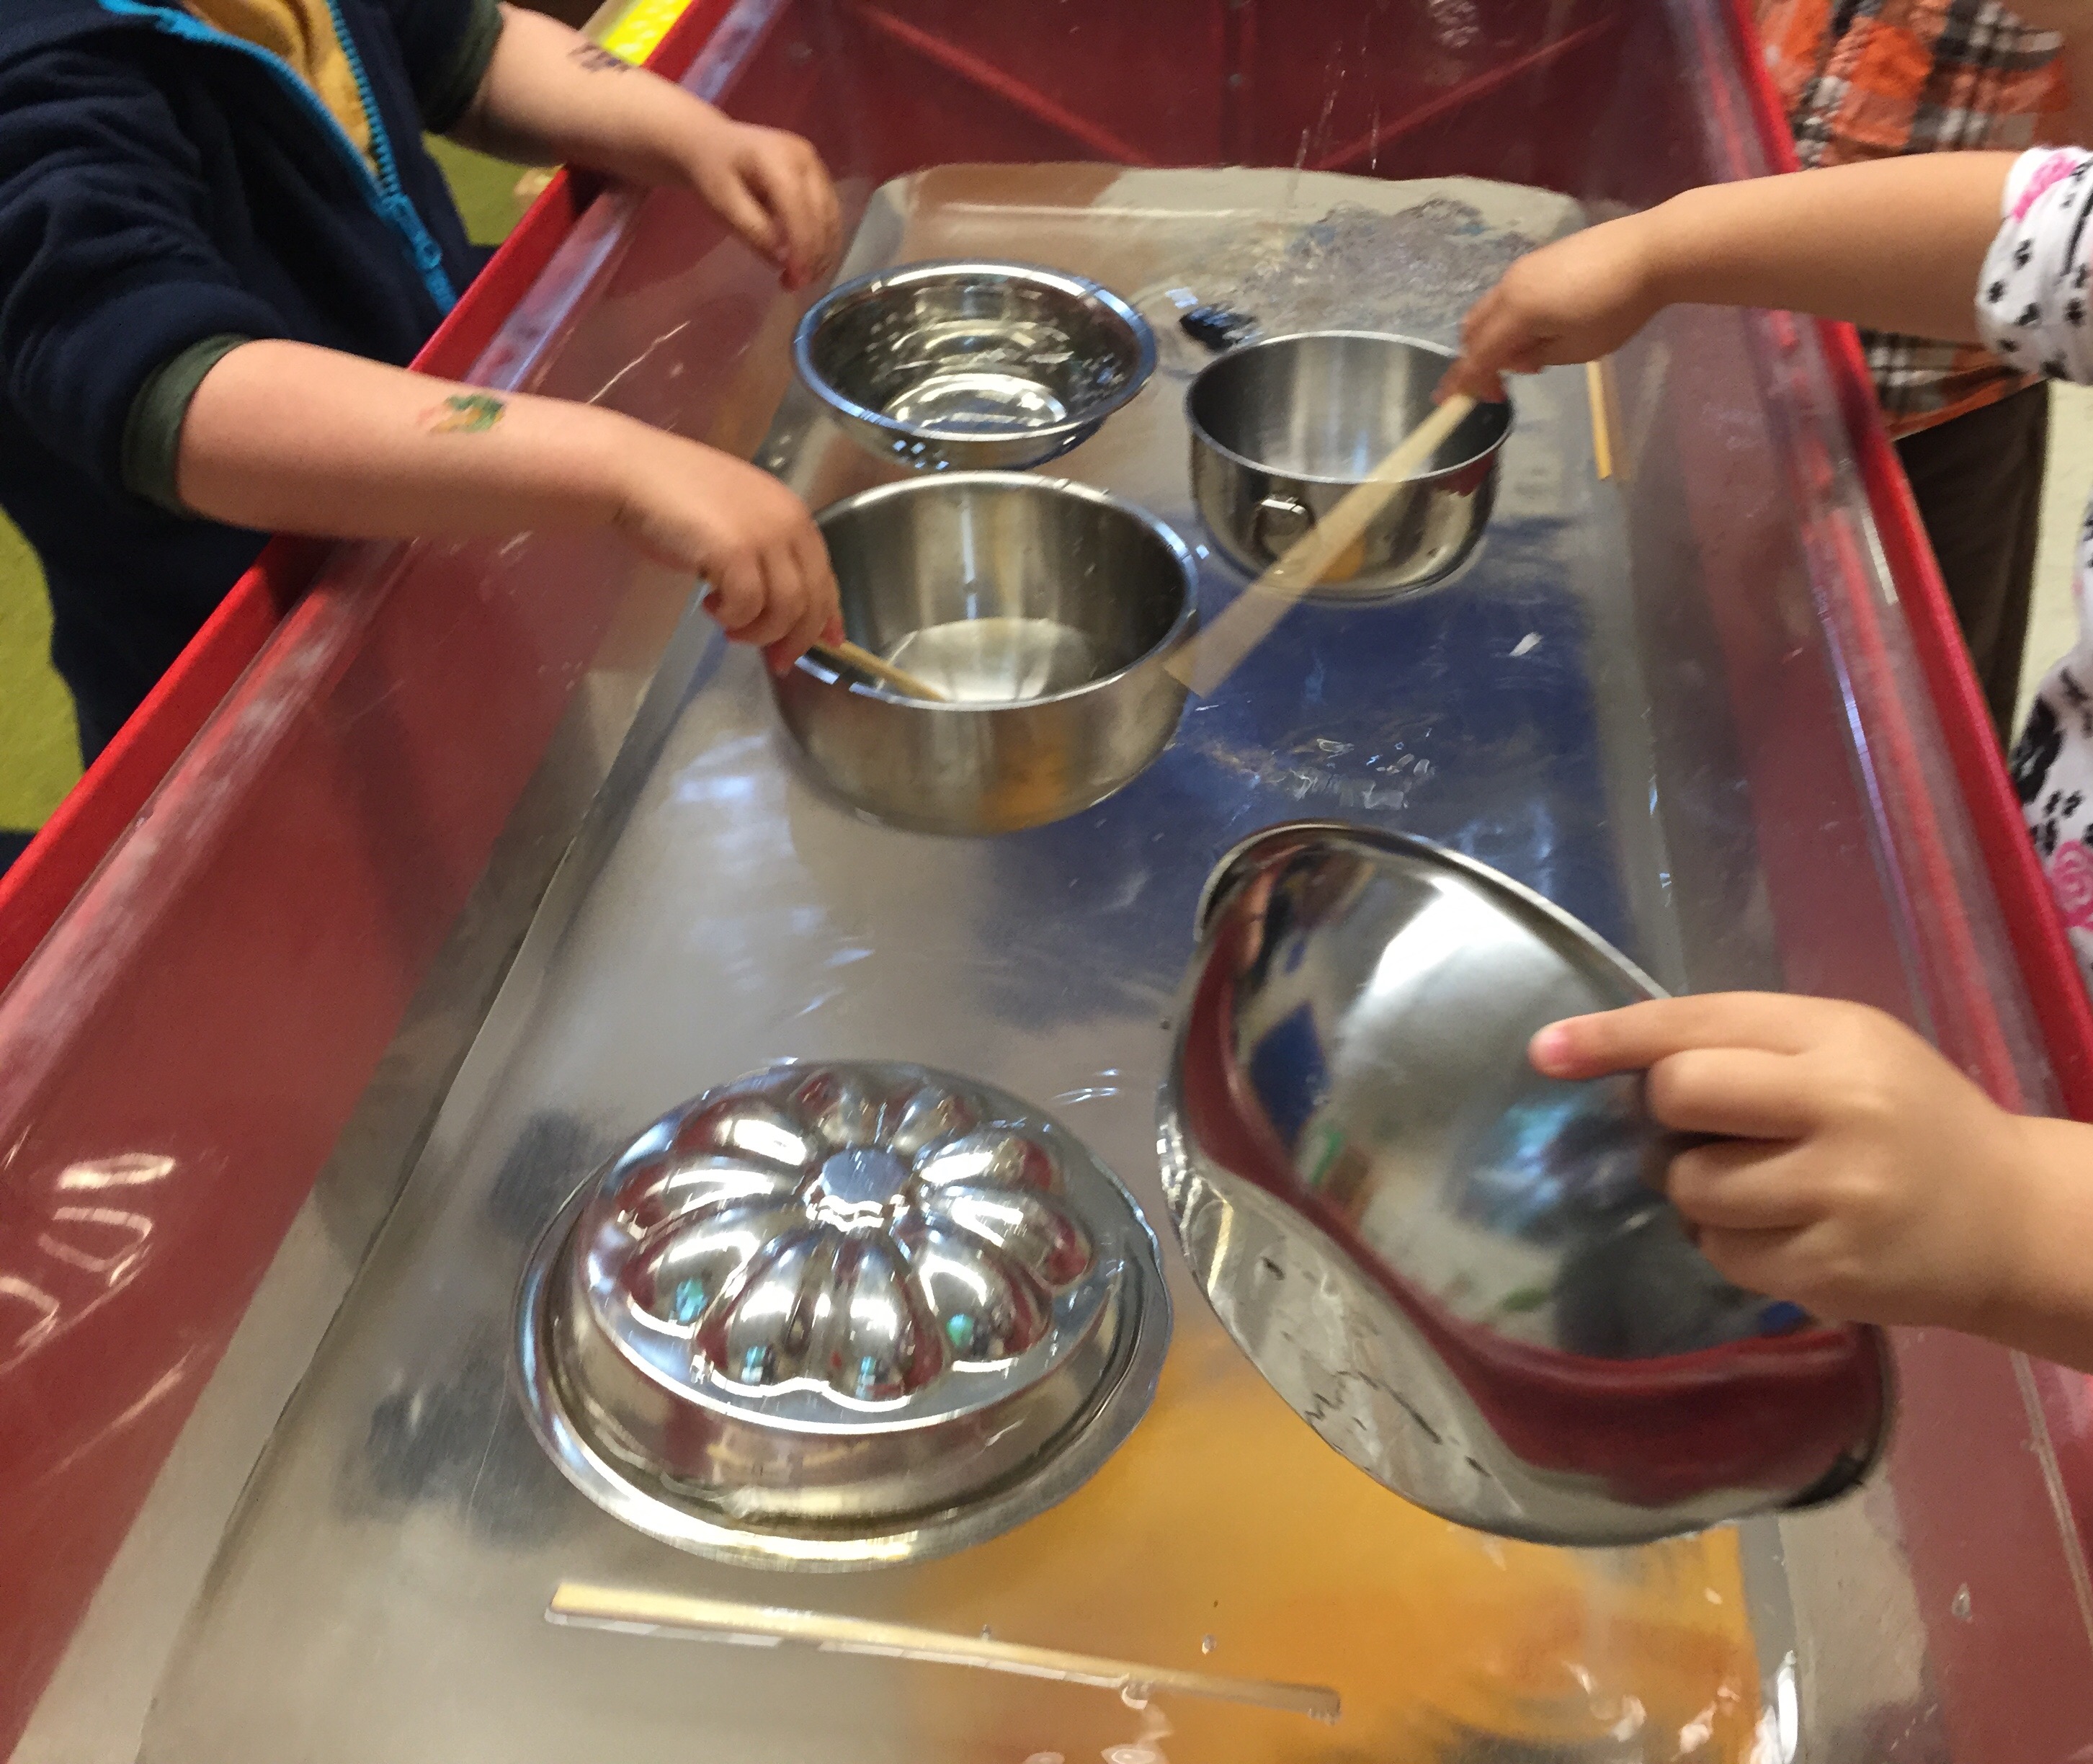
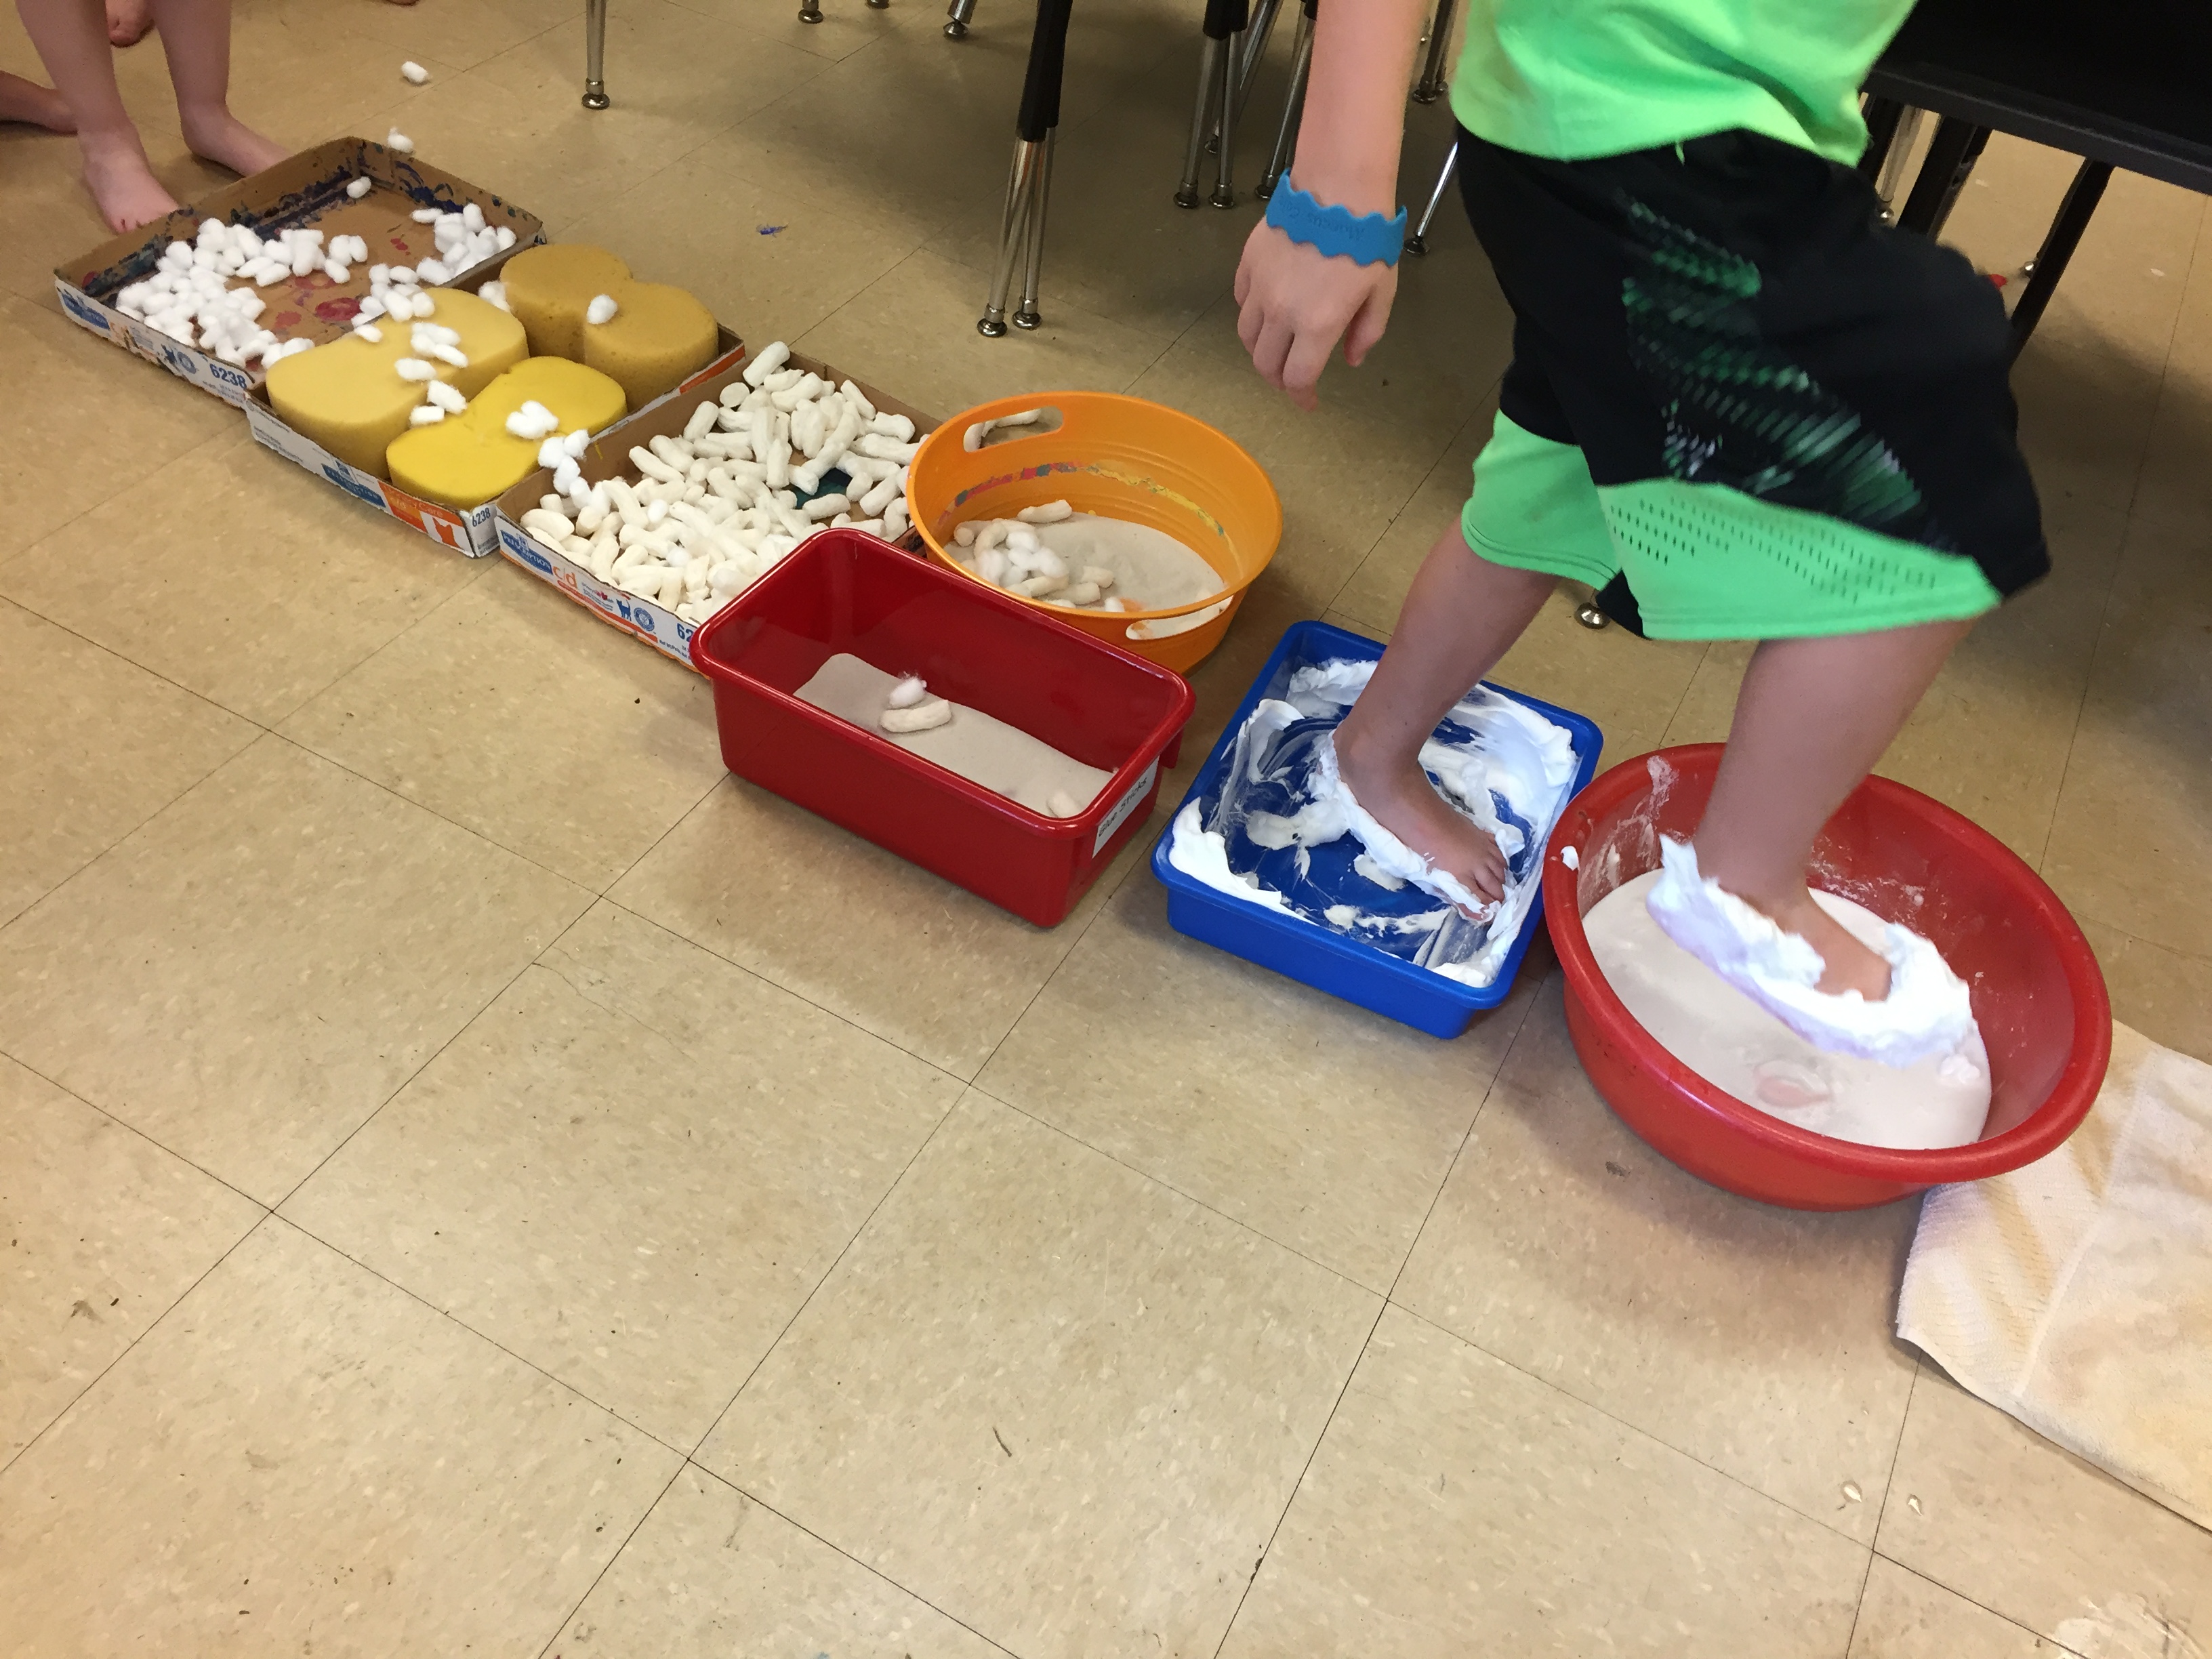
Children and people of all ages continually explore and learn through their senses. Prior experiences that build understanding of how we use our senses to learn about the world are the foundation for understanding the Next Generation Science Standards Disciplinary Core Ideas. Some children seek out specific experiences such as the two-year-old who would enthusiastically cling to my arm when I wore an especially soft microfiber fleece jacket, and the four-year-old who liked to be the last one to wash her hands so she could be there long enough to create a mound of bubbles to feel. Stomping in puddles and rolling down a grassy slope were favorite experiences of other children. The weight or softness of a certain doll, the bark texture of a special stick, or the size of a particular toy car, are why these objects meet the needs of some children.
-
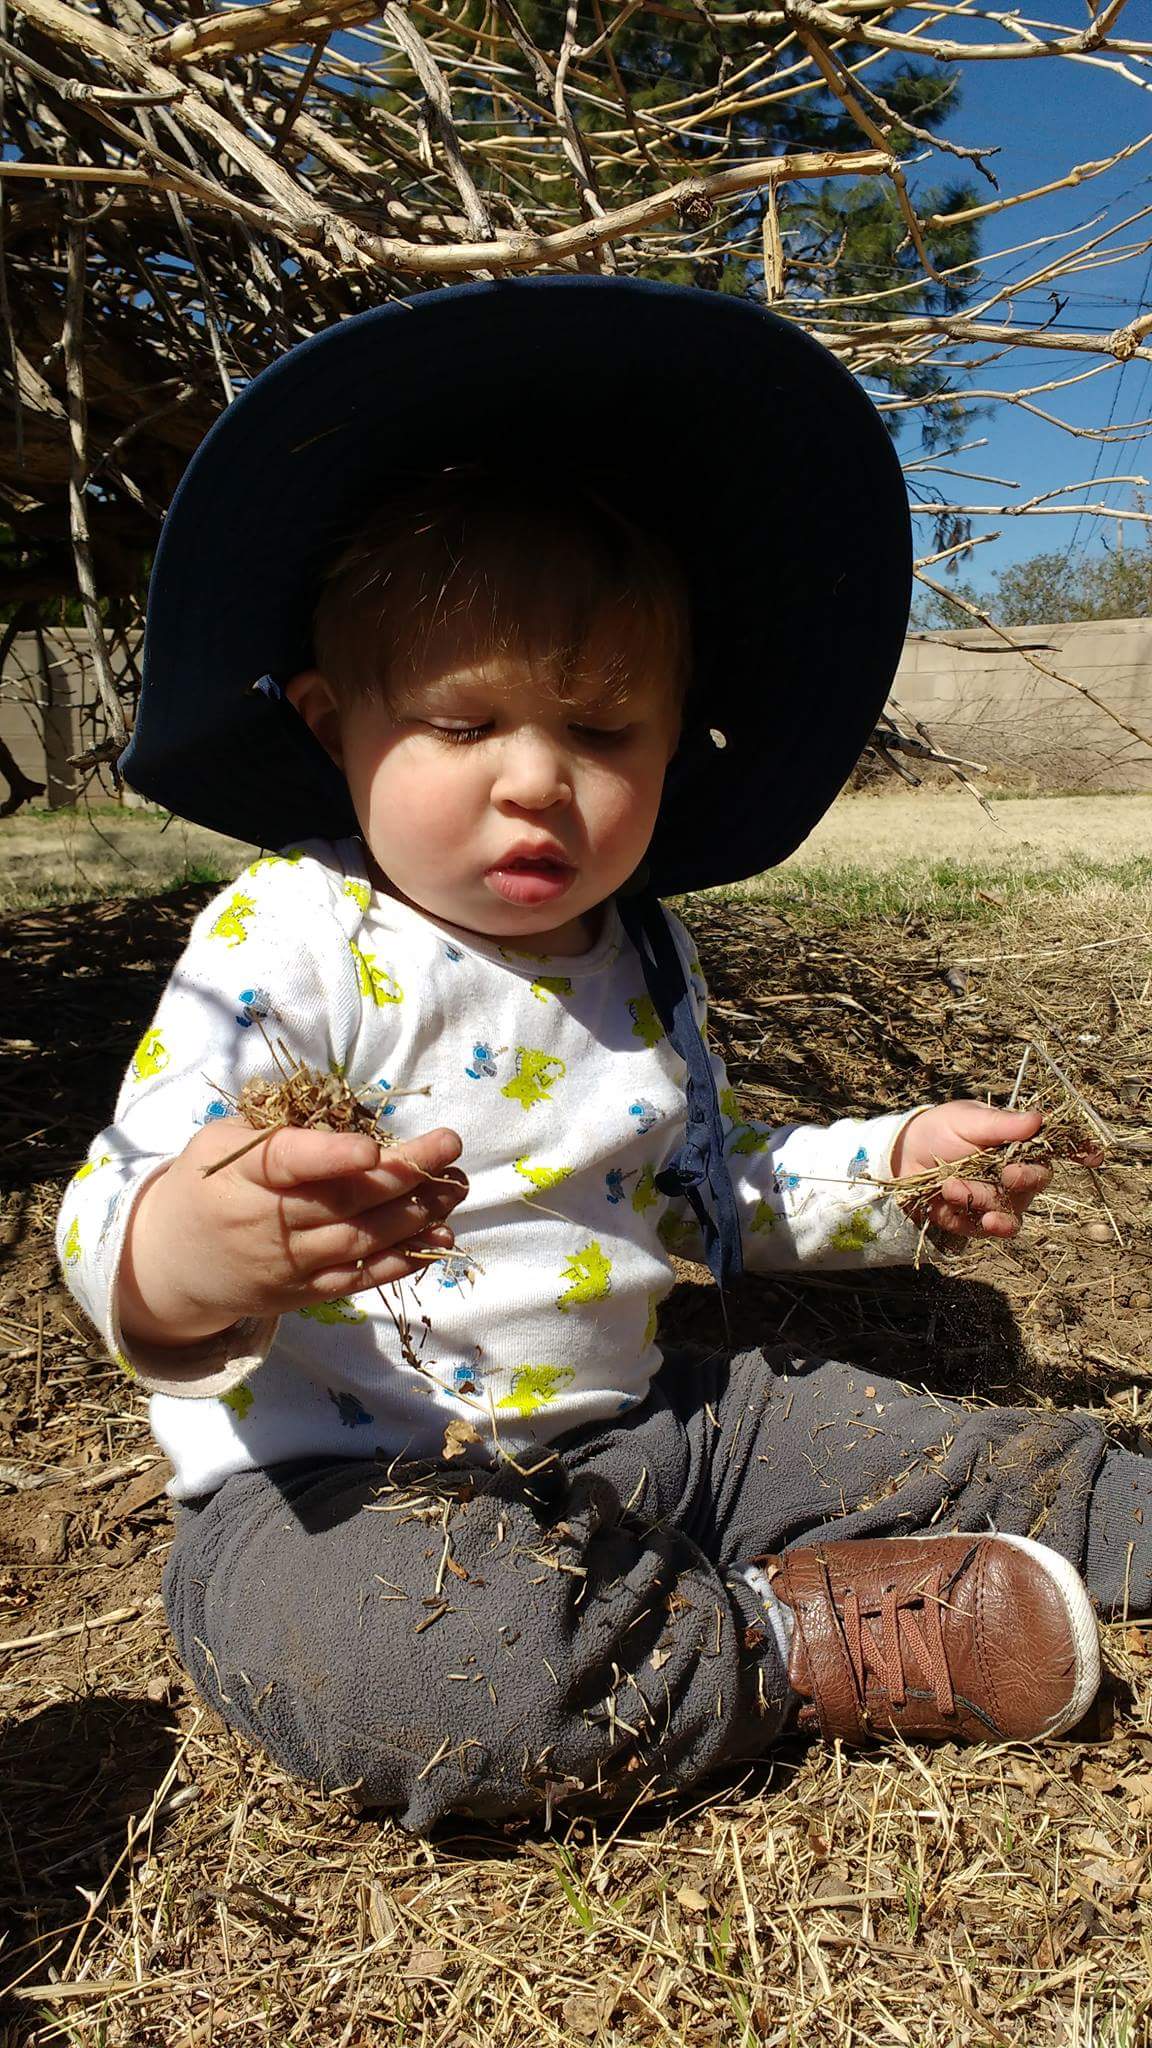
- Feeling dried grasses.
-
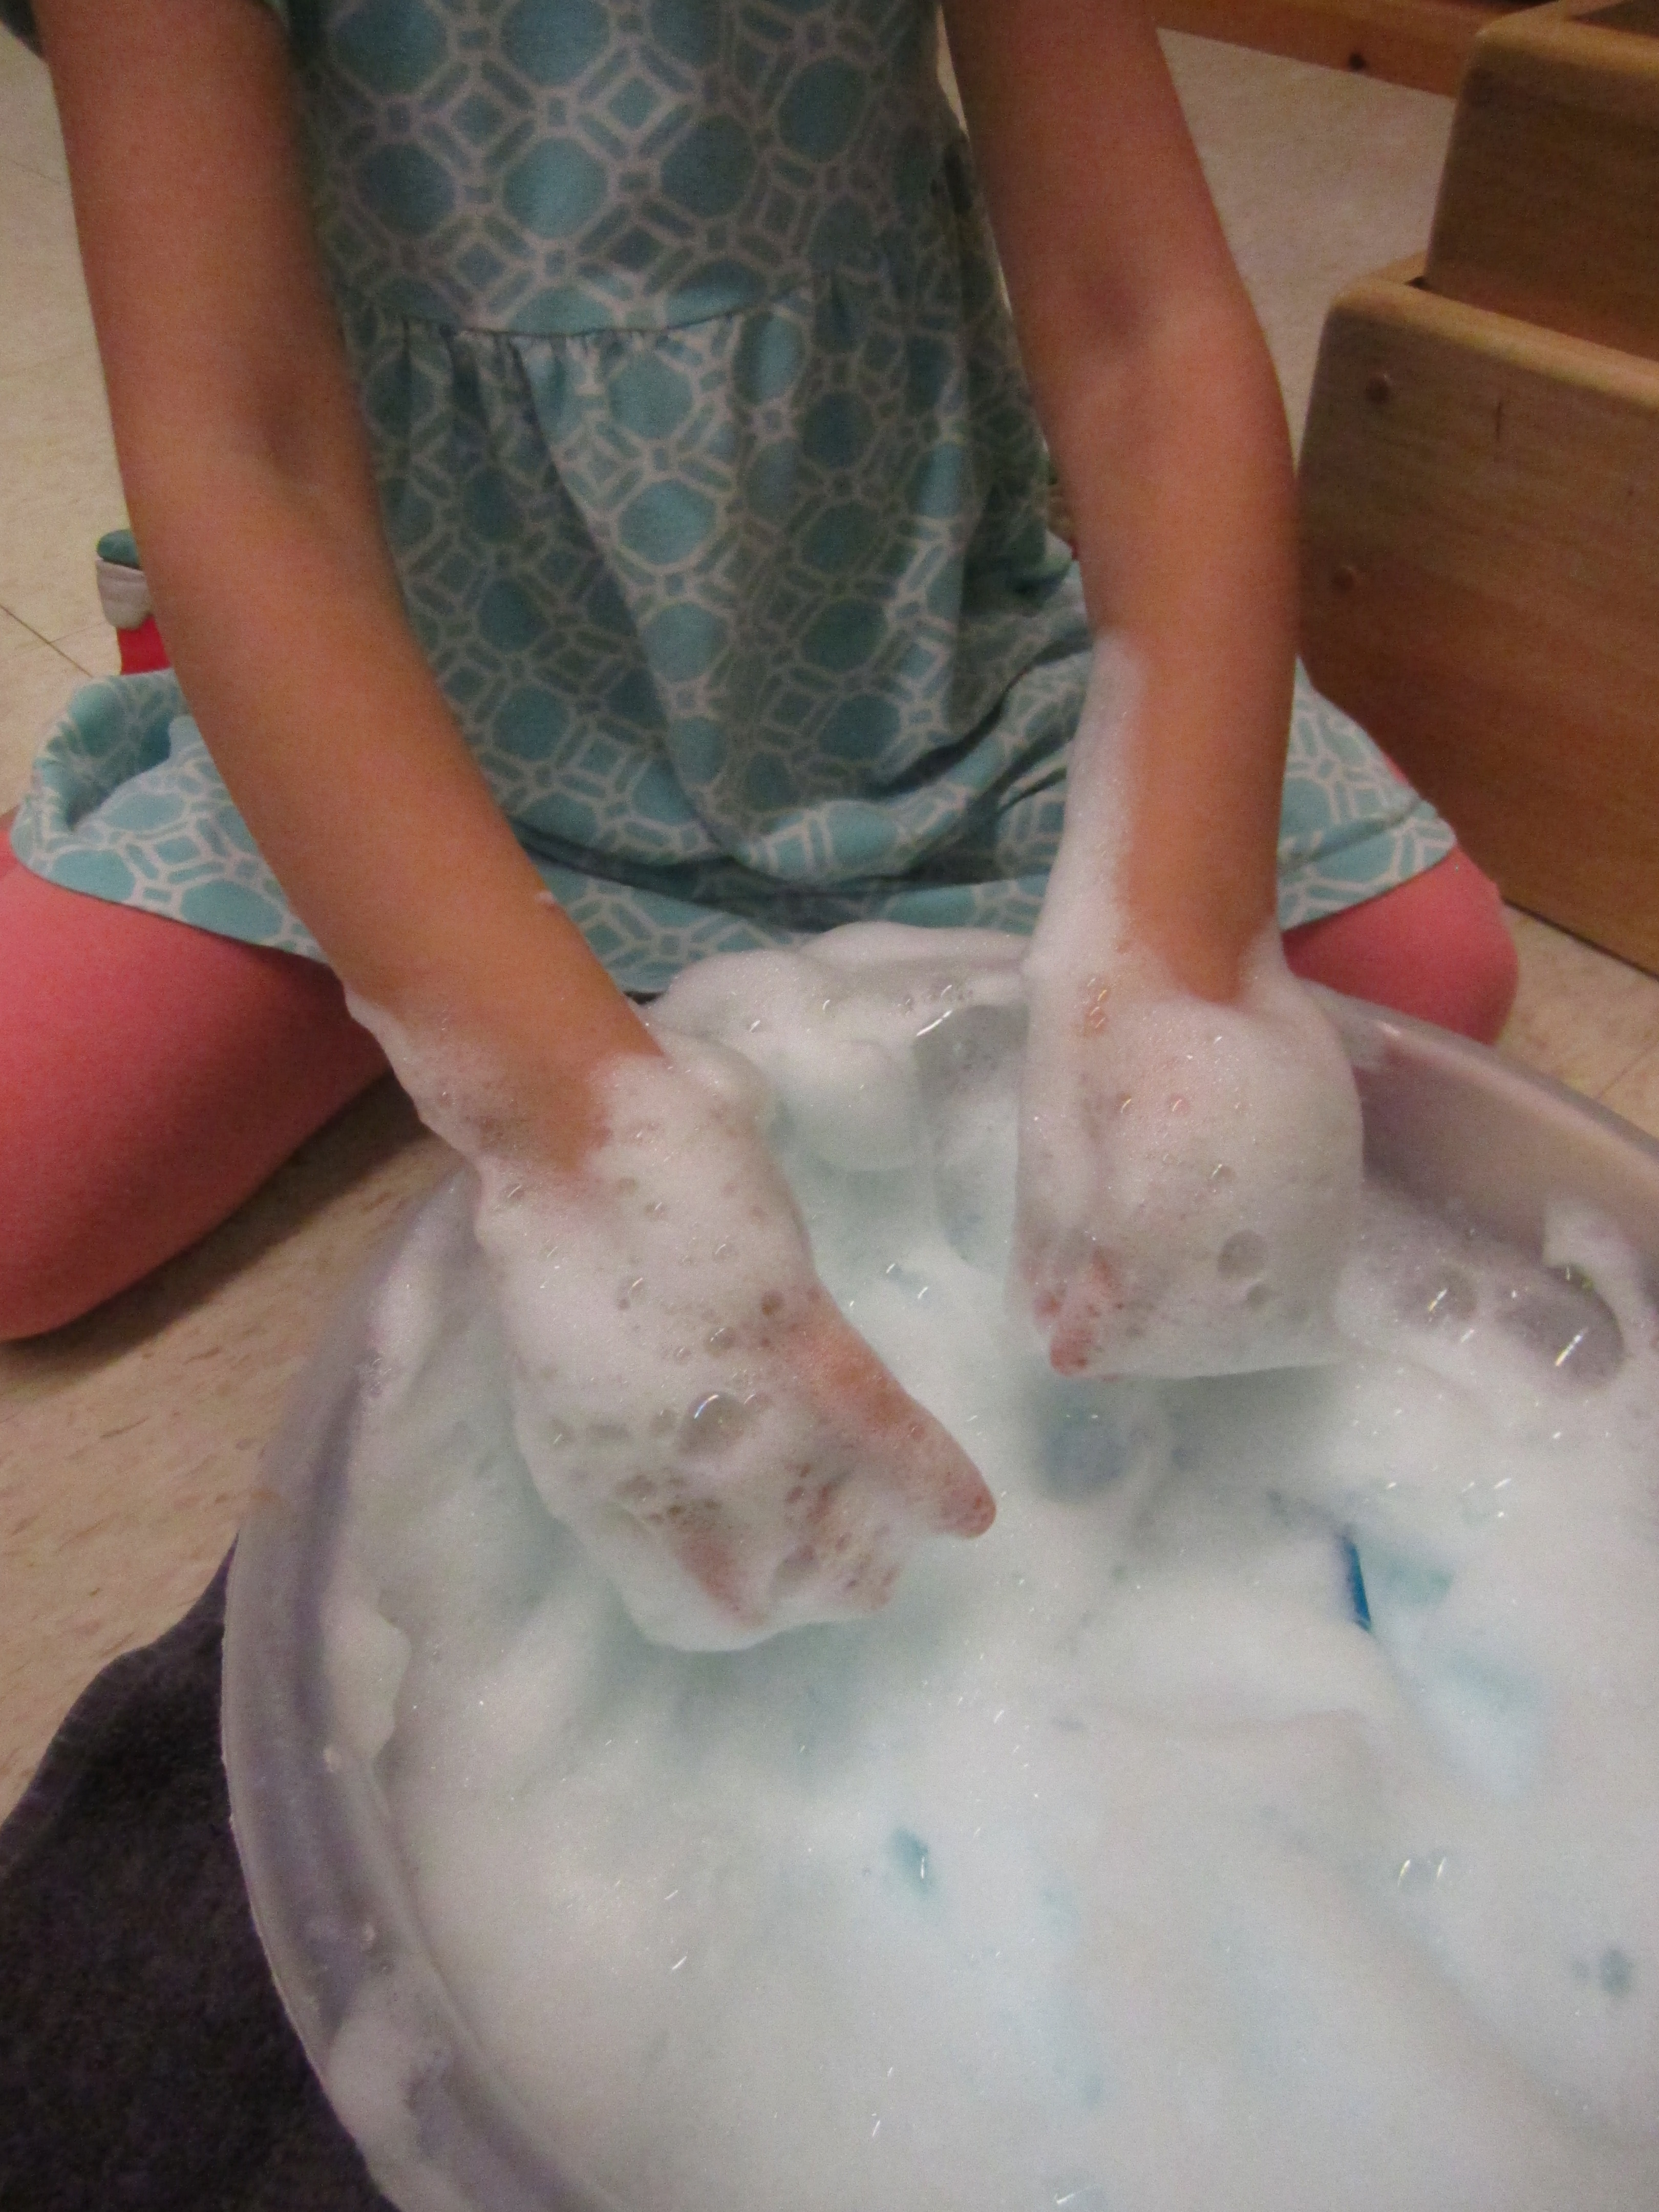
- Feeling dish soap bubble foam.
-
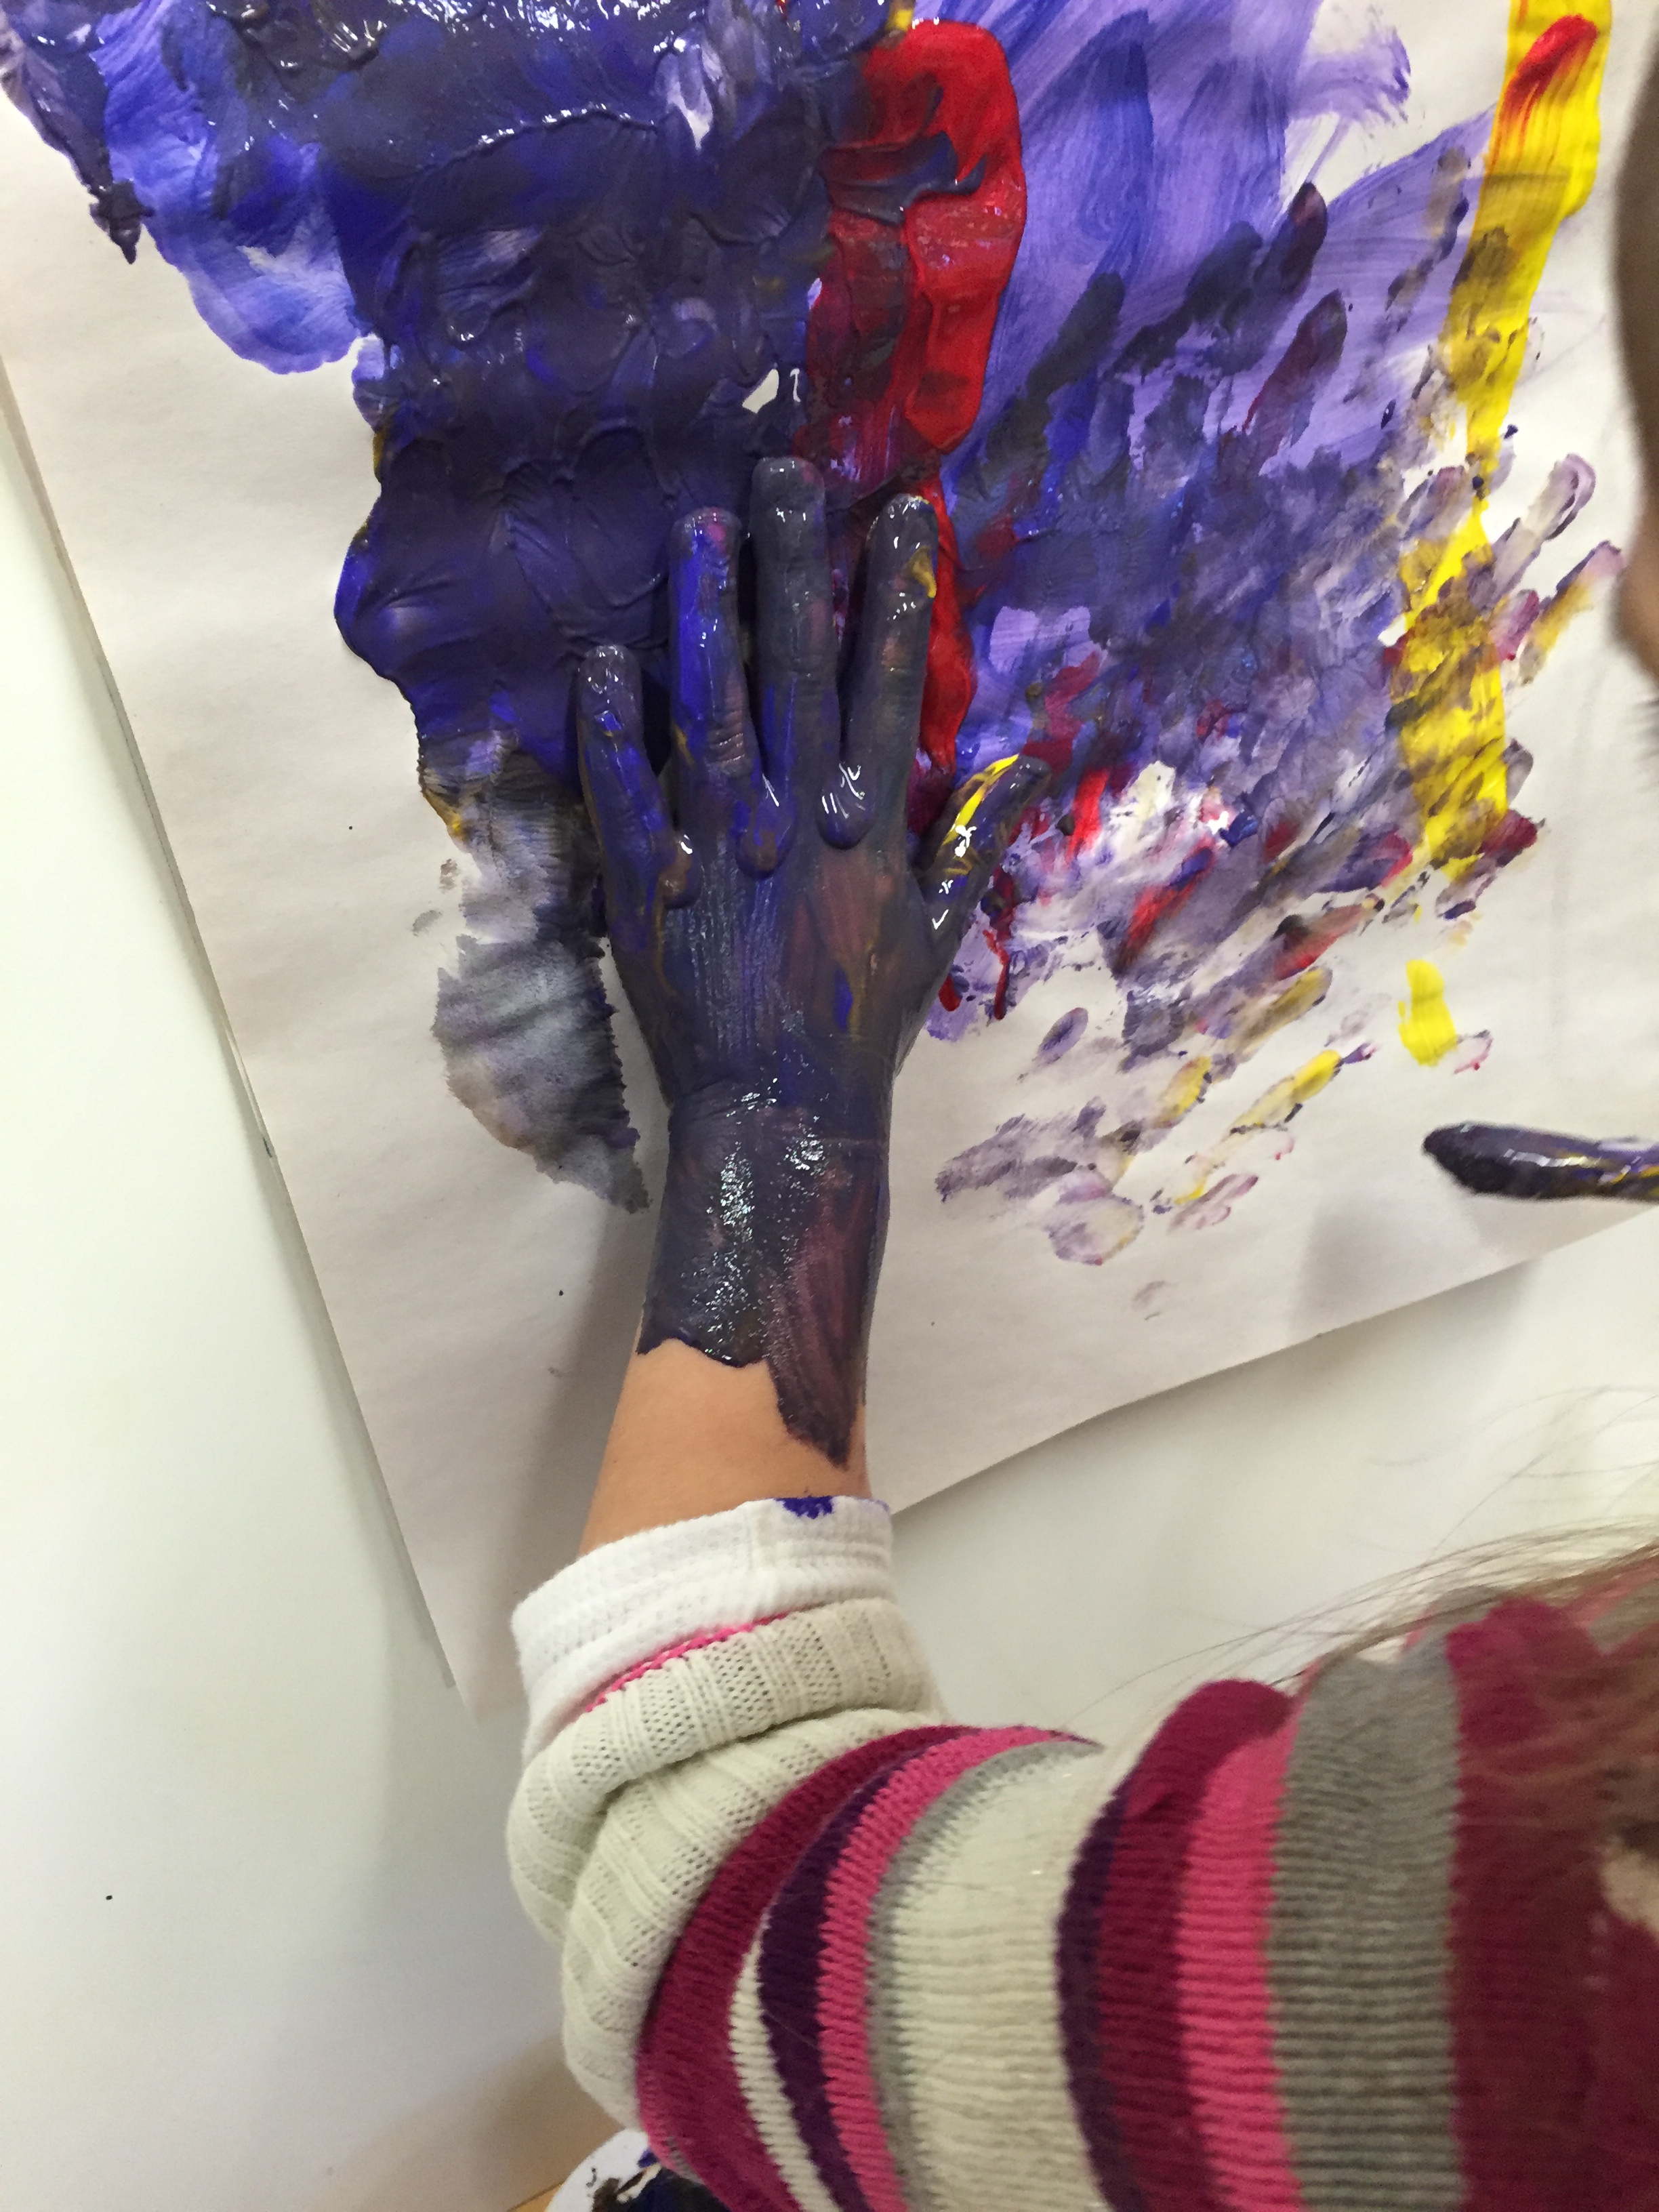
- Feeling tempera paint.
Debra Hunter gives examples of how children address multiple areas of development through play at the sensory table (2008), including cognitive and physical development. An intentionally designated space or time for planned messy experiences make it possible for both children and adults to linger with the experience and not feel stressed to end at a set time. Having fun at a sensory table engages children in exploring the properties of matter, developing fine motor skills, and developing a beginning understanding of measurement and volume, force, and motion. Working together to share tools or create a shared experience strengthens children’s oral language and social/emotional development. Experiences with sensory materials introduce new vocabulary such as “sticky” and “absorb.”

 A sensory play experience attracts different children depending on what material is provided. Just as some children are drawn to certain materials, others avoid them. “Children differ in their ability to process and respond to information from the environment while engaging in activities” (Thompson and Raisor). Sensory activities that support infant and toddler exploration require closer supervision but provide the same opportunities for learning about the world (Schwarz and Luckenbill). Extensions 25(5), the HighScope newsletter has three articles about sensory play: Look, Listen, Touch, Feel, Taste: The Importance of Sensory Play; Observing and Supporting the KDIs at the Sand and Water Table; and Providing Sensory Experiences That Meet the Needs of All Infants and Toddlers; that remind us that sensory play is “’food for the brain.’ Stimulating the senses sends signals to children’s brains that help to strengthen neural pathways important for all types of learning.”
-
- Sound and wetness.
-
- A sensory walk.
-
- Beginning the exploration
-
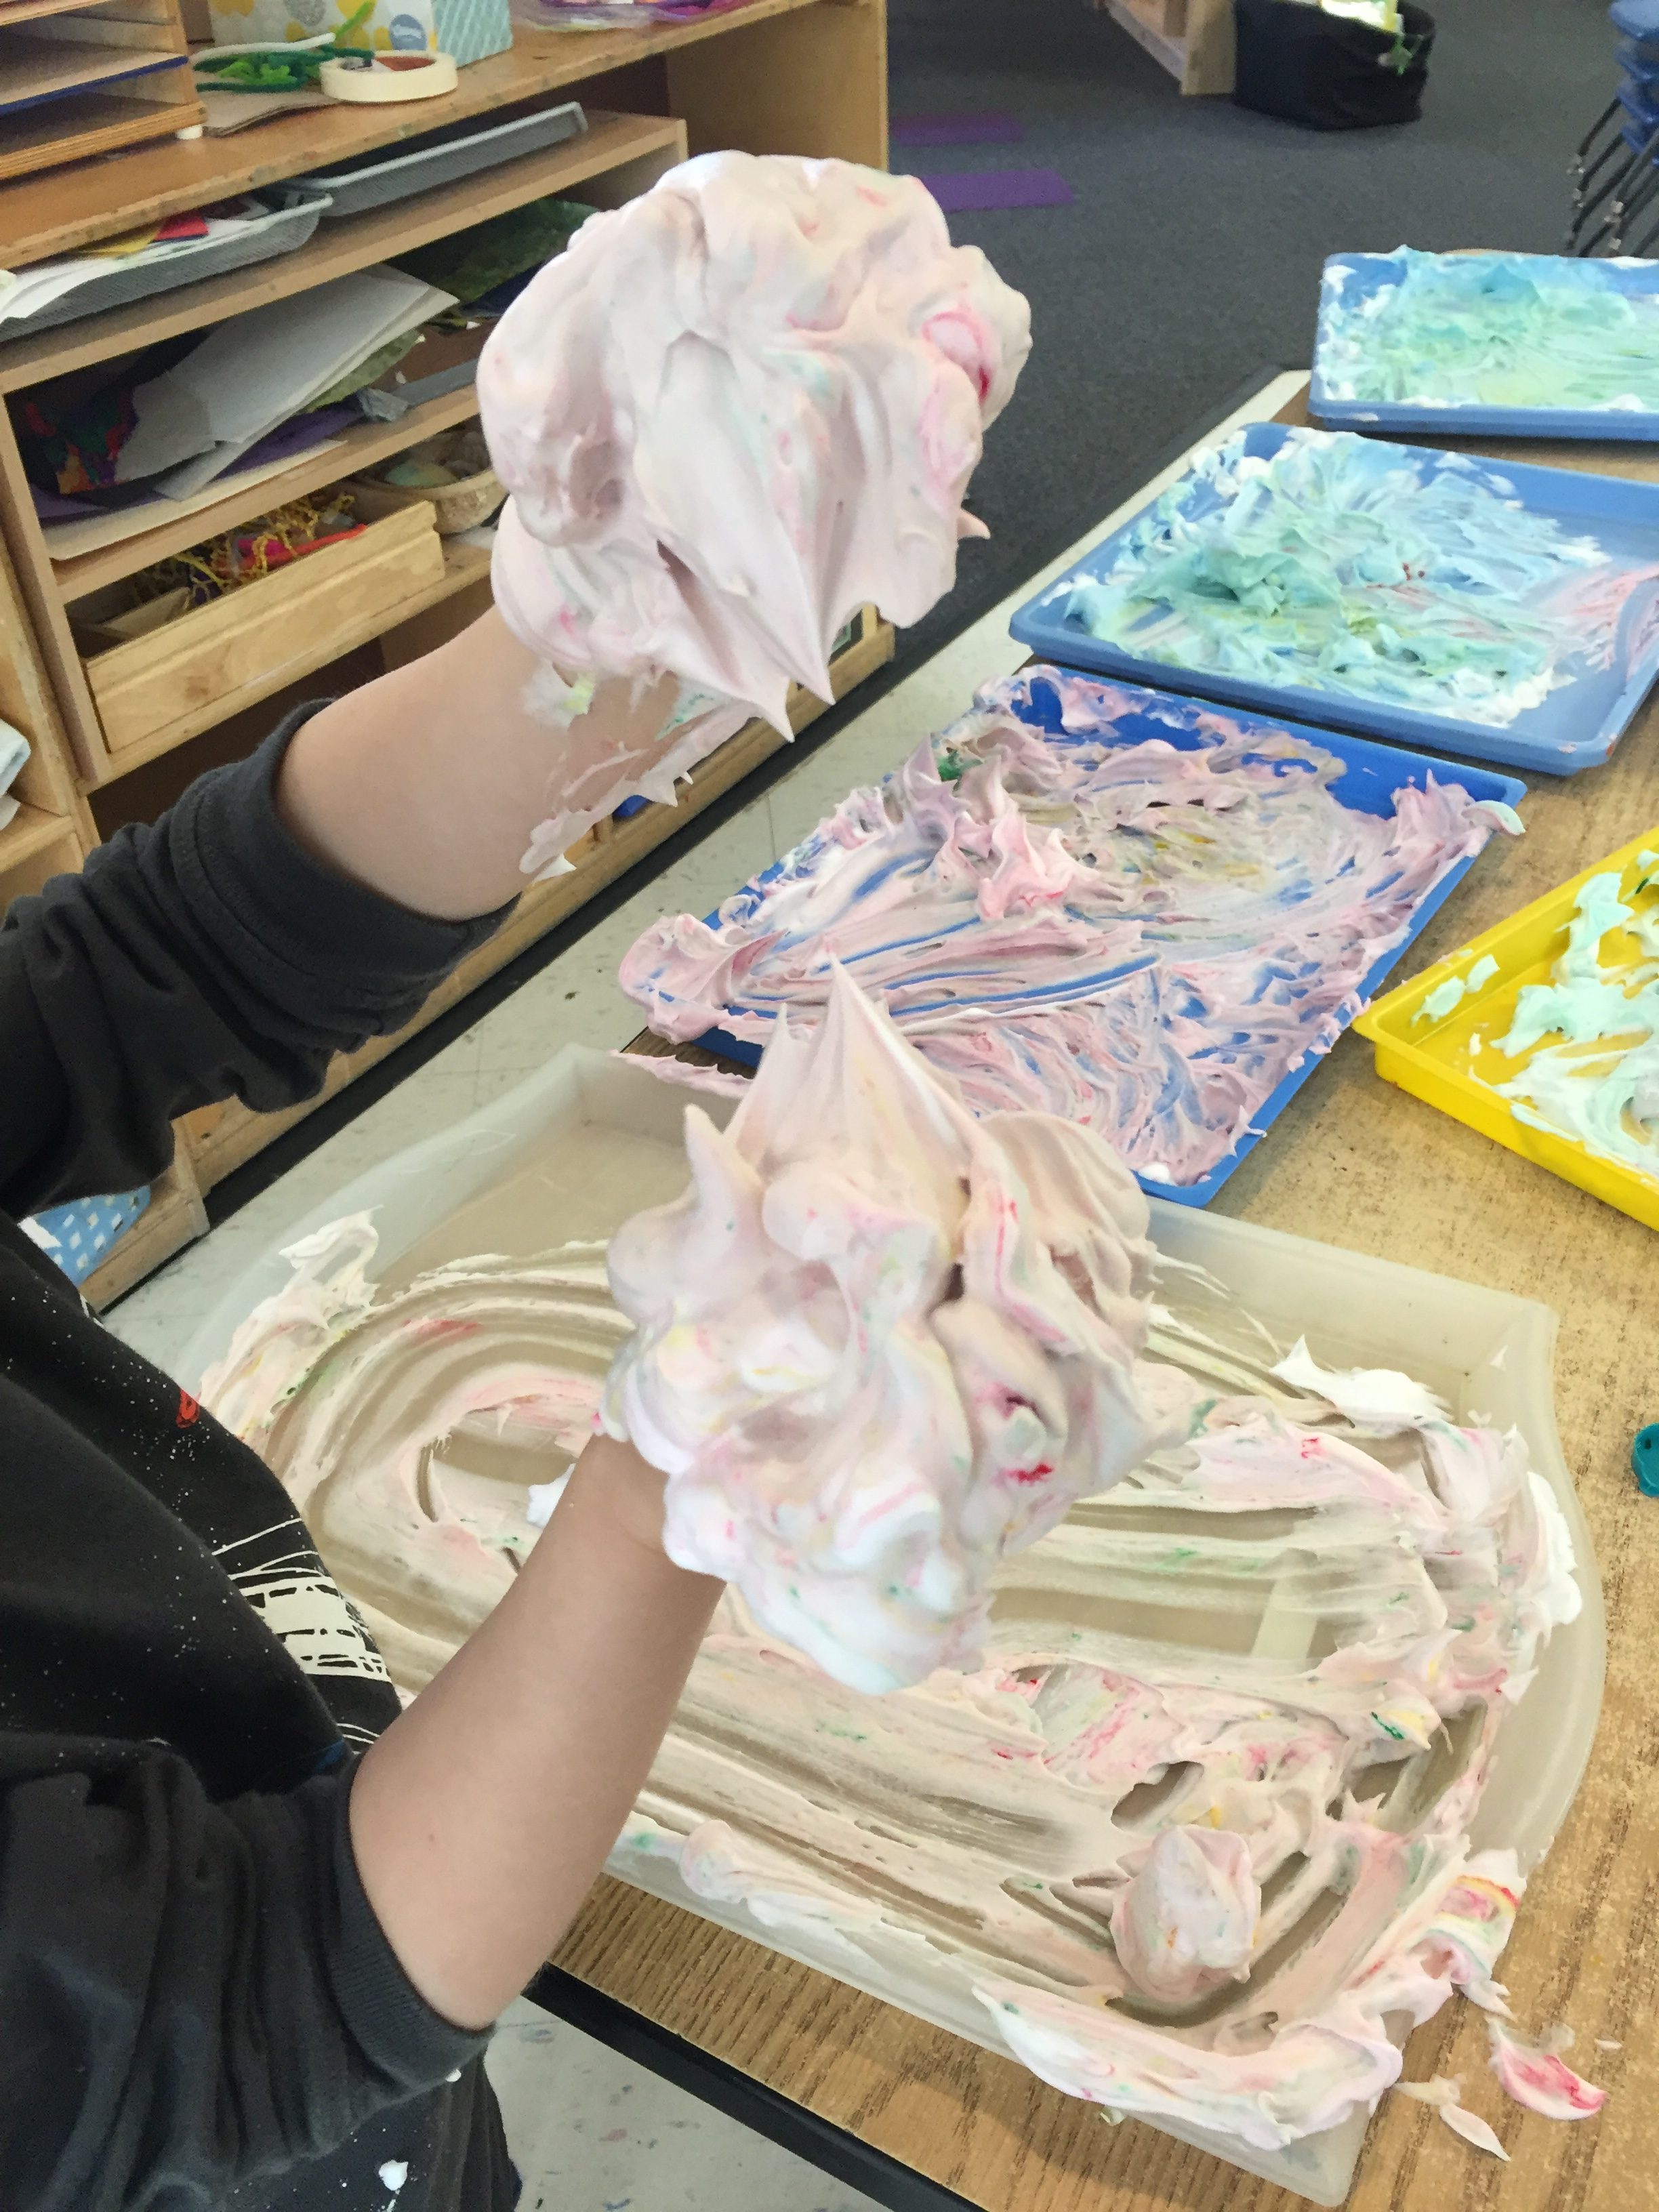
- Shaving cream paint.
-
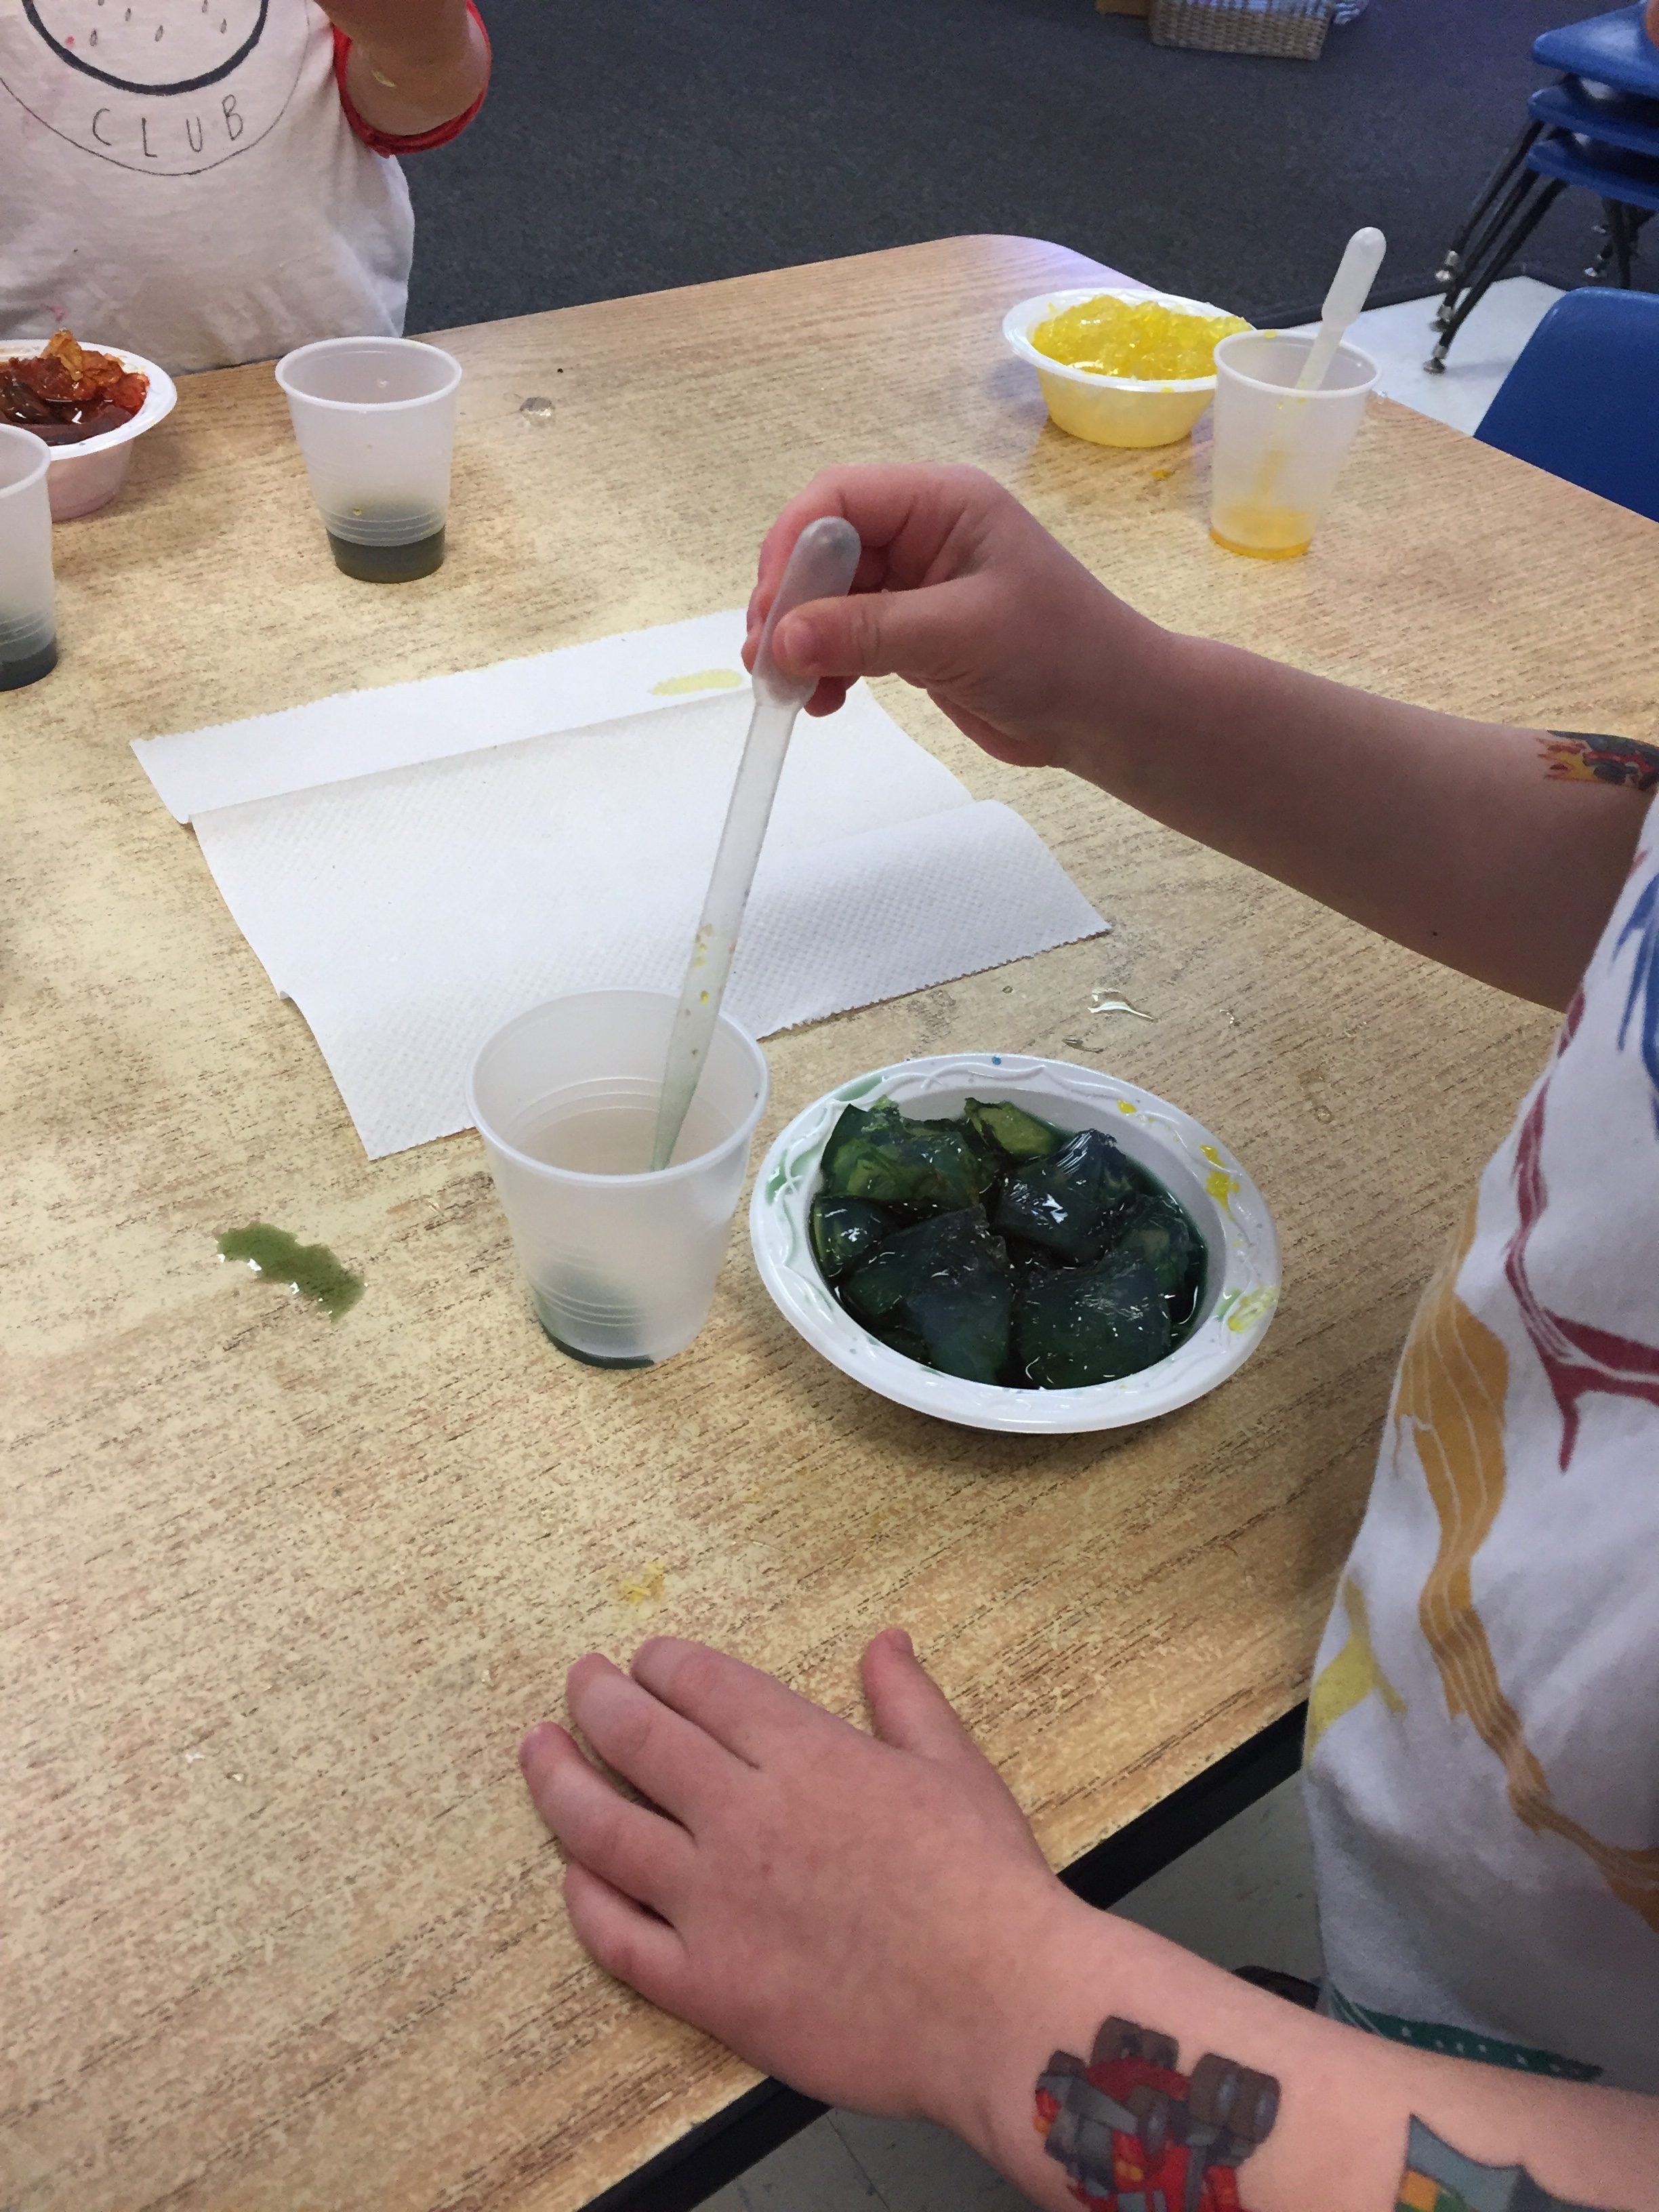
- First using a pipette to add color.
-
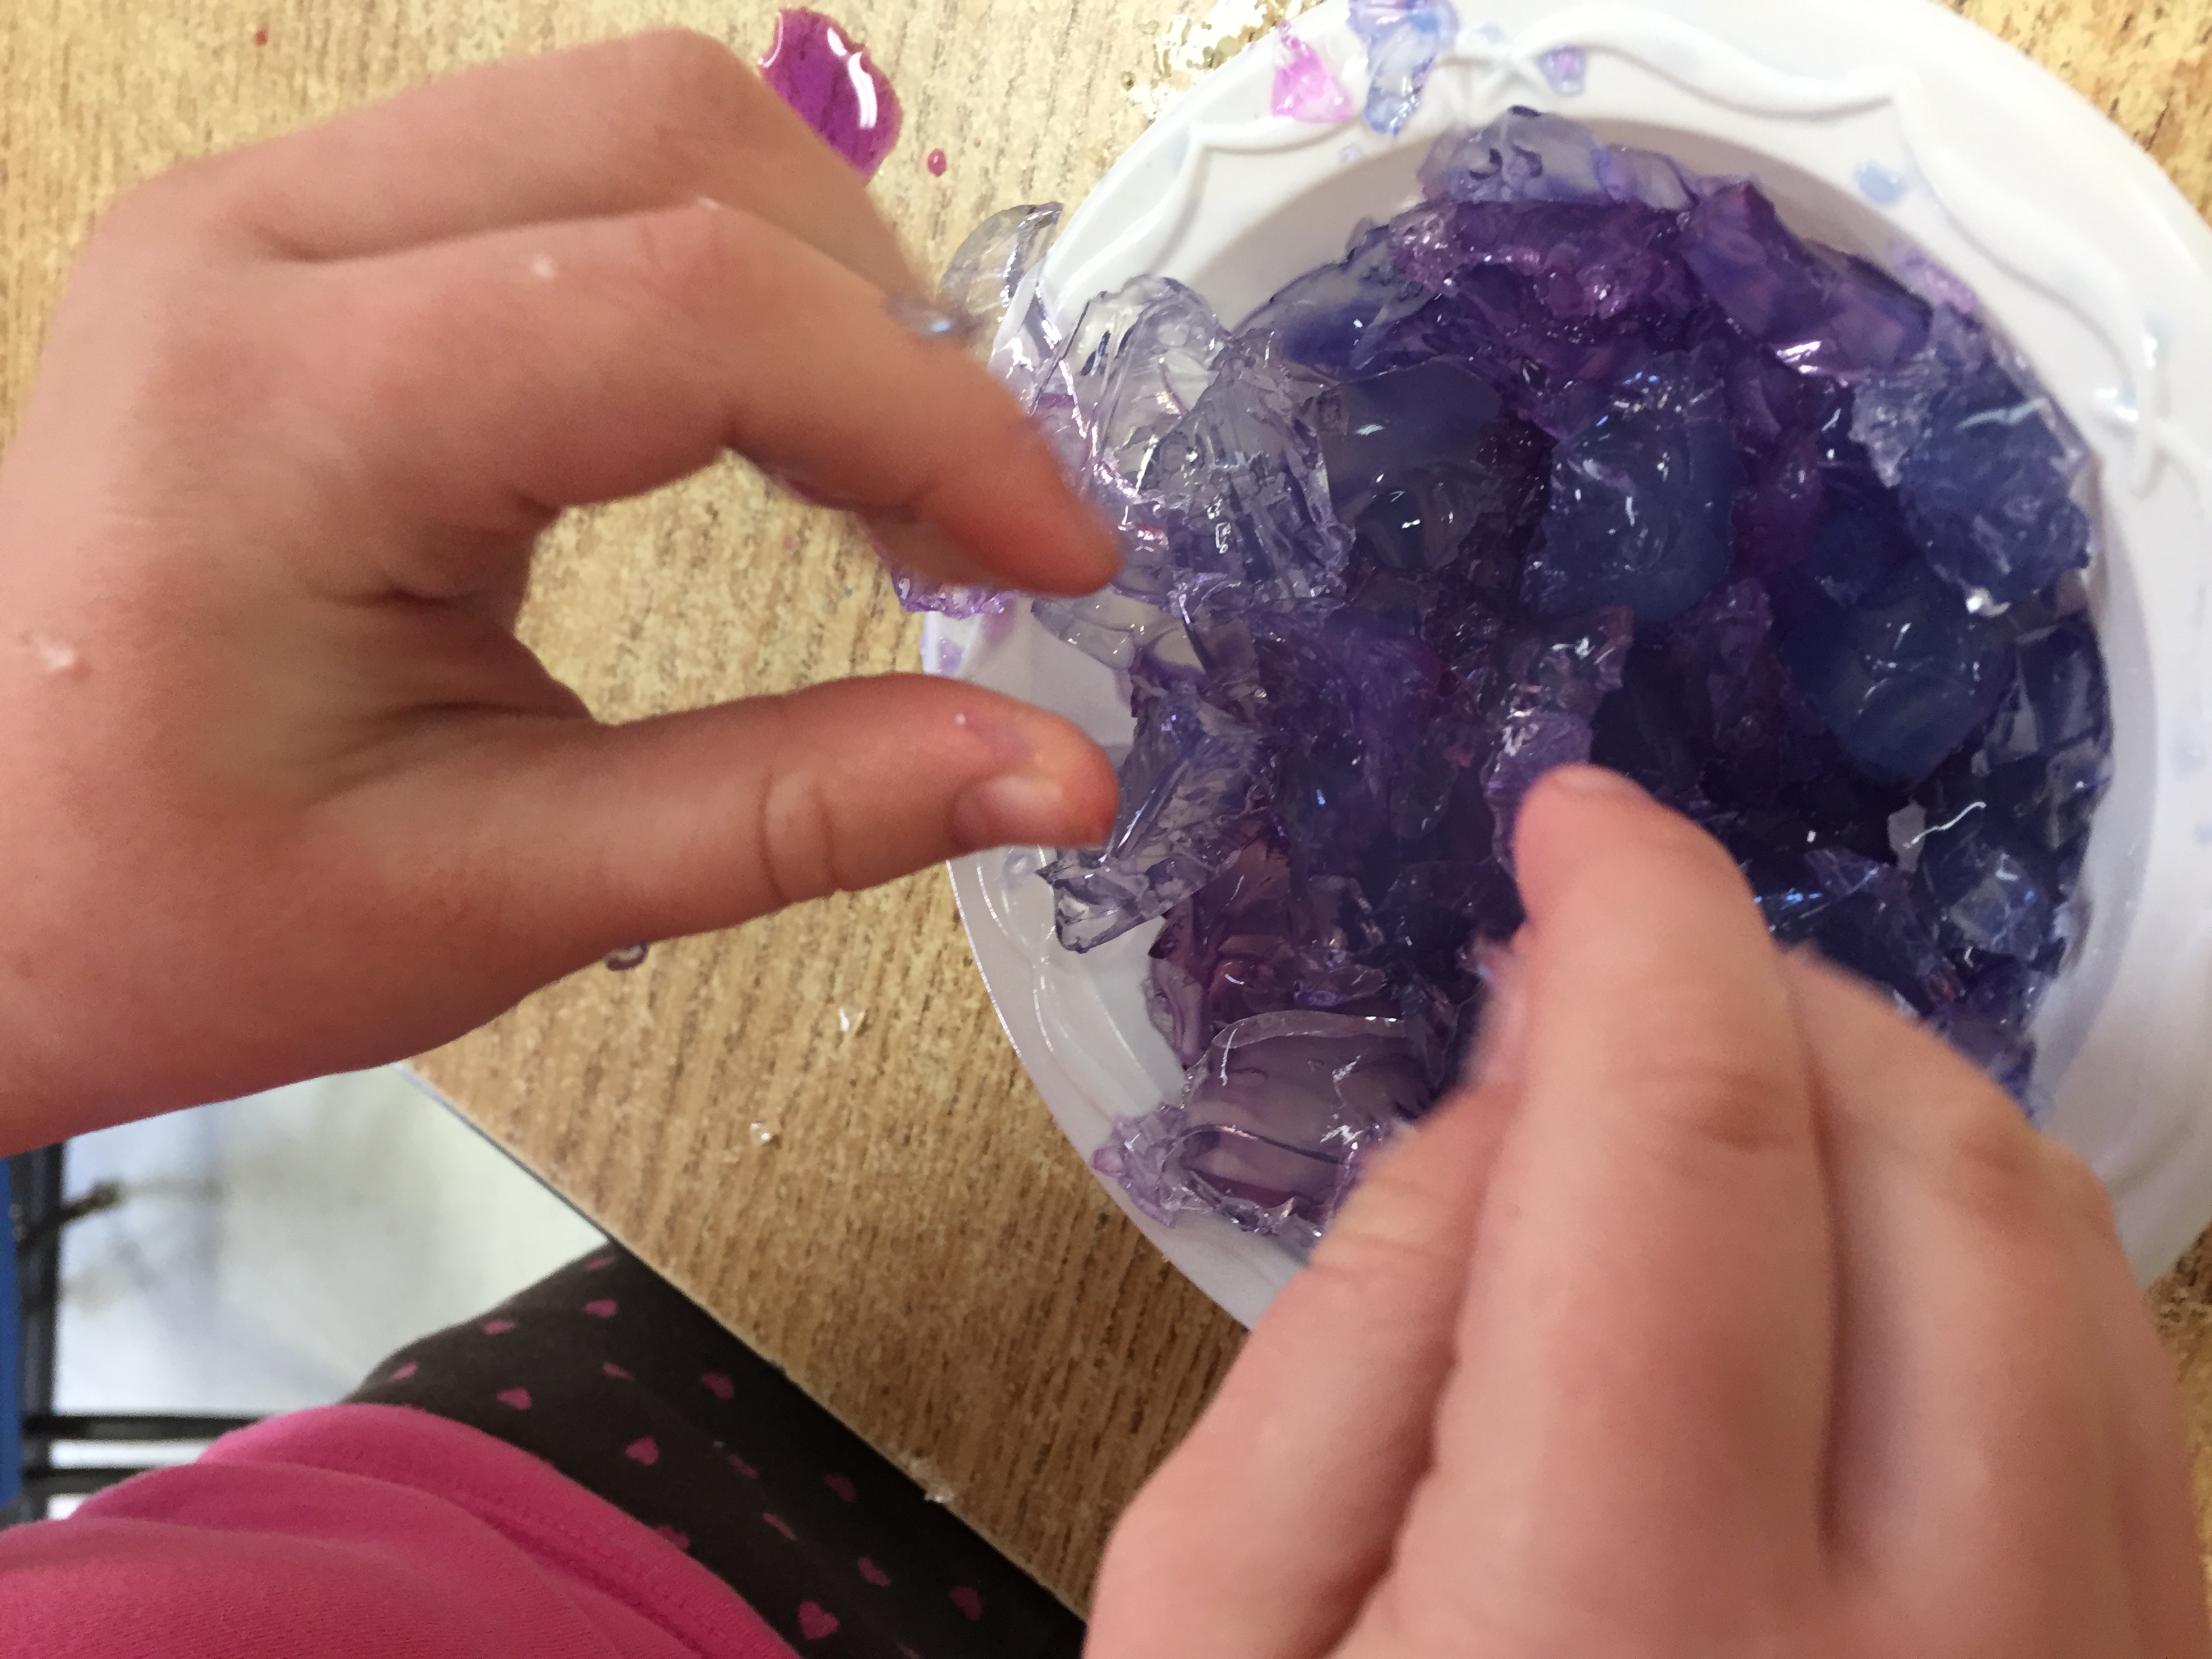
- Gelatin with liquid water colors.
Taking allergies and other safety concerns such as eye protection into consideration, and reflecting on the daily routine and available spaces, opens up possibilities for creative sensory learning experiences.
Boddy, Jessica. 2017. Are We Eating Our Fleece Jackets? Microfibers Are Migrating Into Field And Food. NPR. February 6, 2017, 1:21 PM ET
High Scope. 2011. Extensions newsletter. Volume 25 No. 5. https://highscope.org
Hunter, Debra. 2008. Teachers on Teaching: What Happens When a Child Plays at the Sensory Table? Young Children. 63(6): 77-79.
Schwarz, Trudi and Julia Luckenbill. 2015. Let’s Get Messy! Learning Through Art and Sensory Play in Spotlight on Young Children: Exploring Play. NAEYC. https://www.naeyc.org/resources/pubs/books
Thompson, Stacy D. and Jill M. Raisor. 2013. Individualizing in Early Childhood: The What, Why, and How of Differentiated Approaches: Meeting the Sensory Needs of Young Children. Young Children. 68(2): 34-43 https://issuu.com/naeyc/docs/meeting_sensory_needs_thompson_0513
Vanover, Sarah. The Importance of Sand and Water Play. National Association for the Education of Young Children blog. 7/18/2018 https://www.naeyc.org/resources/blog/importance-sand-and-water-play
Children and people of all ages continually explore and learn through their senses. Prior experiences that build understanding of how we use our senses to learn about the world are the foundation for understanding the Next Generation Science Standards Disciplinary Core Ideas.