
feature
It's Dark So Early!
Fifth-grade students use the practices of science to understand changing hours of daylight.
Science and Children—November/December 2020 (Volume 58, Issue 2)
By Carolyn S. Collins and Molly D. Perkins
Teaching in a Social Distancing World
The strength of this lesson sequence is the inherent focus on collaboration and communication. Students make sense of the world by bouncing ideas off each other, challenging each other, and building a joint understanding of the science behind the phenomena. Adapting this to a social distancing setting, while challenging, is possible. The light bulbs work well for providing all-around light, however strong LED flashlights could be used. If students work in pairs, one student can be responsible for the flashlight, and the other student the Earth model, mitigating the need for shared materials. A student pair can share ideas with another pair (from a safe distance).
For students learning at home, the greatest challenge will be finding an appropriate Earth model that will enable them to maintain the tilt while circling the Sun. Something like a tennis ball with an elastic band or line drawn around the middle to replicate the equator (helping students keep track of the tilt) might work. In this scenario, finding ways to support student collaboration and shared discussion will be critical.
“Wait—that wouldn’t work! Alaska would be light all year long…” students were enthusiastically offering and receiving critiques of their scientific explanations for why length of daylight varies throughout the year and in different locations on Earth. It was December and students had been talking about how dark it was at the end of the day compared to summer. It was a perfect time to engage students in an exploration to figure out why this happens.
This investigation was part of a larger unit exploring Earth’s relationship to the Sun, Moon, and other stars. Prior to this length of daylight investigation, students had already explored the causes of day and night (through modeling) and linked it to the changing position of the Sun over the course of a day (tracking shadows).
In this article we present a three-day sequence of lessons we taught to engage fifth-grade students in an exploration following the activities of scientists. From asking questions and analyzing data, to engaging in scientific modeling, to defending their theories to the scientific (classroom) community, these fifth graders were mirroring how scientists investigate the natural world.
Day 1: Why Does Location Affect Length of Daylight?
To launch students’ inquiry into why length of daylight varies over the course of the year, and to introduce the idea that hours of daylight change depending upon location, student curiosity was ignited through watching a time-lapse video from Finland. In a split-screen format, students watched synchronized videos, one taken during the heart of winter, and the other during the height of summer, that capture and compare daylight over a 24-hour period. The video demonstrates the huge range in length of daylight hours in the far north (see Internet Resources).
We began the three-day investigation by posing the question: Why is the length of daylight different at different times of the year? We divided the class into six groups of three or four students. Each group was given a data set of total hours of sunlight every two weeks for one year at a particular location. The data sets represented equally positioned locations in the northern and southern hemispheres [Barrow, AK 71°N; Quebec, CN 51°N; Dallas, TX 32°N; Santiago, Ch. 33°S; Falkland Islands, Arg. 51°S; McMurdo RB, Antarctica 71°S]. To facilitate comparison, we provided graph templates on 11 × 17 paper (for more about graphing, and how this can be used to support Common Core math standard 5.MD.B.2, see Creating Daylight Hour Graphs sidebar). Ms. Perkins and I prepared a seventh graph, for Quito, Ecuador, 0°. This graph is virtually a straight line and as such would have provided limited math practice for our students.
Once completed, the graphs were hung in order from north to south with Quito, Ecuador, in the center. Ms. Perkins posed the question, What do you notice about the graphs? To support student participation and scaffold the discussion, students first discussed the question with their group. Talking with a partner or small group prior to the whole-group discussion gave students an opportunity to “rehearse” their responses. This is particularly helpful for ELL students and quieter, more reluctant participants. Providing them with an opportunity to articulate their ideas in a smaller setting gives students greater confidence, maximizes participation, focuses attention, and supports student understanding of the material (Worth et al. 2009; Shea and Shanahan 2011).
During the class discussion that followed, students quickly noted how the range decreases as locations get closer and closer to the equator. “I notice that when we go from left to right the graphs go like a rollercoaster, really steep, and then we get to Ecuador, practically flat, then bumpy again.” Students were amazed to see that both Barrow, Alaska, and McMurdo Research Base in Antarctica experience weeks of 24 hours of light and, similarly, weeks of zero hours of daylight. The slope of these two graphs, with the range going from zero hours to 24 hours of daylight, is dramatic. As the locations move closer to the equator, students noticed that the range got smaller and the slope flatter, until the graph for Ecuador was virtually a straight line, the range only changing by a quarter of an hour.
“They’re like opposites of each other,” one student commented. “Yeah,” replied another, noting the inverse relationship between locations at similar latitudes in the northern and southern hemispheres. “I noticed that Alaska and Antarctica seem to be the opposites. In June it doesn’t get dark in Alaska, but it stays dark in Antarctica. Then it switches. In December it is dark all the time in Alaska, but light all the time in Antarctica.” Multiple students commented on the symmetry of the graphs, “When there is more light in Dallas, it is darker in Santiago.”
The students were able to lead the discussion; some facilitating questions we had prepared included, What is happening to the length of day as we move from January to June? What happens around the end of December? How does the length of daylight change as you move further away from the equator? What do you notice about locations at similar latitudes, but different hemispheres (i.e. Quebec/Falklands; Dallas/Santiago)?
As the conversation about the graphs wrapped up, we shared that scientists often have to refine their investigation questions based on new information. We engaged the students in a process of refining our guiding question. Together we co-constructed a more accurate question: Why does location affect the length of daylight over a year?
We concluded the first day by asking students to write down their initial impressions and ideas about the data and our guiding question in their science notebooks (Figure 1).
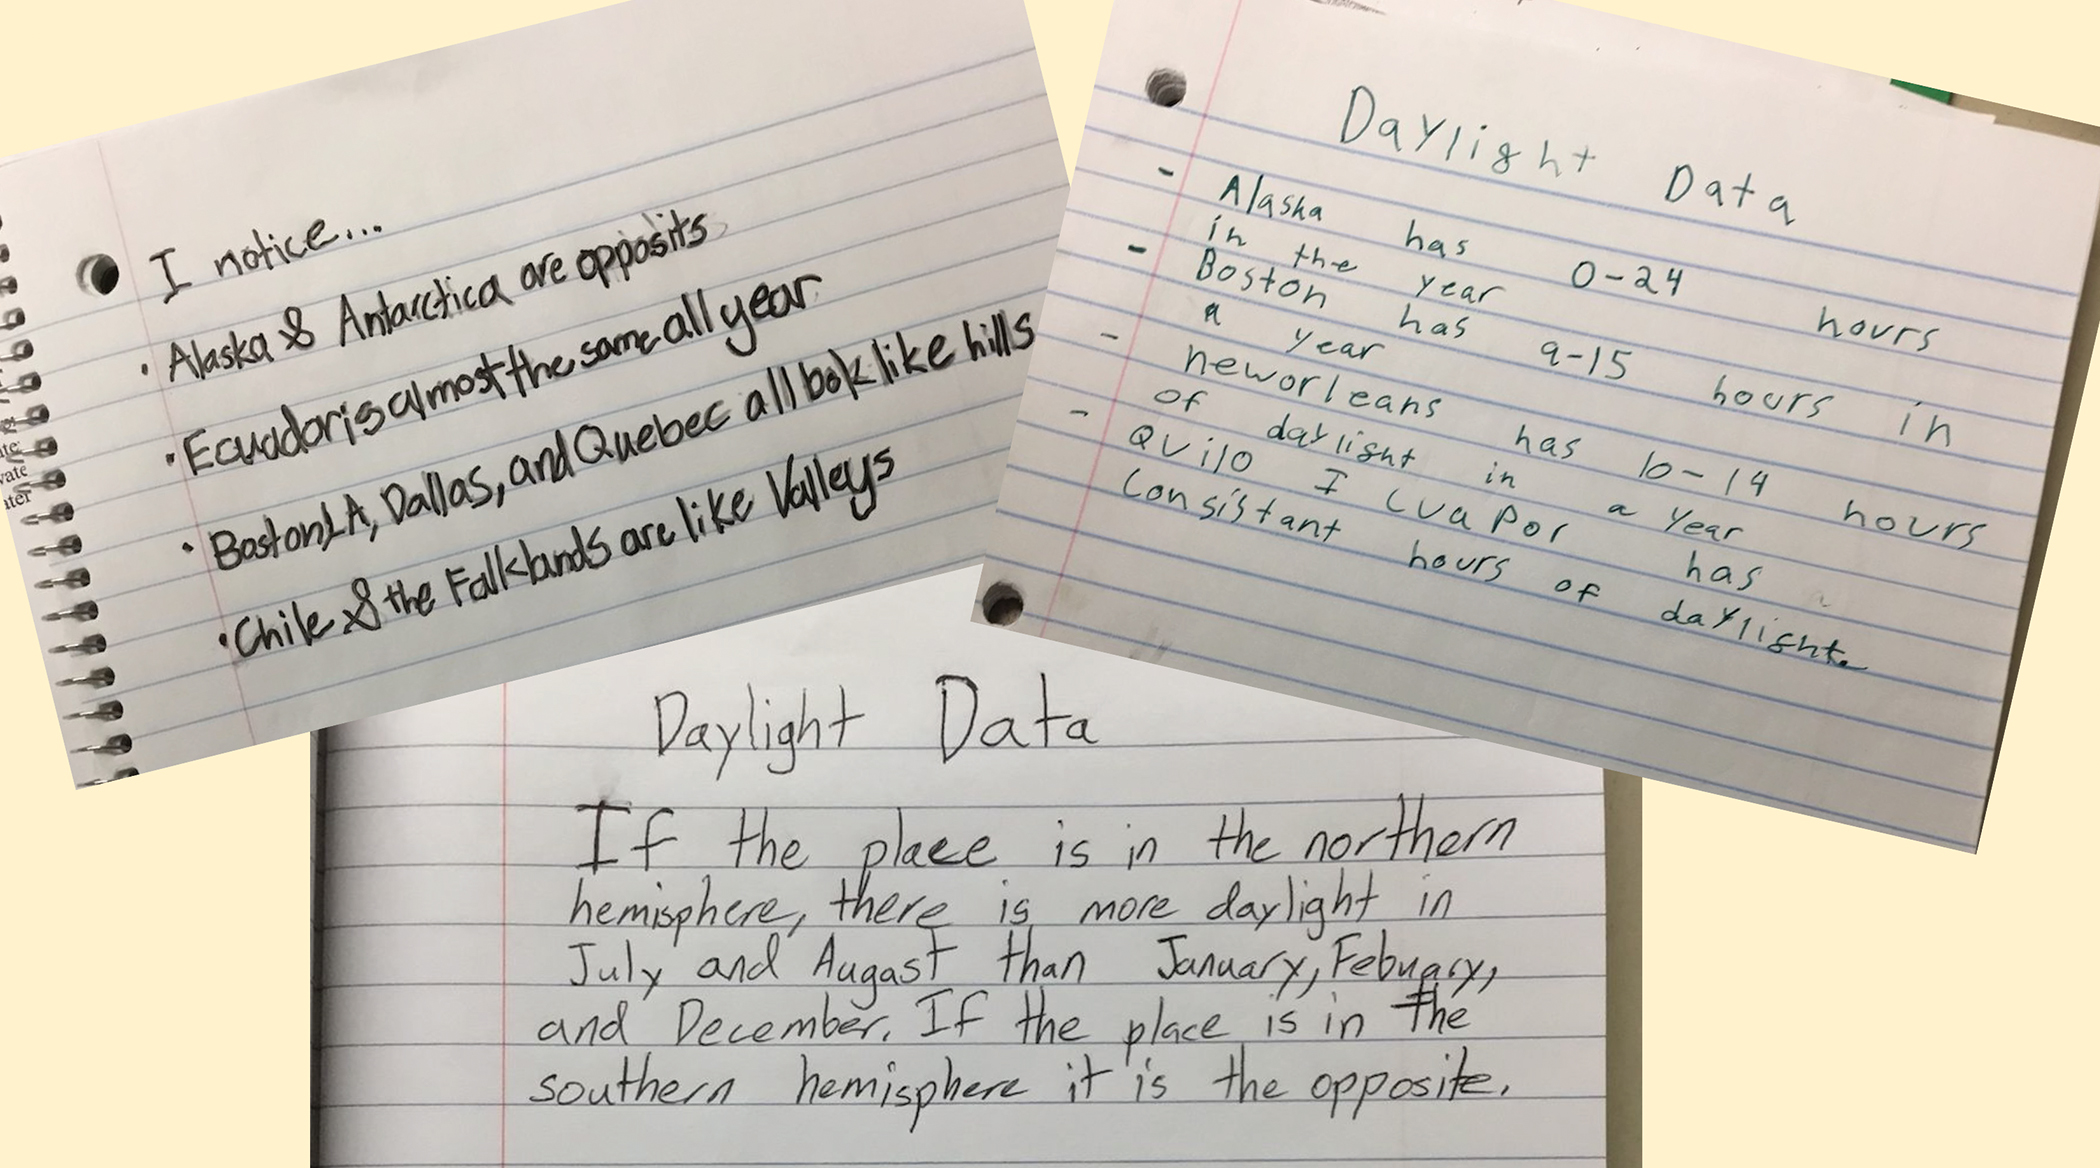
Student notebook comments.
Day 2: Developing a Scientific Model To Explain Data
The work of scientists is to understand how our world works by making sense of natural phenomena through engaging in a variety of activities. Thus, we began the second day by making explicit how the students’ work mirrored the work of scientists (Figure 2).
Practices of scientists.
A goal of the Next Generation Science Standards (NGSS) is for students to access content through engaging in the activities of scientists: “...students cannot fully understand scientific and engineering ideas without engaging in the practices of inquiry and the discourses by which such ideas are developed and refined” (NGSS Lead States 2013, p. 218).
During this multi-day exploration, students follow the steps scientists go through when investigating the natural world:
- Ask a question to be investigated
- Gather data
- Analyze the data
- Use the data to propose a possible explanation (hypothesis)
- Develop a model and test to see if it matches the data
- If the model matches the data and can be used to predict future events, use it to construct an answer to the question (theory)
- Present and defend the theory to the scientific community
We reviewed the steps they had already taken the first day:
Ask a question to be investigated (SEP: Asking Questions): What’s our question? Why does location affect the length of daylight over a year?
Next, scientists gather data: What data did we look at? Length of daylight at seven locations across the globe and analyze the data (SEP: Analyzing and Interpreting Data): What did we discover?
Students recapped the discussion from the previous day, including the differences between northern and southern hemispheres and the shape of the graphs.
Scientists then use the data to propose a possible explanation (SEP: Constructing Explanations): What initial ideas did you write in your science notebook yesterday?
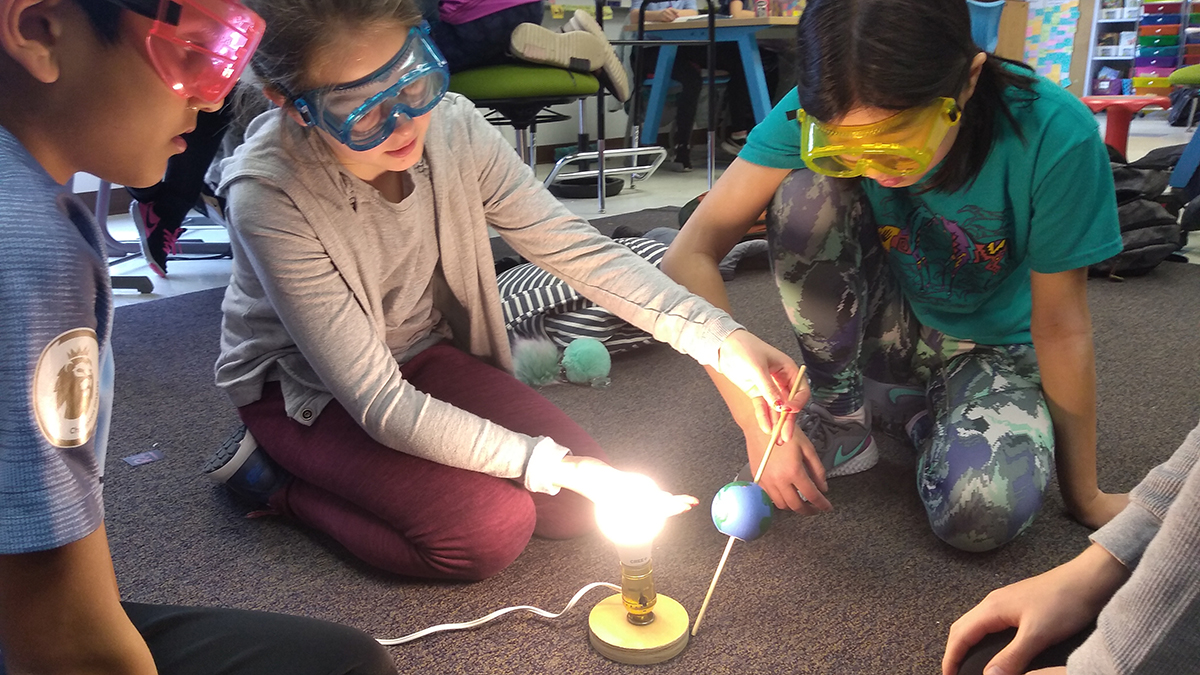
This led us to the next stage in scientific inquiry: developing a model and testing it to see if it matches the data (SEP: Developing and Using Models). Reminding them of work they had already done explaining day and night, we provided students with a light bulb (the Sun) and a small globe on a stick (Earth) (Figure 3). We challenged them to use the materials to figure out why parts of the Earth experience different amounts of daylight. Using LED bulbs reduces the chances for burns as the bulbs do not get hot. Students should wear safety goggles.
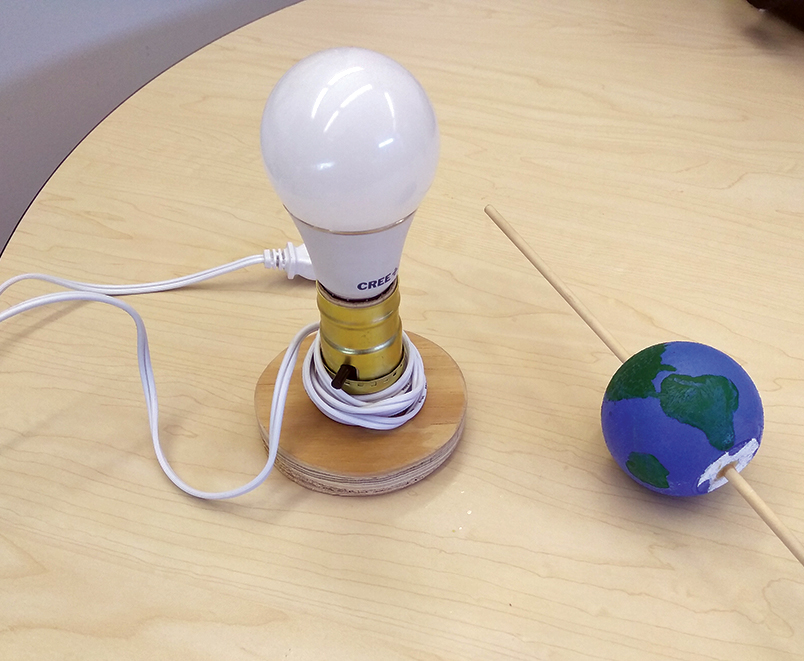
Earth and Sun models.
Since our objective was to engage students in the practice of scientific modeling—having them develop a model which would explain the data—and knowing they would be exploring the Earth/Sun relationship in more detail in sixth grade, we decided to frontload certain background information. We reviewed that Earth rotates on its axis every 24 hours causing day and night, and that Earth revolves around the Sun each year (365 ¼ days). We then explained that the Earth is tilted in relation to the Sun and the degree of tilt stays constant; it revolves around the Sun at an angle. This later piece is critical to making sense of changing length of daylight.
“Our Earth doesn’t wobble back and forth like that! This can’t be the way it works.” Student teams grappled with understanding why the graphs looked so different. As the students worked, Ms. Perkins and I checked in with groups, making sure students understood their end goal was to develop a physical model that would show why Alaska is dark in December while the McMurdo Research Station is always light; why the length of daylight changes over the course of the year in Quebec; or why the length of daylight is different in Dallas than in Quebec. As we circulated, we checked that students were holding their Earth stick at about a 23° angle. We asked groups open questions to get them thinking but avoided giving groups too much guidance. We wanted students to be engaging in productive struggle.
A typical student error we found was students maintaining the tilt by keeping a pole consistently pointed toward the Sun. Rather than correcting them we’d ask,
“Hmm, does that match our data?”
“In your model it looks like Barrow, Alaska, is always getting light.”
“What about December in Antarctica? Shouldn’t it get light?”
As we wrapped up the day’s work, we let students know that during the next class they would have a chance to review their work before presenting their model and their explanations to the class (Kenyon, Schwartz, and Hug 2008).
Day 3: Presenting Explanations to the Scientific Community
To start day 3, we gave the student teams an opportunity to revisit their models of the Sun/Earth interaction. We explained that scientists test their models, and that to be effective, a model must do two things:
- match the data
- be able to predict future events: Can you use your model to anticipate what will happen next? For example, could your model be used to get an idea of how long days might be in another location, perhaps half way between Alaska and Quebec?
As teams prepared to share their models with the class, we reminded them of our guiding question: Why does location affect the length of daylight over a year?
Once students had revisited their models and practiced their explanations (SEP: Constructing Explanations), we gathered the class in a circle to share and critique each other’s models (SEP: Engaging in Argument From Evidence). This discussion structure was familiar to students; they are accustomed to engaging in academic discourse across curricular areas, in ELA, science, and mathematics. Class norms for discussion were already established.
Through the conversation, students demonstrated understanding that:
Since the Earth is tilted in relation to the Sun, when the North Pole is pointed toward the Sun, the South Pole is tipped away (June). Six months later this is reversed: The South Pole is oriented to the Sun, and the North Pole is tipped away (December).
The angle at which the Sun’s rays hit Earth’s surface is what determines how much Sun the location gets. Locations pointing toward the Sun get more direct light than locations pointing away from the Sun.
In an effort to probe and push student thinking, we posed the question, What if our Earth didn’t tilt on its axis? What would happen then? The ensuing conversation was active and exciting as students realized no tilt would mean no changing length of daylight and, consequently, no seasons. One student exclaimed, “Oh, I know! We wouldn’t have any seasons at all.” When Ms. Perkins prompted the student to say more, the student jumped up to model it. Holding the Earth stick vertically, the student moved around the bulb. “See, if you look at the way the Sun’s light is hitting the Earth, it doesn’t change at any point in the year. The Sun hits the equator the same, but it looks like Alaska and Antarctica both would get just a little bit of light.” Another student quickly chimed in, “Right! I guess the farther north or south you would be winter all the time, and the equator would be summer, but I wonder where it would be like fall or spring all the time?”
During our conversations with students we avoided saying, the North Pole is further away from the Sun, emphasizing the tilt (tipping away). A common misconception (also held by many adults) is that we experience winter because we are further away from the Sun. As part of our elaboration, we shared that the changing angle of sunlight striking Earth, and the changing hours of daylight, explains our seasons. When the sunlight is more direct, we get more light, which generates more heat. Students are surprised to learn that, contrary to popular belief, we are not closer to the Sun in summer than in winter.
Creating Daylight Hour Graphs
Given limitations of time, we provided data sets and graph templates to the students. Students could also collect data and create graphs on their own, providing an opportunity to address math standard CCSS.MATH.CONTENT.5.MD.B.2 Represent and interpret data.
To gather the data themselves, students can generate monthly calendars that include hours of daylight for each city (see Internet Resources). The US Navy Observatory website (Internet Resources) allows you to generate a full year’s worth of data. This saves time, however at the time of writing, the site was undergoing maintenance. The expected completion of the work and the estimated return of service is Fall 2020, subject to change due to potential impacts of COVID-19.
It is not necessary to graph 365 data points. Instead, students can select one day of the week to graph (e.g., Mondays) and gather the data from alternating weeks. This will provide 26–27 pieces of data, sufficient for this activity.
The data includes the length of daylight (sunrise to sunset) as hours: minutes i.e., 12:19 = 12 hours, 19 minutes. You can either discuss how to round the numbers (remembering that there are 60 minutes in an hour, so the halfway point for rounding is 30 minutes, not 50), or you can have students convert hours into minutes. An hours to minutes conversion chart is included.
Note on Using Graph Templates
To facilitate comparison, we provided students with graph templates on 11 × 17 paper. If you have students create their own graphs in lieu of using the template, it is important to ensure all groups use the same unit, scale, and range on their graphs so students can accurately compare the graphs.
Hours to Minutes Conversion Table
|
Hours |
Minutes |
Hours |
Minutes |
|
|
1 |
60 |
13 |
780 |
|
|
2 |
120 |
14 |
840 |
|
|
3 |
180 |
15 |
900 |
|
|
4 |
240 |
16 |
960 |
|
|
5 |
300 |
17 |
1020 |
|
|
6 |
360 |
18 |
1080 |
|
|
7 |
420 |
19 |
1140 |
|
|
8 |
480 |
20 |
1200 |
|
|
9 |
540 |
21 |
1260 |
|
|
10 |
600 |
22 |
1320 |
|
|
11 |
660 |
23 |
1382 |
|
|
12 |
720 |
24 |
1440 |
Summing It All Up
To wrap up, we reviewed the process they had gone through to study the length of daylight on Earth:
- Ask a question to be investigated
- Gather data
- Analyze the data
- Use the data to propose a possible explanation (hypothesis)
- Develop a model and test to see if it matches the data
- If the model matches the data and can be used to predict future events, use it to construct an answer to the question (theory)
- Present and defend their theory to the scientific community
As homework, students completed two journal entries:
When a scientist notices and wonders about some natural phenomena, what are some of the things she might do to figure out the answer? How did our study of length of daylight mirror the actions of scientists?
In your own words, describe why Alaska gets no light in the wintertime, while Quito Ecuador gets (roughly) the same amount of light all year.
Using a rubric (see NSTA Connection), we used their responses as a formative assessment to determine what misconceptions remained and to help us determine next steps. We have found some students continue to hold on to the misconception that temperatures, and thereby seasons, are influenced by the Earth’s elliptical orbit—we are warmer at particular times because we are closer to the Sun. To address this, we have taken students out to a field and modeled the relative size and distances between the Sun and Earth, drawing students’ attention to the magnitude of the distance and the relatively minor change in distance created by the elliptical orbit (see Internet Resources). Another possible extension is to have students investigate changes in the temperature of a piece of black paper when the angle of a beam of light shining on it changes.
All in all, this three-day series of lessons proved to be a highly successful learning experience for students as they actively engaged in multiple NGSS science practices throughout the exploration. Not only were they able to experience the process of asking a scientific question and analyzing data, they used scientific modeling as a strategy for making meaning as students determined the explanation of the phenomena for themselves. The modeling aspect, in particular, was powerful for the students. They were able to represent data in a concrete way using the physical models of Earth and Sun, helping them interpret and understand the data for why the length of day changes over the year, and why it is so different in different locations on the globe.
Acknowledgment
The authors would like to thank Kenneth Craig and Taryn E. Arthurs, fifth-grade teachers in Wellesley, for their help with this article.
Internet Resources
Daylight in Finland https://www.youtube.com/watch?v=nTjyt-6hJQw
Monthly Sunrise & Sunset Data (including day length) https://www.sunrisesunset.com/custom.asp.
Scale Model of Sun and Earth https://ngss.nsta.org/Resource.aspx?ResourceID=829
Yearly Sunrise & Sunset data http://aa.usno.navy.mil/data/docs/Dur_OneYear.php
NSTA Connection
Download the rubric, graph template, and NGSS connections at www.nsta.org/science-and-children.
References
Kenyon, L., C. Schwarz, and B. Hug. 2011. The Benefits of Scientific Modeling. Science and Children 46 (2): 40.
NGSS Lead States. 2013. Next Generation Science Standards: For states, by states. Washington, DC: National Academies Press.
Shea, L.M., and T.B. Shanahan. 2011. Talk Strategies: How to promote oral language development through science. Science and Children 55 (2): 62.
Worth, K. 2009. Essay: A Culture of Talk from Science and Literacy—A Natural Fit. Portsmouth, NH: Heinemann.
Carolyn S. Collins (collinsc@wellesleyps.org) is the PK–5 Department Head of Science & Engineering, and Molly D. Perkins is a fifth-grade teacher, both for Wellesley Public Schools in Wellesley, Massachusetts.
Earth & Space Science Instructional Materials Science and Engineering Practices