
feature
Virtual Sungazing
First graders use 360-degree photographs to view the Sun’s apparent daily pattern of motion across the sky.
Science and Children—November/December 2020 (Volume 58, Issue 2)
By Sarah Glassman, Elizabeth Shepard, Ryan Seymour, and Christina Zdawczyk

Both children and adults struggle to explain the cause of the day/night cycle and the seasons (Schoon 1995). Early elementary students may not be developmentally ready to explain that patterns of day and night are caused by Earth’s rotation on its axis, or that the seasons are caused by Earth’s tilted axis as the planet revolves around the Sun. However, when observing scientific phenomenon of day and night, they can notice different amounts of daylight throughout the year, and may wonder why this happens. To answer their questions, students can observe the Sun’s apparent daily pattern of motion across the sky and see how this pattern changes throughout the year. This article explains how to use 360-degree photographs of the Sun’s apparent daily pattern of motion across the sky at different times of the year (relative to a fixed object on Earth) to provide a realistic and accessible way for students to observe these patterns and explain annual daylight patterns.
Alternative Conceptions
Many students have alternative conceptions about day and night. Students may believe that the Sun goes out at night (Sadler 1987). When asked to explain, they may say that the Sun rises, stays at the top of the sky, and sets (Plummer and Krajcik 2010). However, careful observation of the Sun’s locations in the sky at various times during the day shows a specific arc pattern.
Students may not be aware that this daily pattern changes based on the time of year. In the summer, the Sun appears to make a longer arc and get higher in the sky. In the winter, the Sun appears to make a shorter arc and remains lower in the sky (see Figure 1). The Sun’s longer arc pattern in the summer and shorter arc pattern in the winter is related to the changing hours of daylight throughout the year. When the Sun has a longer arc, there are more hours of daylight. When the Sun has a shorter arc, there are fewer hours of daylight. (Note: This pattern is caused by the Earth’s tilted axis relative to the Sun. This explanation is not required by the NGSS performance expectations for first grade and therefore is not explored in this activity sequence.)
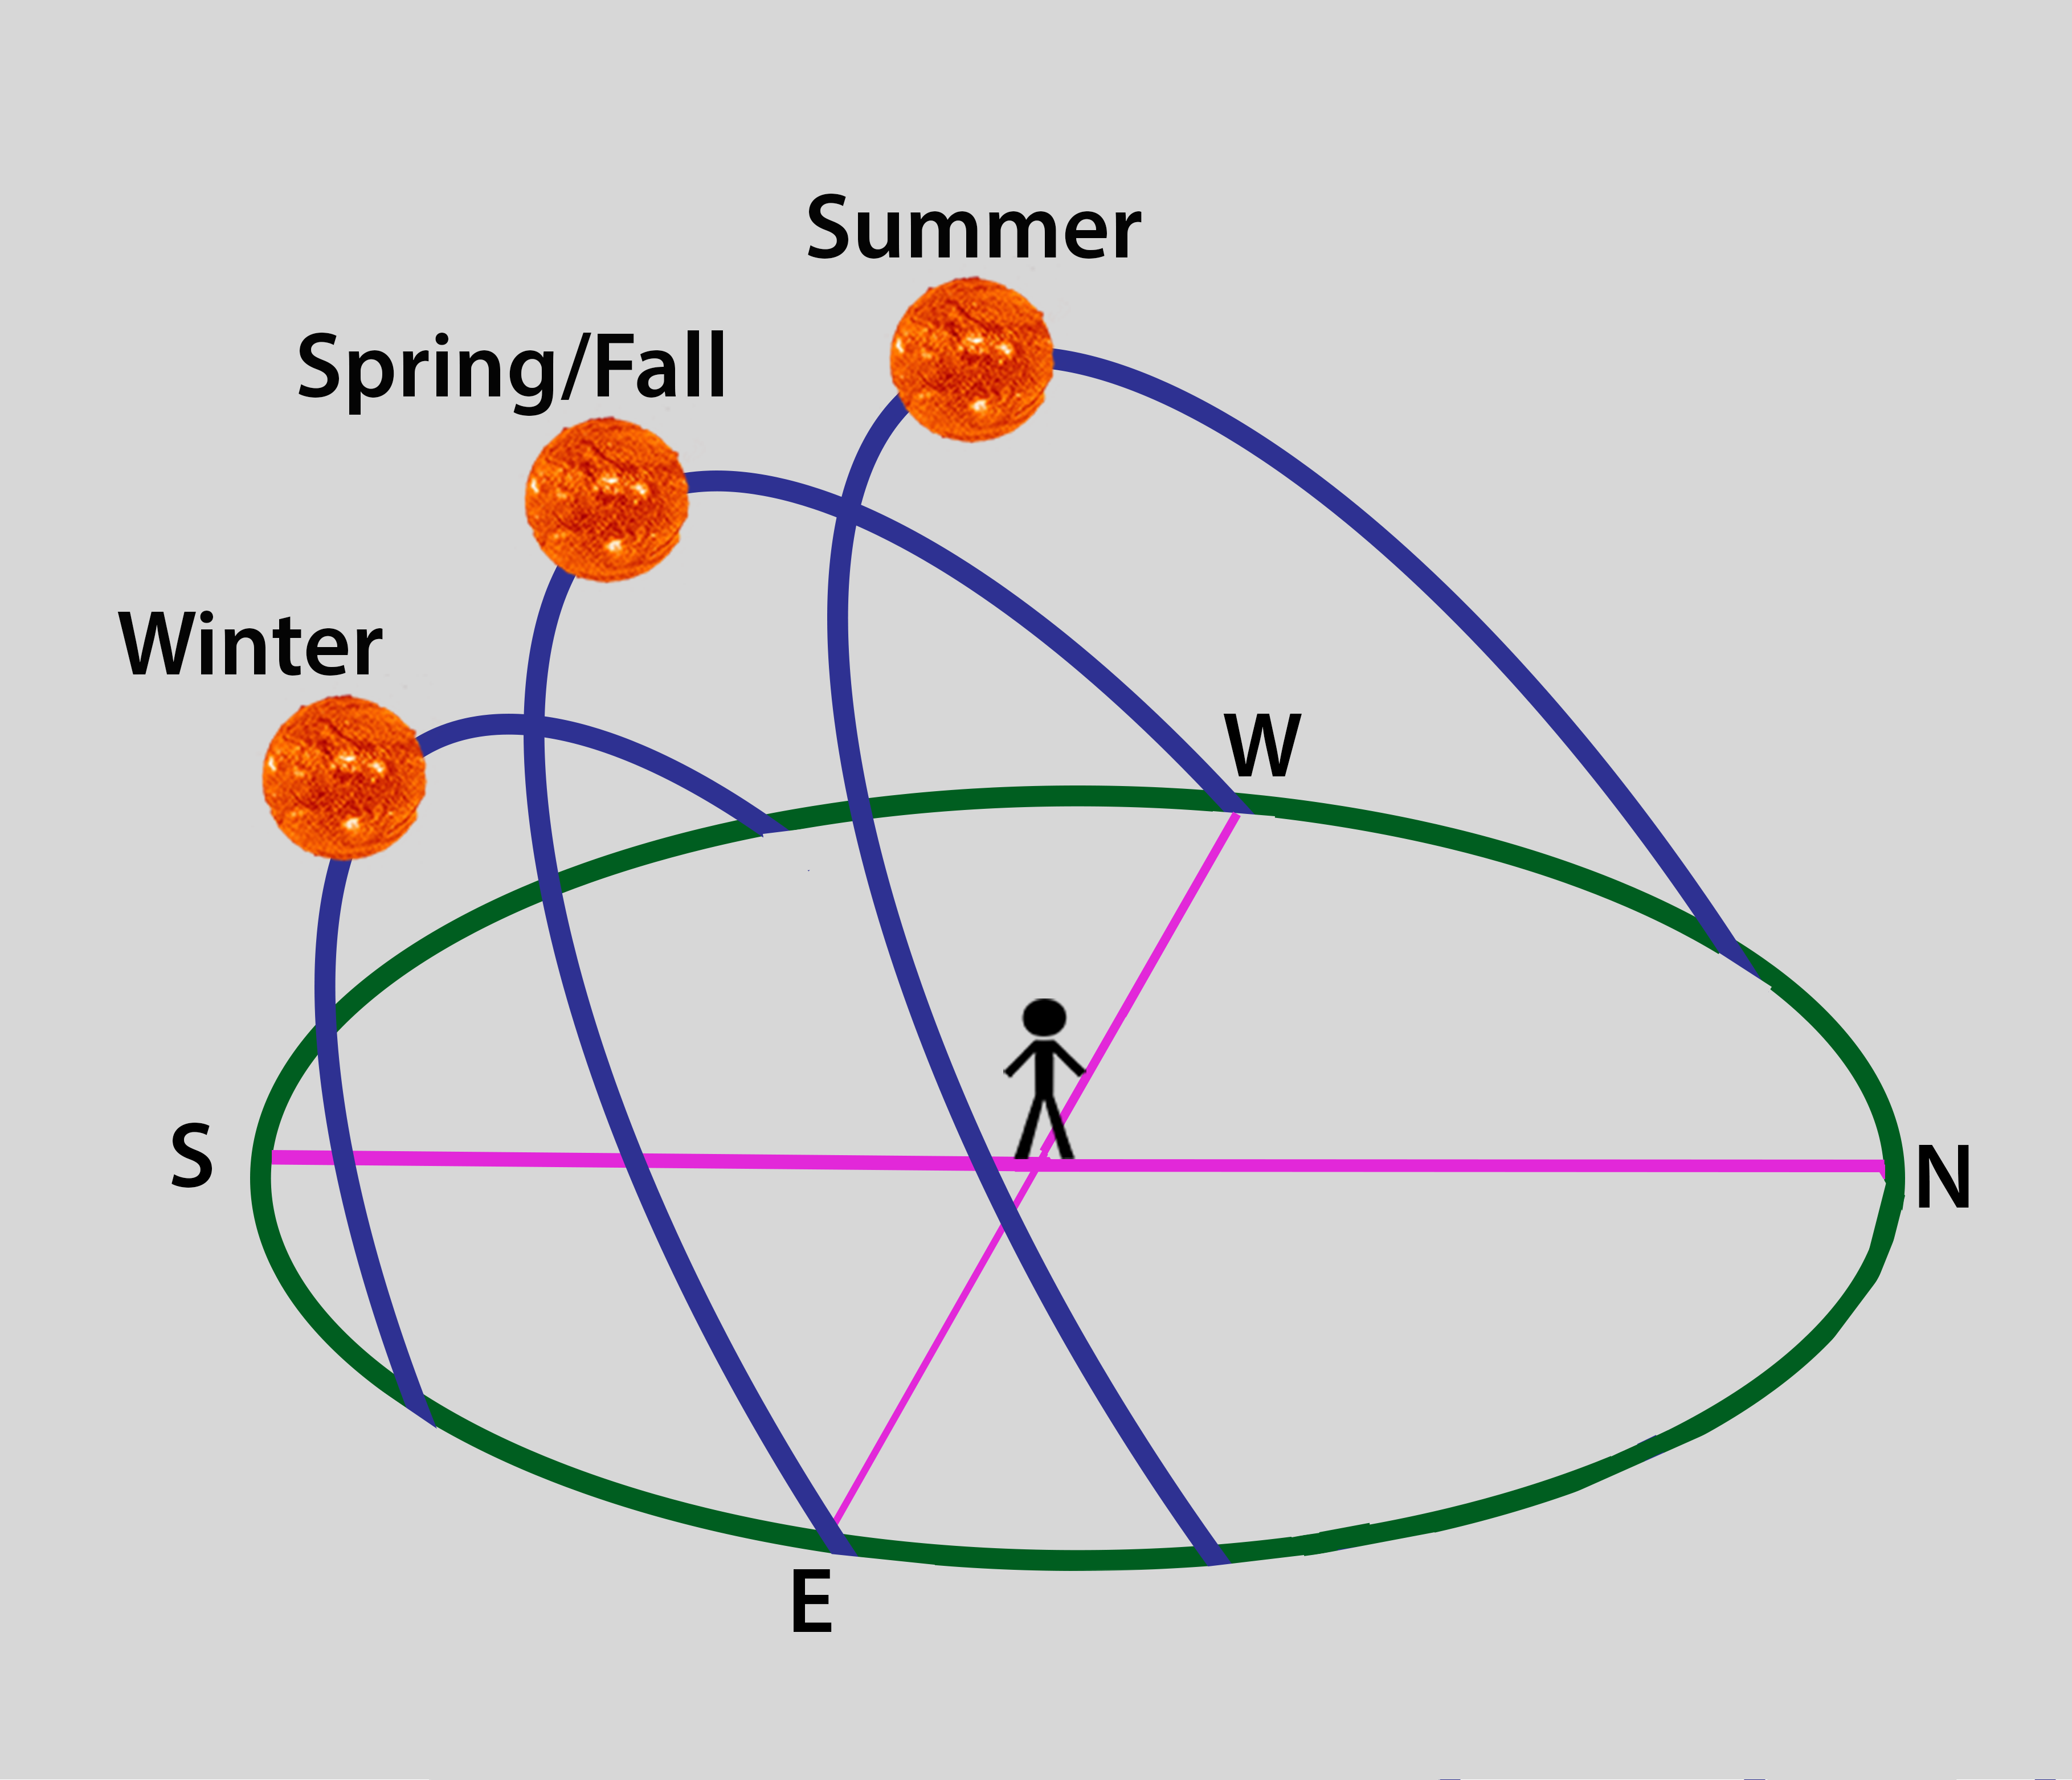
Arc of the Sun in different seasons.
Activity Sequence: Overview
The following series of activities prepares students to meet the NGSS earth and space systems performance expectations for first grade and addresses young students’ alternative conceptions about the Sun’s apparent pattern of motion in the sky. These activities are adapted from lessons in the Smithsonian Science for the Classroom module How Can We Predict When the Sky Will Be Dark? (Smithsonian Science Education Center 2020). These activities can easily be used for remote learning or socially-distanced learning. Students do not need to use or share any specialized equipment, and the digital resources are freely available for students to access from home.
On day 1, students observe images showing the scientific phenomena of day and night at different times of the year. Students develop a question to investigate why the amount of daylight changes throughout the year. On Days 2 and 3, students carry out an investigation to answer their question, then return to the scientific phenomenon from Day 1. On Days 4 and 5, students view 360-degree panoramic photographs to observe the Sun’s pattern of apparent daily motion in the winter and spring, then predict this pattern in the summer. By comparing the Sun’s apparent daily pattern of motion on a day in January to that on a day in March, students have evidence to begin to explain why there are fewer hours of daylight in the winter compared to the spring.
To implement the activities described in this article, teachers need 360-degree photos of the Sun’s pattern of motion, which are color-blind tested and can be accessed online or downloaded as an app at the Smithsonian website (see Internet Resources). Teachers will also need a daylight chart for each pair of students and an illustrated version of the Smithsonian Castle for each student (see NSTA Connection).
Why Photographs?
We wanted students to observe the Sun’s positions in the sky throughout the day across multiple seasons. However, going outside to look at the real Sun poses challenges. First, the Sun needs to be visible. It is often challenging to observe the Sun at or near sunrise and sunset during the school day, and cloud cover can always be an issue. Students would also need to go outside many times throughout one school day to record the Sun’s broad range of location. Further, students should not look directly at the Sun, so making careful observations of the Sun’s exact position relative to other objects is difficult.
To address these issues, we decided to take photographs multiple times throughout the day during winter and spring to capture the Sun’s changing position in the sky. We chose to stand on the National Mall facing the Smithsonian Castle. From this position, the Capitol Building is due east, the Washington Monument is due west, and the Smithsonian Castle provides a frame of reference to mark the position of the Sun during its apparent daily pattern of motion across the southern sky. Because the Sun’s pattern of perceived motion is three-dimensional and spans such a large part of the sky, we decided to use 360-degree panoramic photographs. By observing 360-degree photos, students can observe the Sun’s apparent daily motion in a three-dimensional space rather than as a flat photograph. 360-degree panoramas allow for unbroken views of a location, giving a sense of being there (Bourke 2014) to students.
Day 1: Generating Questions
On Day 1, show students the two images in Figure 2. To pre-assess students, ask students what they notice and what they wonder about the pictures (Moulding and Bybee 2017). Record students’ observations and questions on chart paper. Students may wonder how it is possible that the time is the same in both pictures, or why the girl is sleeping during the day but awake at night. Ask students questions to connect their experience to their observations. Ask, “Have you ever gone to bed when it was still light outside?” and “What time of year was it?” As a class, come to consensus on a single question to investigate related to the amount of daylight throughout the year. For example, “How does the amount of daylight change throughout the year?”

Daylight comparison photo.
Days 2 and 3: Investigating Daylight
On Day 2, show students a blank daylight chart (see NSTA Connection) and ask how we could complete this chart. Students may suggest that we could keep track of sunrise and sunset on the first day of each season and record it. Our students quickly realized that would take an entire year. Students were excited when we showed them an online resource that provides sunrise and sunset times for every location in the world, for any day selected (see Internet Resources). Working in pairs, students created the symbols they would use to represent daytime and night. Before Day 3, we recorded sunrise (sr) and sunset (ss) times on the chart (see Figure 3) and photocopied it for each student.
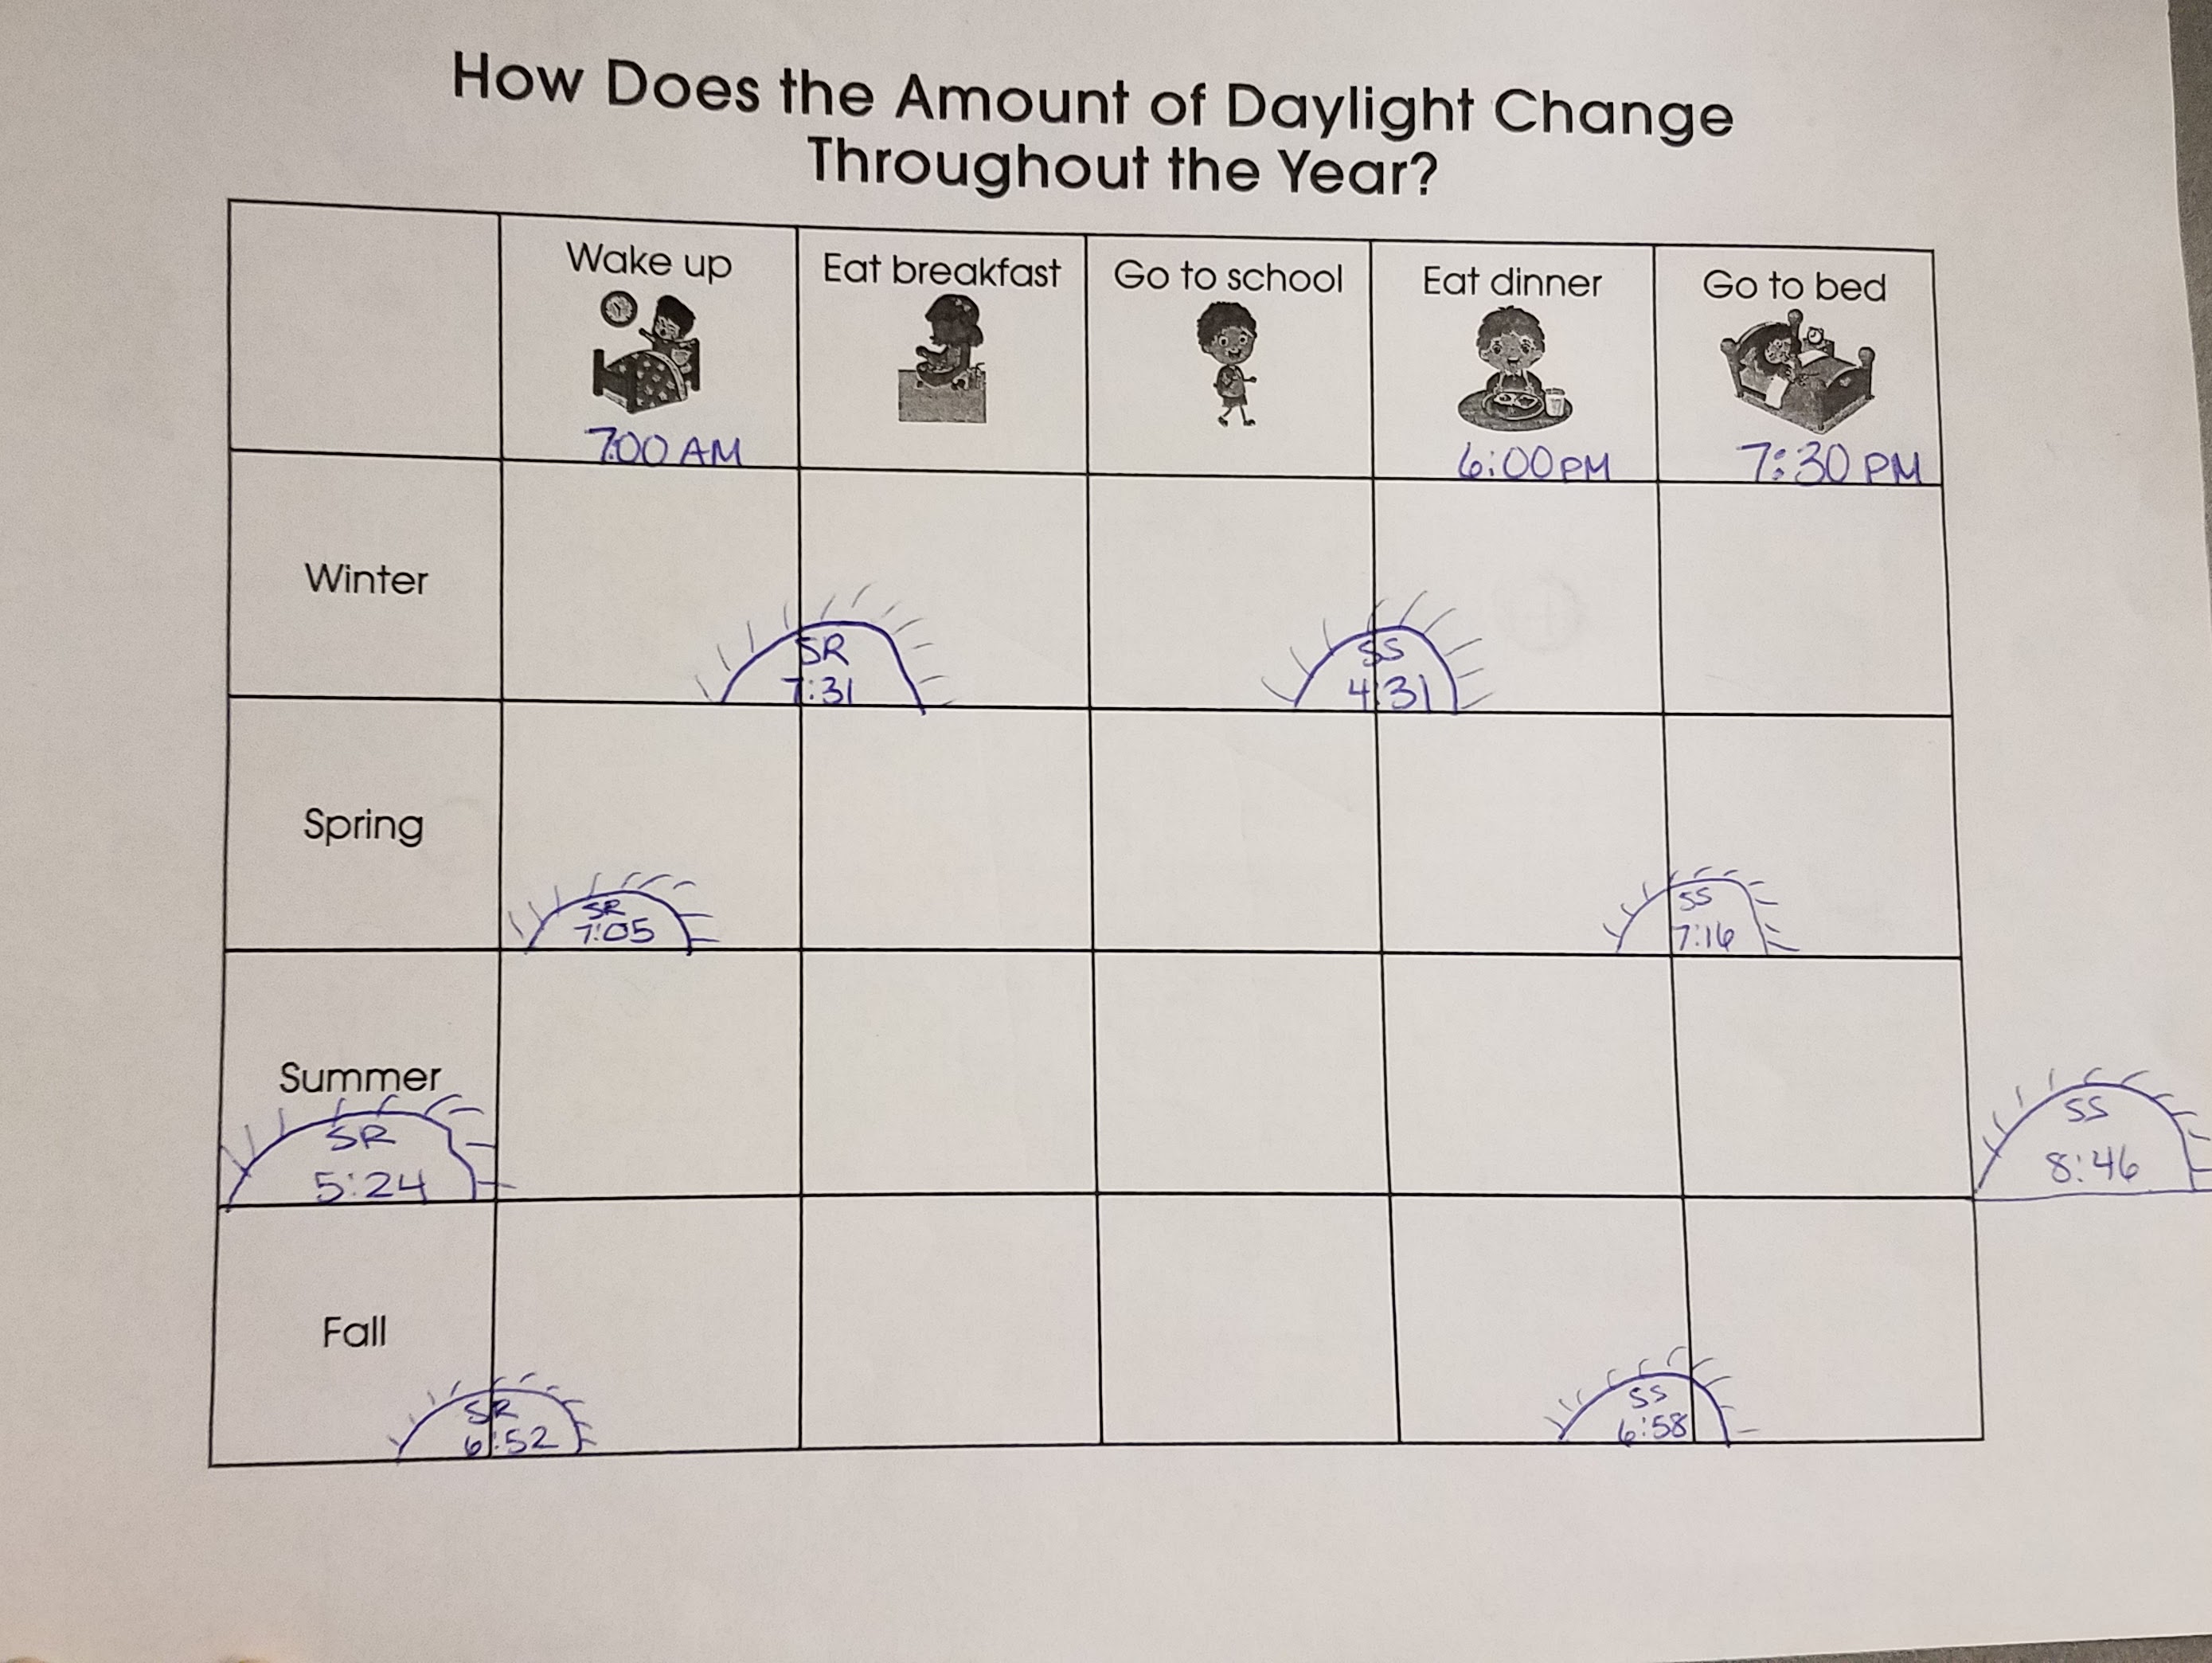
Daylight chart.
At the beginning of Day 3, we modeled how to complete the winter row of the chart with daytime and night symbols. This type of modeling benefits all students but especially English learners. Students worked in pairs to complete the rest of the chart.
Next, students added sticky notes to two class charts to indicate what time of the year has the most daylight and what time of the year has the least daylight. If students are learning remotely, create a poll or shared document for students to report their results.
Show students the two images of the girl in bed again (see Figure 2). Remind students what they were wondering at the beginning of Day 1. Invite students to talk to a partner to see if they can explain some of the things they were wondering. Have students share their thoughts with the class. Listen to student responses to formatively assess students. Students are likely to say that the photograph of the girl in bed in daylight was taken in the summer and the other photograph was taken in the fall, winter, or spring. If students are not able to explain this, direct students to look at the “Go to Bed” row of the daylight chart to see what times of the year it is dark or daylight when they go to bed.
Day 4: Observing the Sun’s Pattern in January
On Day 4, show students the results of their investigations and ask, “Why is there less daylight in the winter?” Collect student responses on chart paper. Make connections between students’ ideas and observations of the Sun in the sky. Students might say that the Sun goes behind the clouds more in the winter or that the Sun is in the sky for less time in the winter. Ask students how they could make observations to see if this is true.
Tell students that you have photographs showing the Sun in the winter and the spring. Tell students they can use these pictures to see if the Sun looks different at different times of the year and figure out why there is less daylight in the winter. Project an aerial view of the National Mall so students can see where the photographs were taken (see Figure 4). Explain to students that these are special photos that would let them see all around them. The pictures were taken at the location marked with an X. Point out the relative location of the following buildings in the photographs: the United States Capitol, Smithsonian Castle, and Washington Monument.

Aerial photo of the national mall. oscarhdez/iStock/Getty Images Plus with illustrations added by Hannah Osborn.
The Sunlight on the National Mall simulation is designed for early elementary students. If you have the technology resources to do it, have pairs of students share a device to view the photographs. If the device has a gyroscope, students can turn their body to see different parts of the photograph. Otherwise, they can use a mouse or arrow keys to move around in 360-environment. Model using the simulation for students. Then have students view each of the winter photographs, plot the relative position of the Sun on an illustration of the Smithsonian Castle, and label the order of the Sun’s position with the numbers 1–5 (see Figure 5). If students have trouble plotting the position of the Sun in the correct location, show students how they can use the position of the Sun relative to the Smithsonian Castle or the trees to estimate where to draw the Sun on their paper. If students are learning remotely, model how to use the simulation through live screen sharing or recorded instruction. Share the web link with students so they can complete the activity at home. Or, share the simulation through live screen sharing and have students record their data. For students who are visually impaired, make a tactile diagram to model the positions of the Sun relative to the Castle. Use puffy paint or glue to outline the shape of the Castle and use foam stickers to represent the Suns.
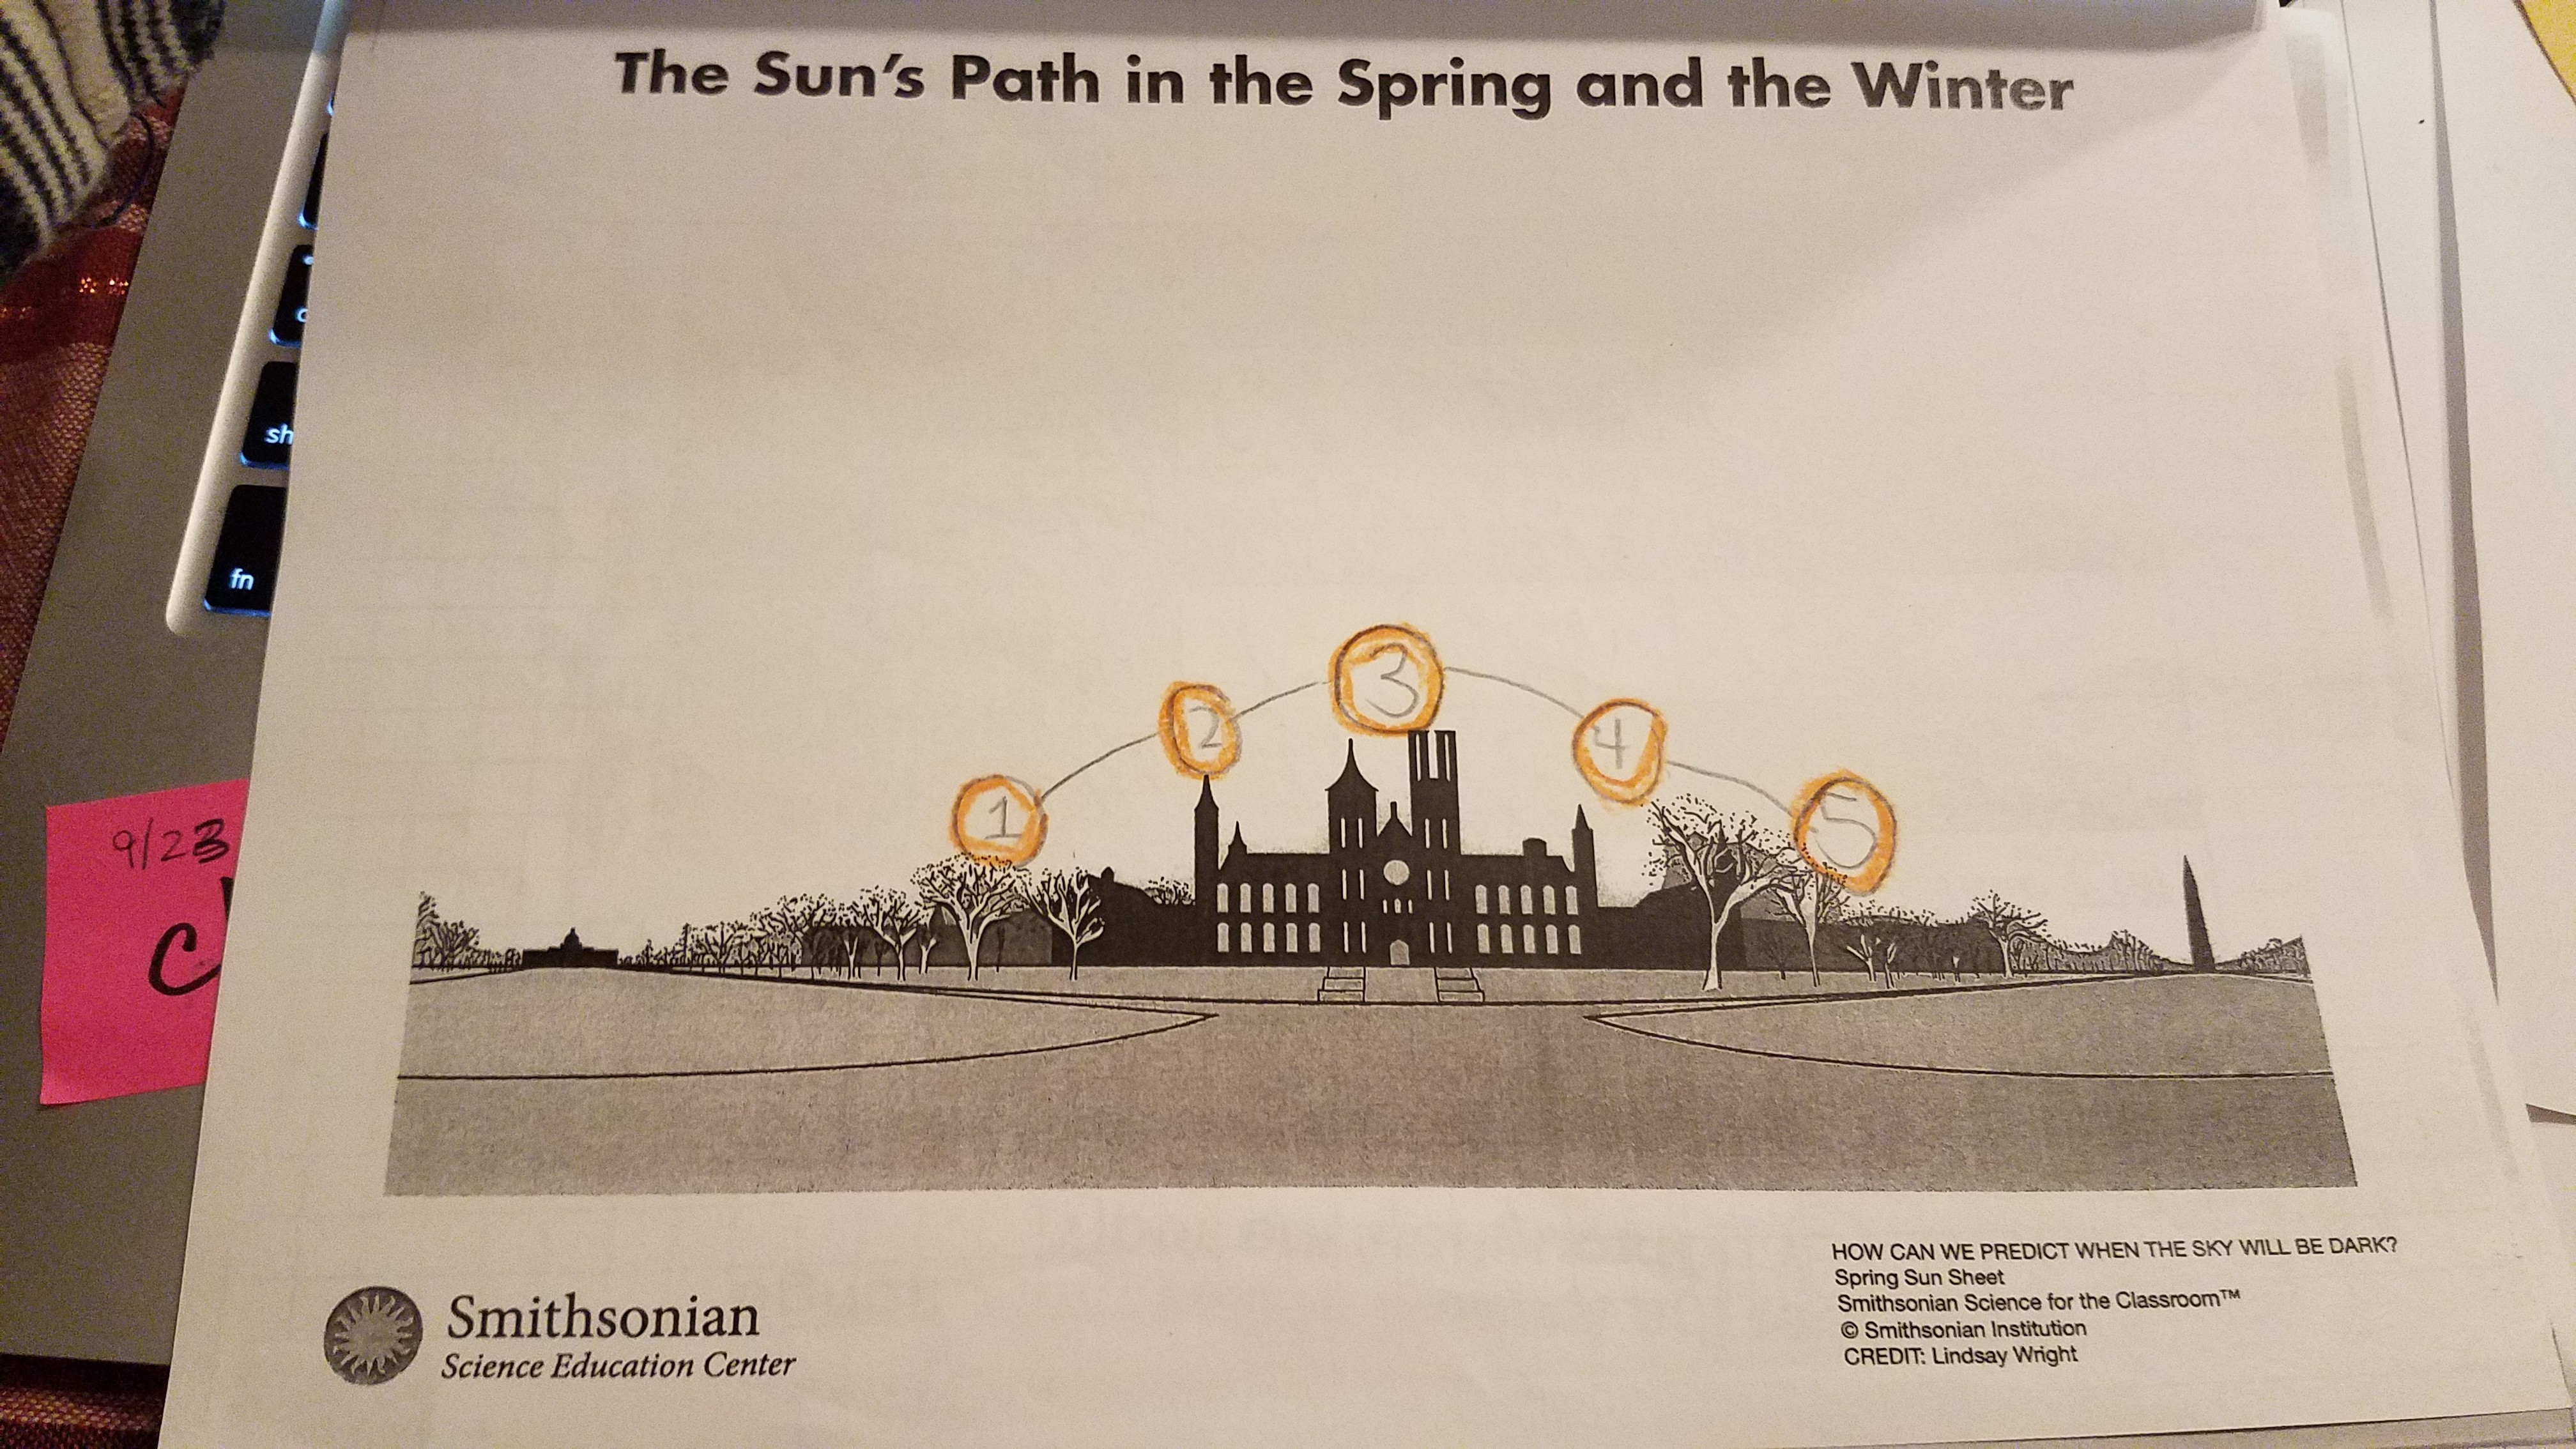
Plot of the Sun’s path.
Plot of the Sun’s path.
When we did this activity, we asked students to discuss the Sun’s pattern of motion first with a partner and then as a class. One student suggested that the Sun’s pattern looked like a rainbow. We introduced the word arc to students to describe the curved pattern that looks like part of a circle. We asked students if they thought the Sun exhibits the same pattern of motion where they live as it does in Washington, DC. We pointed to the direction of sunrise and asked students to predict how they think the Sun moves in the sky where they live. Students predicted the Sun’s motion both by pointing their finger to outline the Sun’s path and by making a class model.
In order to connect the observations that students made of the pictures from Washington, DC to the Sun’s motion where they live, we had students go outside and observe the general position of the Sun at different times of the day. Remind students to observe the general position of the Sun but not to look directly at the Sun. If students are learning from home, ask them to notice the general position of the Sun at two different times of the day from their home. Students who are visually impaired can identify the Sun’s position in the sky by feeling the heat of the Sun and/or sensing the brightest part of the sky.
Alternatively, take panoramic photographs of the Sun on the school’s property to show students. Plan-ahead by knowing the Sun’s apparent path of motion, knowing sunrise and sunset times, and finding a day with clear skies predicted. Take a panoramic photograph that includes the Sun’s full path of motion five times throughout the day. Take the first photograph an hour after sunrise and the last photograph an hour before sunset. As an extension, invite students learning remotely to photograph the Sun five times of the day from their home and upload them to share with the class. (Revisit safety requirement to not look at the Sun.)
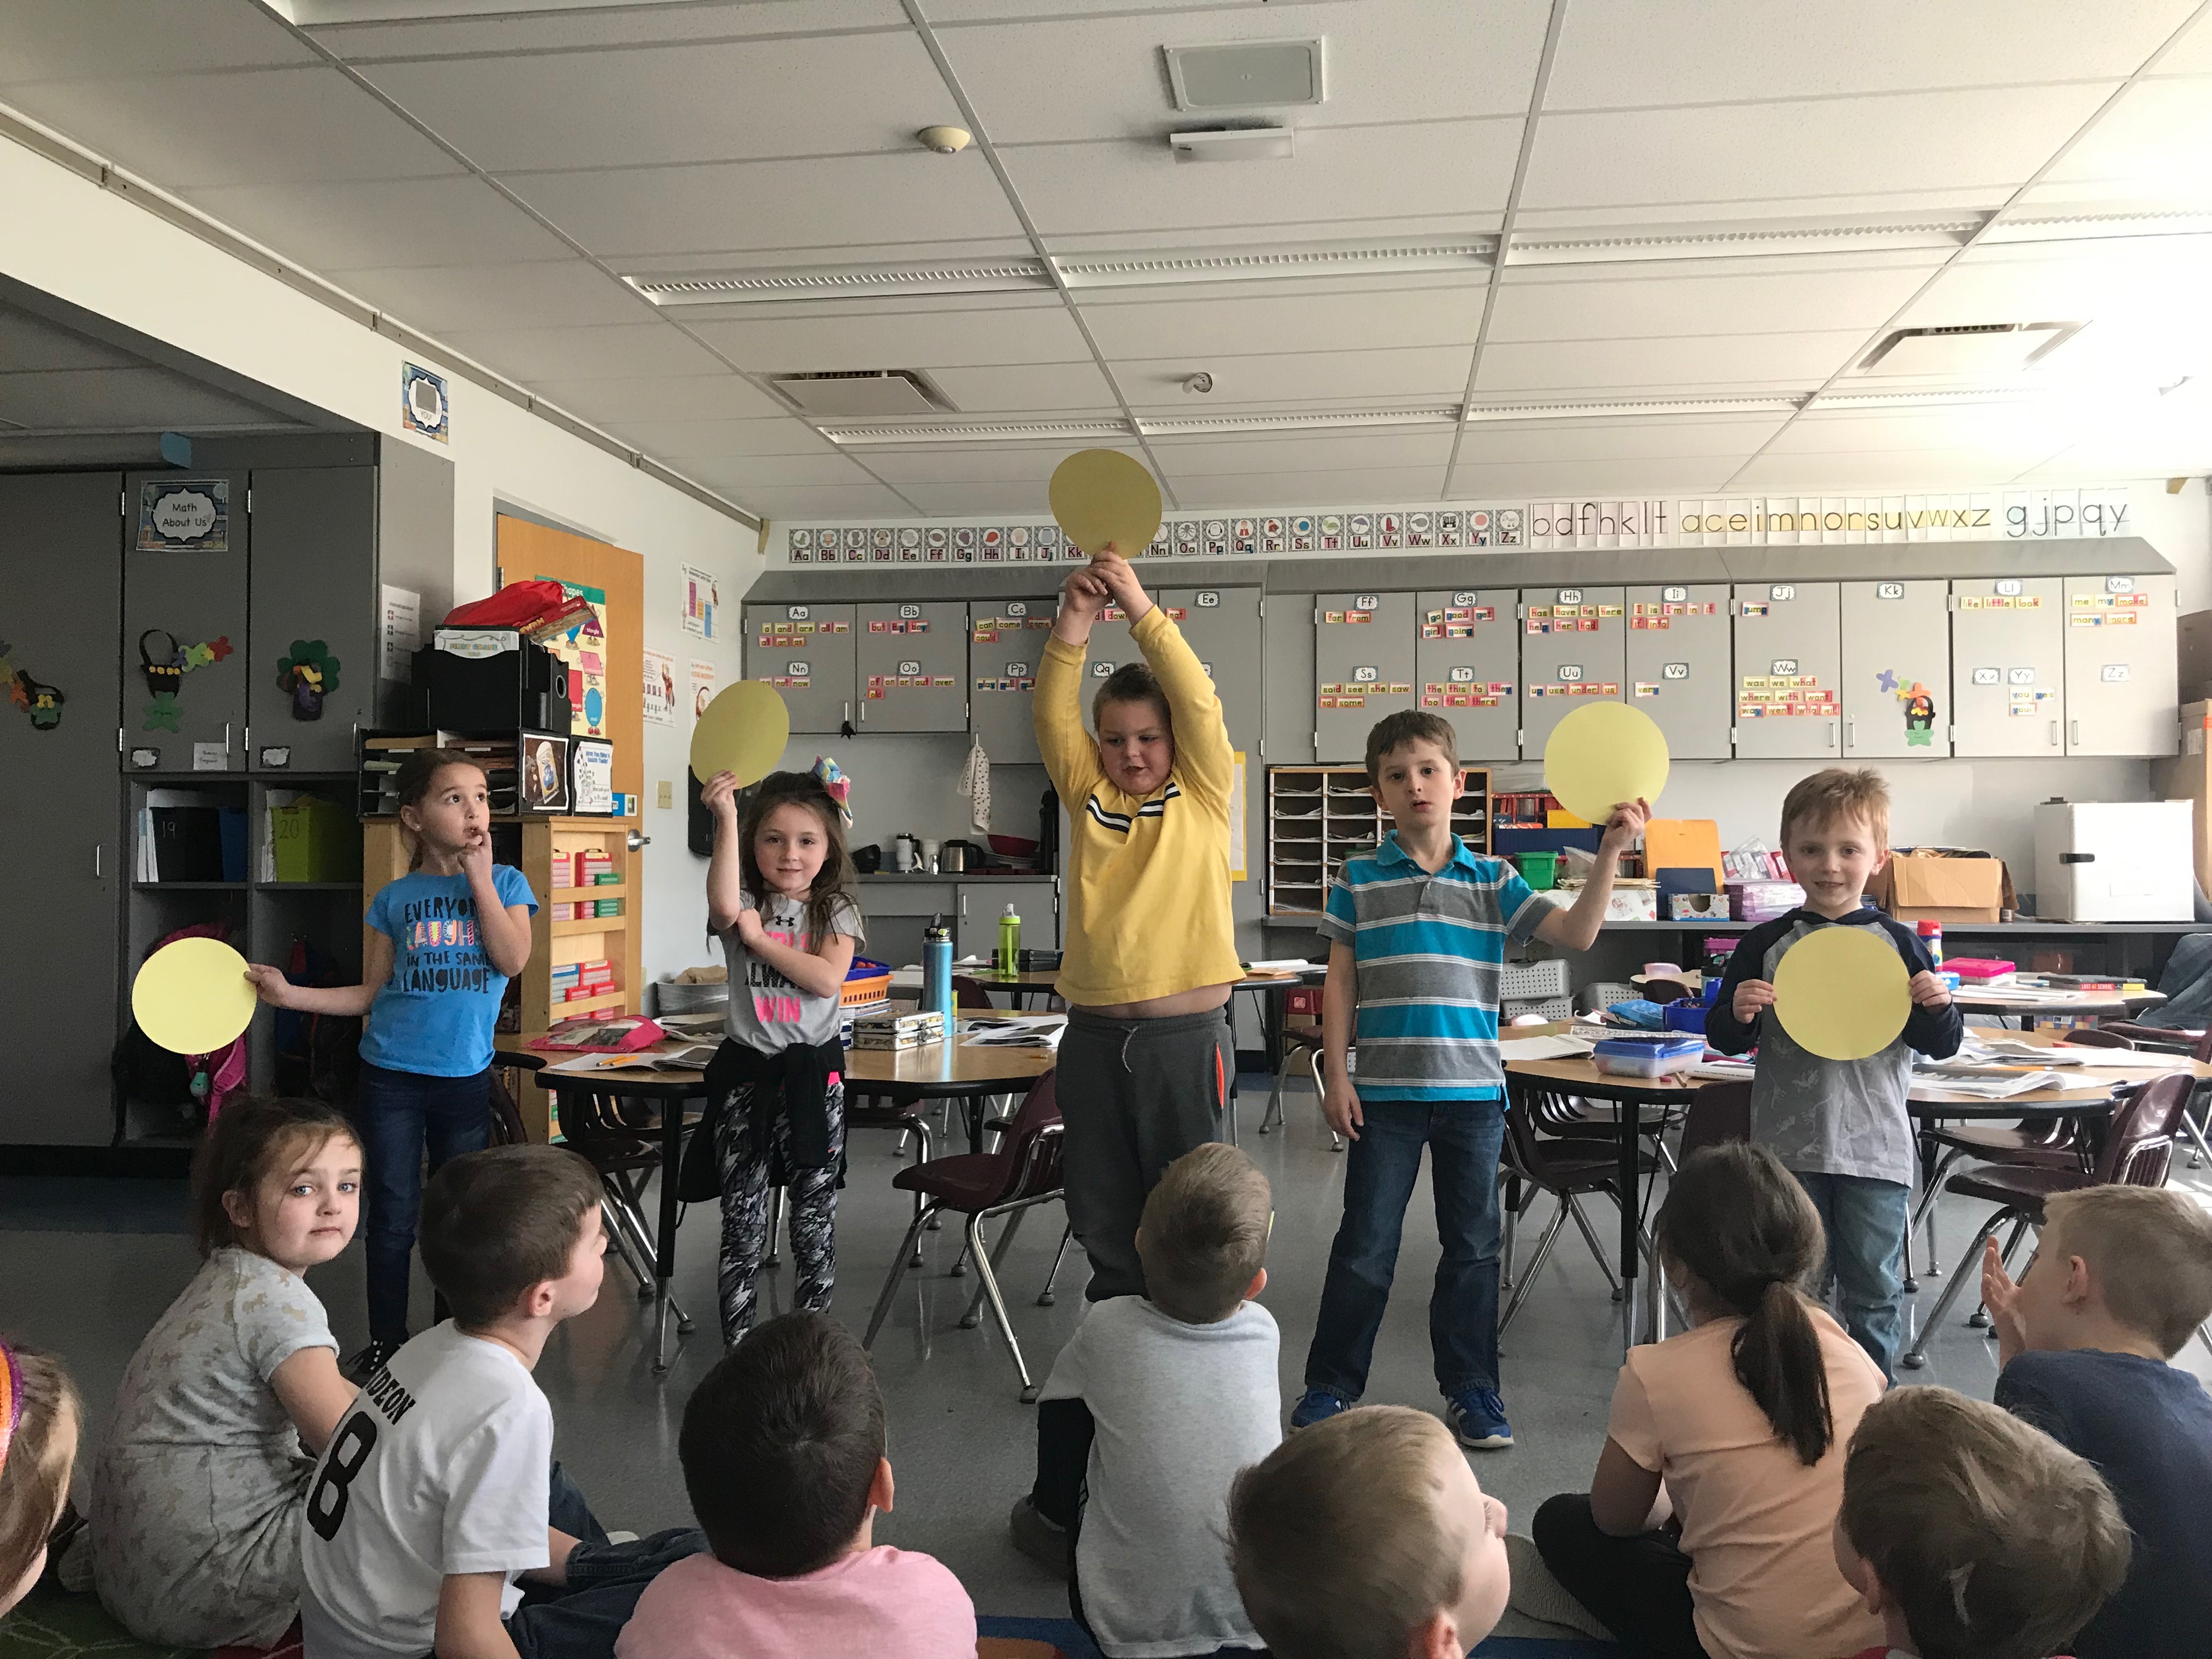
Students predicted the Sun’s motion both by pointing their finger to outline the Sun’s path and by making a class model
Day 5: Observing the Sun in March
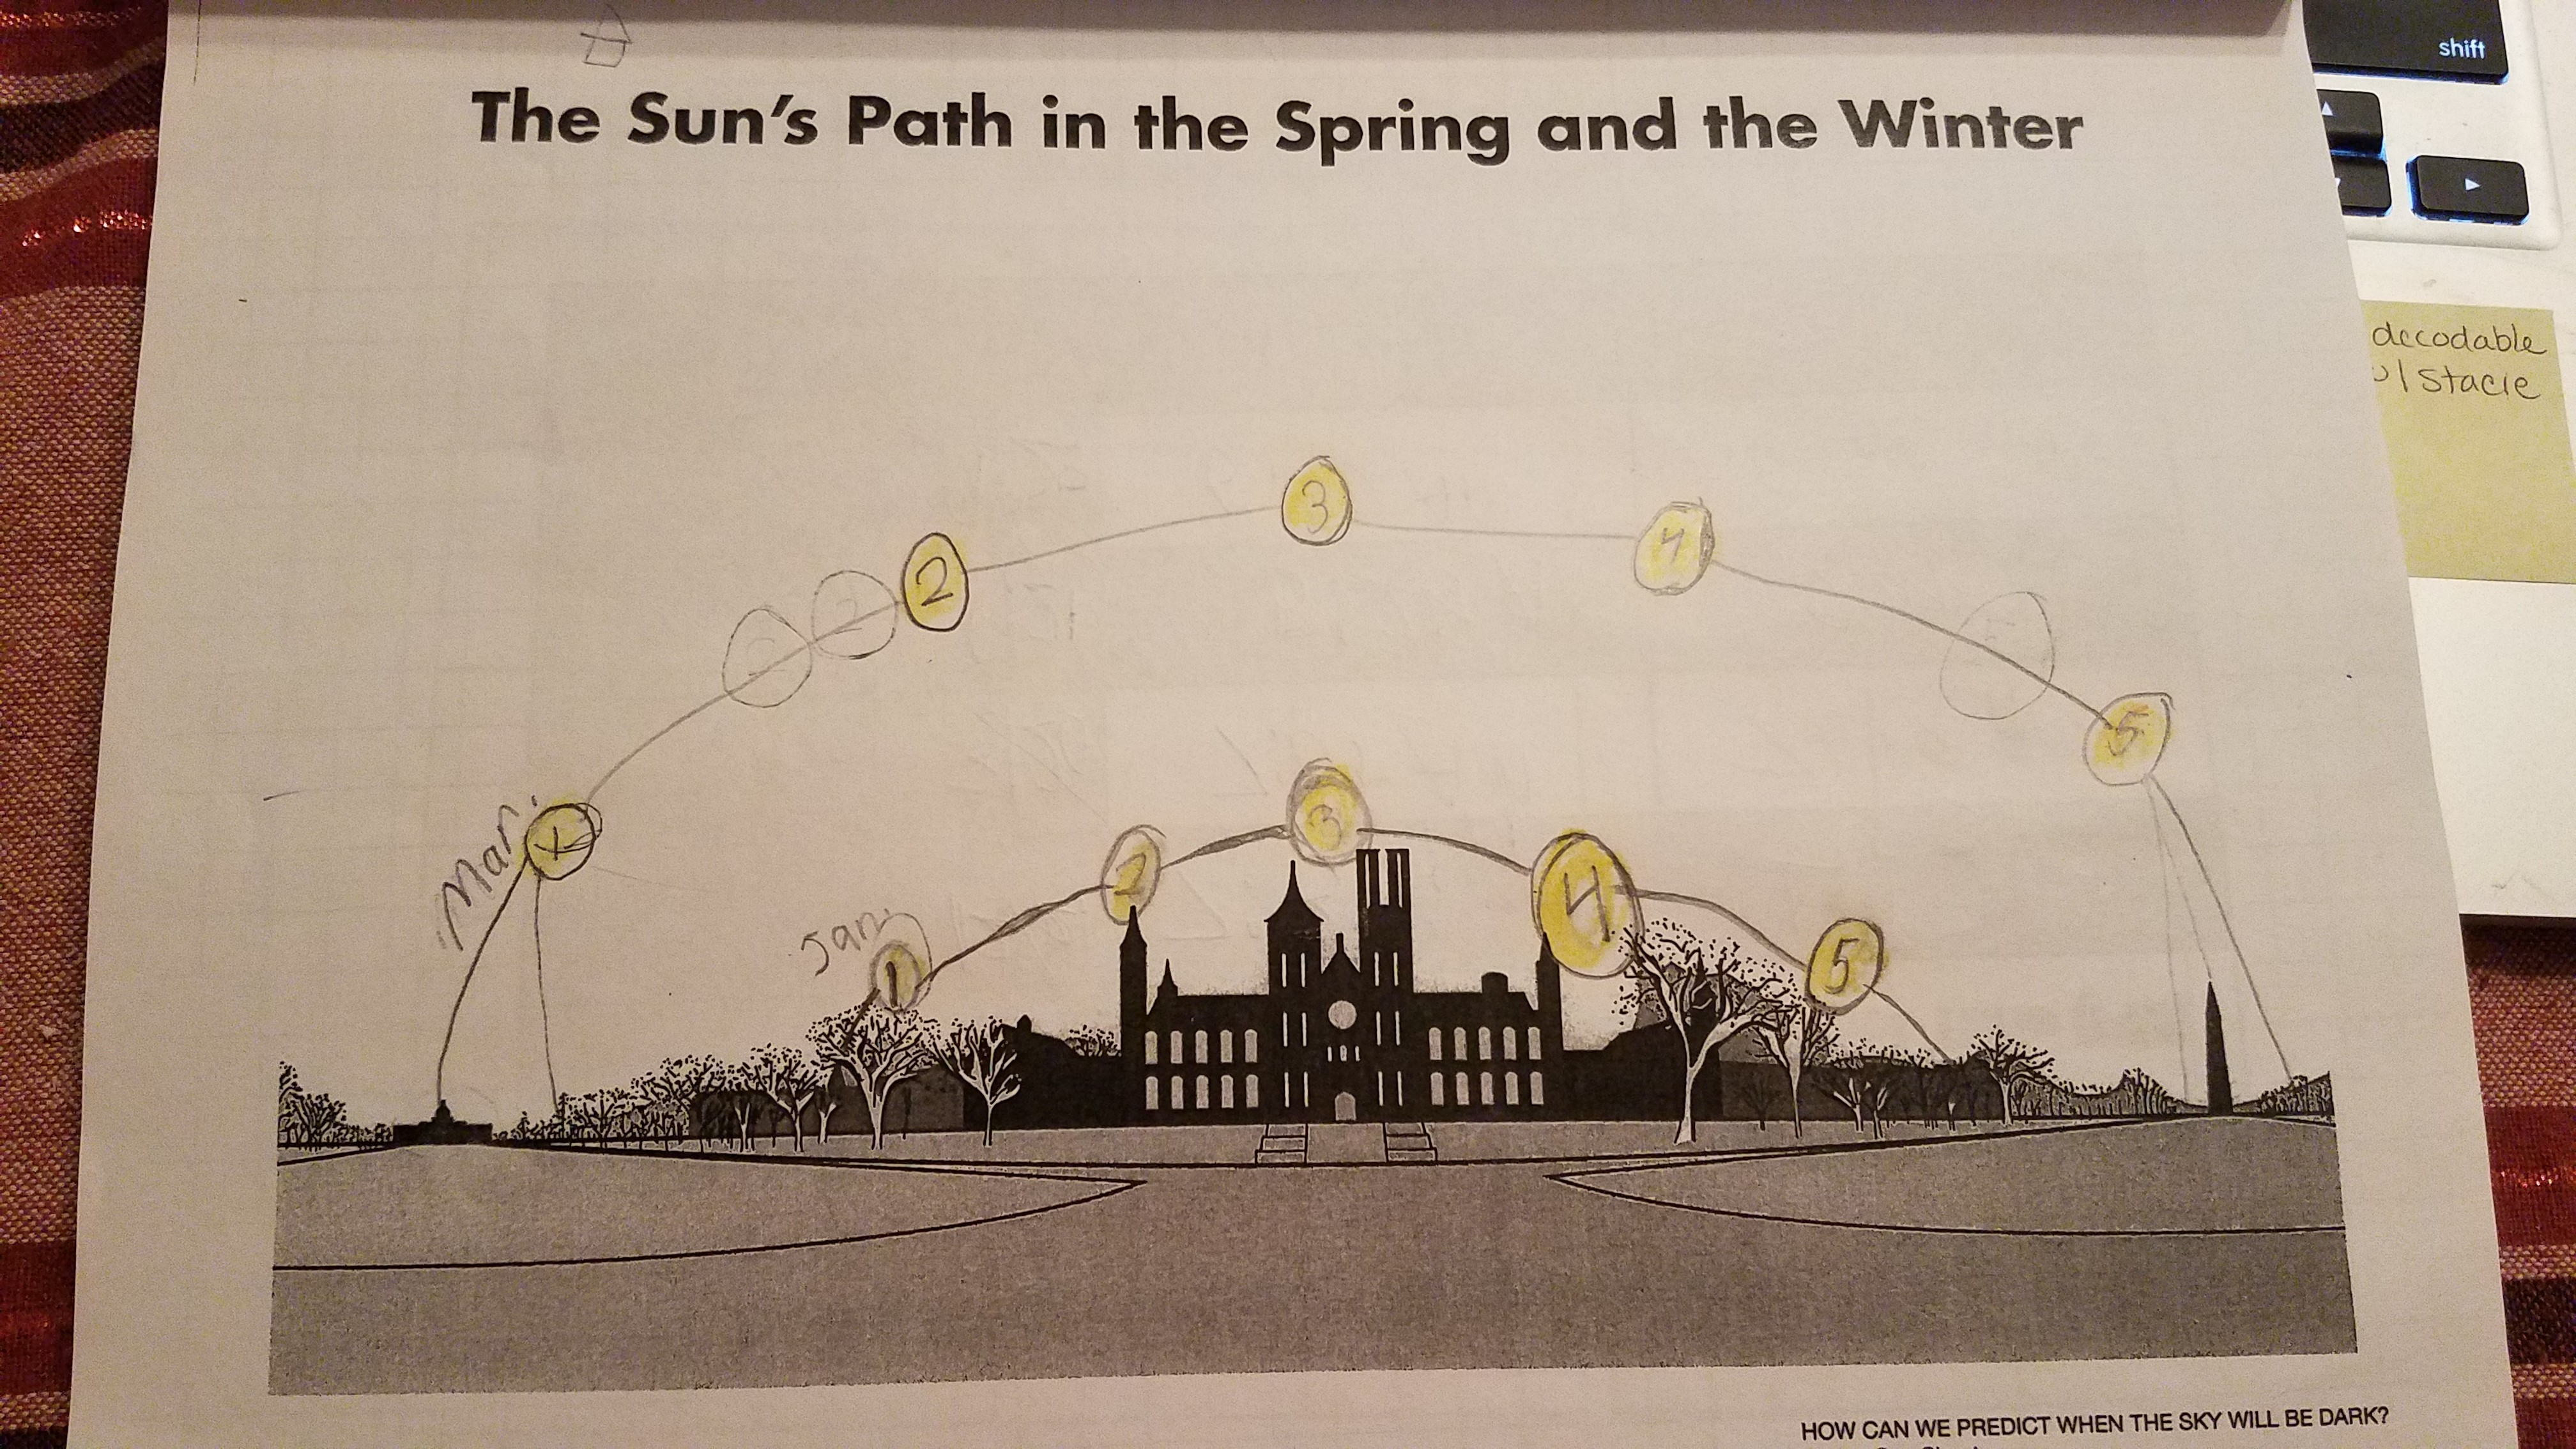
On Day 5, show students the 360-degree photos taken on a spring day. Ask students to view the spring photos and add the Sun’s pattern of motion to the Smithsonian Castle illustration (see Figure 6). When we did this activity, students could see the connection between the annual daylight charts and the Sun’s changing pattern of motion, but they weren’t immediately sure why that was true. To illustrate, we used tape to plot the path of a shorter and longer arc on the classroom floor. We walked the path of each arc at the same speed while students counted how long it took. Students could see that it would take more time for the Sun to cover the longer arc. If students are learning remotely, share this demonstration with live screen sharing or a pre-recorded video.
As a summative assessment, ask students to predict positions of the Sun at different times of a summer day. Allow students to use their daylight chart and the class charts to remind them of the annual pattern of daylight. Ask students to explain why they drew the Sun’s positions as they did. See if they can predict one more position of the Sun at another time on a summer day. We have provided a table online for guidance in assessing students across all three dimensions—disciplinary core ideas, science and engineering practices, and crosscutting concepts (see NSTA Connection). If students have trouble, review how the amount of daylight and daily pattern of motion changed from winter to spring. Help students use the relationship between a bigger arc and a longer day to make a prediction about summer.
Conclusion
Observing how the position of the Sun changes over the course of a day and a year provides evidence for students to begin to understand the Earth-Sun system. There are challenges to taking students outside multiple times a day and multiple times a year to make these observations. 360-degree photos provided a solution. Students can use evidence from these photographs to begin to explain the cause of annual daylight patterns. ●
Internet Resources
NSTA Connection
Download the Smithsonian illustration, daylight comparison photo, data chart, student work, NGSS connections, and assessment table at www.nsta.org/science-and-children.
References
Bourke, P. 2014. The panorama: Applications to science and heritage visualization. Lawrence Wilson Art Gallery, Web. http://paulbourke.net/papers/lawrencewilson.
Moulding, B., and R. Bybee. 2017. Teaching science is phenomenal. Washington, UT: ELM Tree Publishing. ISBN:978-0-9990674-0-6
Plummer, J.D., and J. Krajcik. 2010. Building a learning progression for celestial motion: Elementary levels from an earth-based perspective. Journal of Research in Science Teaching 47 (7): 768–787.
Schoon, K.J. 1995. The origin and extent of alternative conceptions in the earth and space sciences: A survey of pre-service elementary teachers. Journal of elementary science education 7 (2): 27.
Sadler, P.M. 1987. Misconceptions in astronomy. In Proceedings of the Second International Seminar: Misconceptions and Educational Strategies in Science and Mathematics (Vol. 3, pp. 422-425), ed. J.D. Novak. Ithaca, NY: Cornell University.
Smithsonian Science Education Center. 2020. How Can We Predict When the Sky Will Be Dark? Burlington, NC: Carolina Biological Supply Company.
Sarah J. Glassman (glassmans@si.edu) is a science curriculum developer at the Smithsonian Science Education Center in Washington, DC. Elizabeth Shepard is a first-grade teacher at Bolivar Road Elementary School in Chittenango, New York. Ryan Seymour is a digital producer at the Smithsonian Science Education Center. Christina Zdawczyk is a PhD candidate at the University of Minnesota in Minneapolis, Minnesota.
Astronomy Earth & Space Science Inquiry Teaching Strategies Early Childhood Grade 1