
Disequilibrium
Learning by (seeing) osmosis
Materials
For the Engage phase
- three eggs
- white distilled vinegar (5%)
- distilled water
- light corn syrup
For the Explore phase (per student group)
- beaker (or measuring cup)
- plastic cups (at least three)
- 450 g dry beans (about a pound)
- tap water
- saltwater solution (25% b/w)
- markers
- paper towels
- access to a gram balance or digital scale
The humble cell—invisible to the naked eye and thus, to much of human history—is the fundamental unit of life. Like most objects studied in science that cannot be seen directly, cells can be confusing for students because a level of abstraction is necessary to visualize and understand them. For instance, Driver et al. (2015) reported that students are often unable to distinguish between cells, molecules, and atoms—all of them are just invisible objects that teachers insist on referring to as “building blocks.” Student confusion can be exacerbated when studying topics such as transport across the cell membrane, which require students to consider objects at multiple scales: cellular, subcellular, and molecular/atomic.
Life science teachers can find student difficulties particularly acute during instruction on osmosis (e.g., Odom 1995). Many curricula treat osmosis as a subclass of diffusion. However, osmosis is more complex conceptually and adequate visual representation is more difficult to provide. As a result, teachers frequently find it hard to instill a true understanding of osmosis and are forced to settle for students dutifully repeating that osmosis is “the diffusion of water across a membrane.” This is a shame, because from the kitchen to our kidneys, osmosis plays a key role in life processes!
In this edition of Disequilibrium, we will examine why osmosis is so difficult to understand, and explore activities that push students to a deeper comprehension.
Background: Osmosis on notice
While teaching about cell transport, students who grasp diffusion easily on Monday might declare on Tuesday that understanding osmosis is difficult. I used to find this baffling, but came to realize that there were at least two reasons that this might be the case. Diffusion—the spontaneous net movement of particles down their concentration gradient—can be understood simply as “things naturally spreading out over time.” No real understanding of concentration, entropy, or permeability is necessary to get the gist. Osmosis, however, only happens in solutions and across semi-permeable membranes. Students cannot really explain it without some understanding that concentration is a ratio of molecules of solute to solvent, nor without understanding that the cell membrane allows for some passage of water, which can result in a net gain or loss of this important solvent for the cell.
To make matters worse, many diagrams of diffusion and osmosis obscure key features of the process. Diagrams of different “concentrations” often do not include water molecules (except as a blue background), making it harder for students to understand that water is also a diffusible molecule. Nor is it clear, from most diagrams of cell membranes, that water also is able to pass through the membrane. Given these difficulties, how can we help our students to better understand the process of osmosis?
Engage
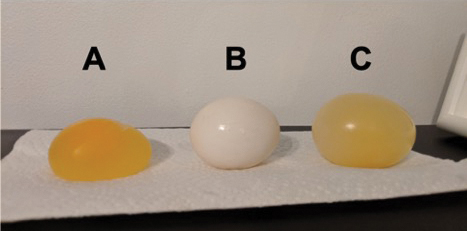
Kick off this investigation of osmosis with an adaptation of the classic demonstration modeling osmosis in decalcified chicken eggs (Flannery 1965). This demonstration takes a few days of lead time, but it is a classic for a reason. A few days before class, soak the egg in white distilled vinegar for 24–48 hours to dissolve the calcium carbonate-rich shells on the eggs (see Resources). You will be left with shell-less eggs that have a translucent, semi-permeable membrane around the white and yolk.
One day before the lesson, submerge one decalcified egg in distilled water, and one in corn syrup (though a saturated salt solution will also work, per Flannery 1965). This is best done in full view of students so that they can see how things will progress over time.
Show the eggs to students the next day, and compare the naked eggs to an untreated egg (Figure 1). Ask students for their observations: The changes in size will be obvious; some students may also notice a layer of water around the egg in the corn syrup. Elicit students’ questions and ideas about why these changes occurred. Note some student thoughts on the board, then ask students to connect what they just saw—the movement of water through a membrane—to the maintenance of homeostasis by cells and organisms. Tell students that such movement will be the focus of this next lesson.
A classic model of osmosis
Explore
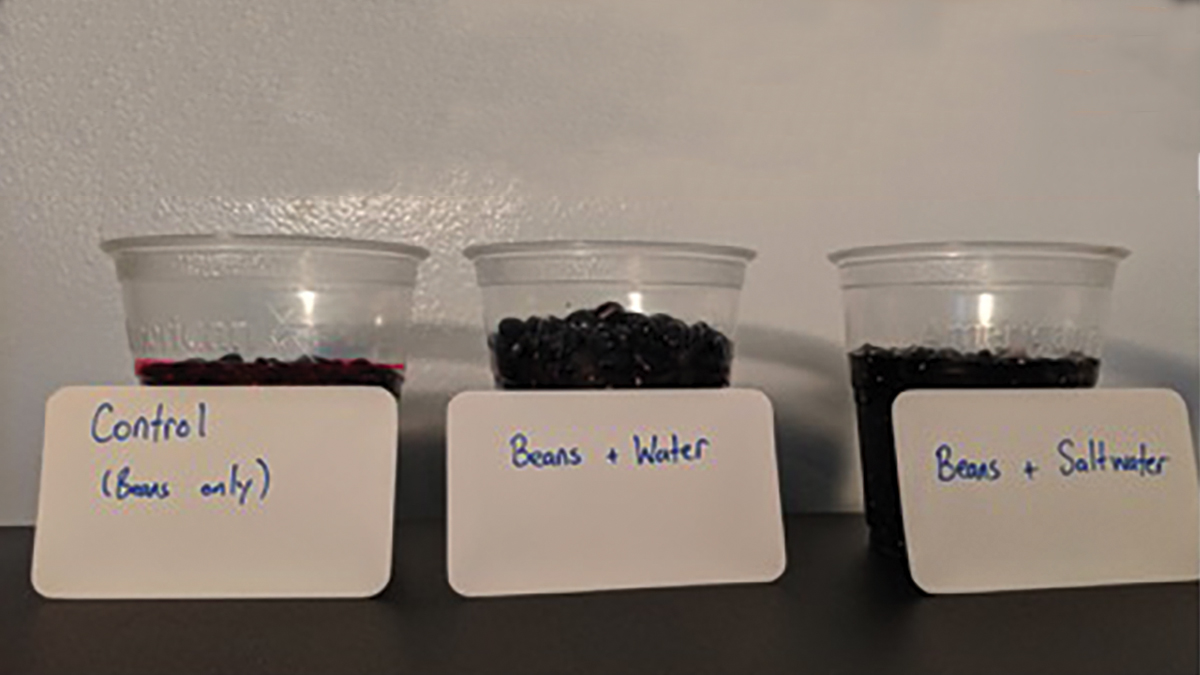
Tell student groups they are going to design an experiment that will quantify the movement of water across a semi-permeable membrane by using dried beans placed overnight in either tap water or a saltwater solution. The salt solution will act as an analogue to the corn syrup in the demonstration; in many other ways, this setup will be similar to the demonstration, but provide students the opportunity to gain quantitative data about the movement of water. Tell students you will provide each group with the following materials: beaker (or measuring cup) plastic cups 450 g dry beans (about a pound) tap water saltwater solution (make either a saturated solution or a 25% by weight solution) markers access to a gram balance or digital scale.
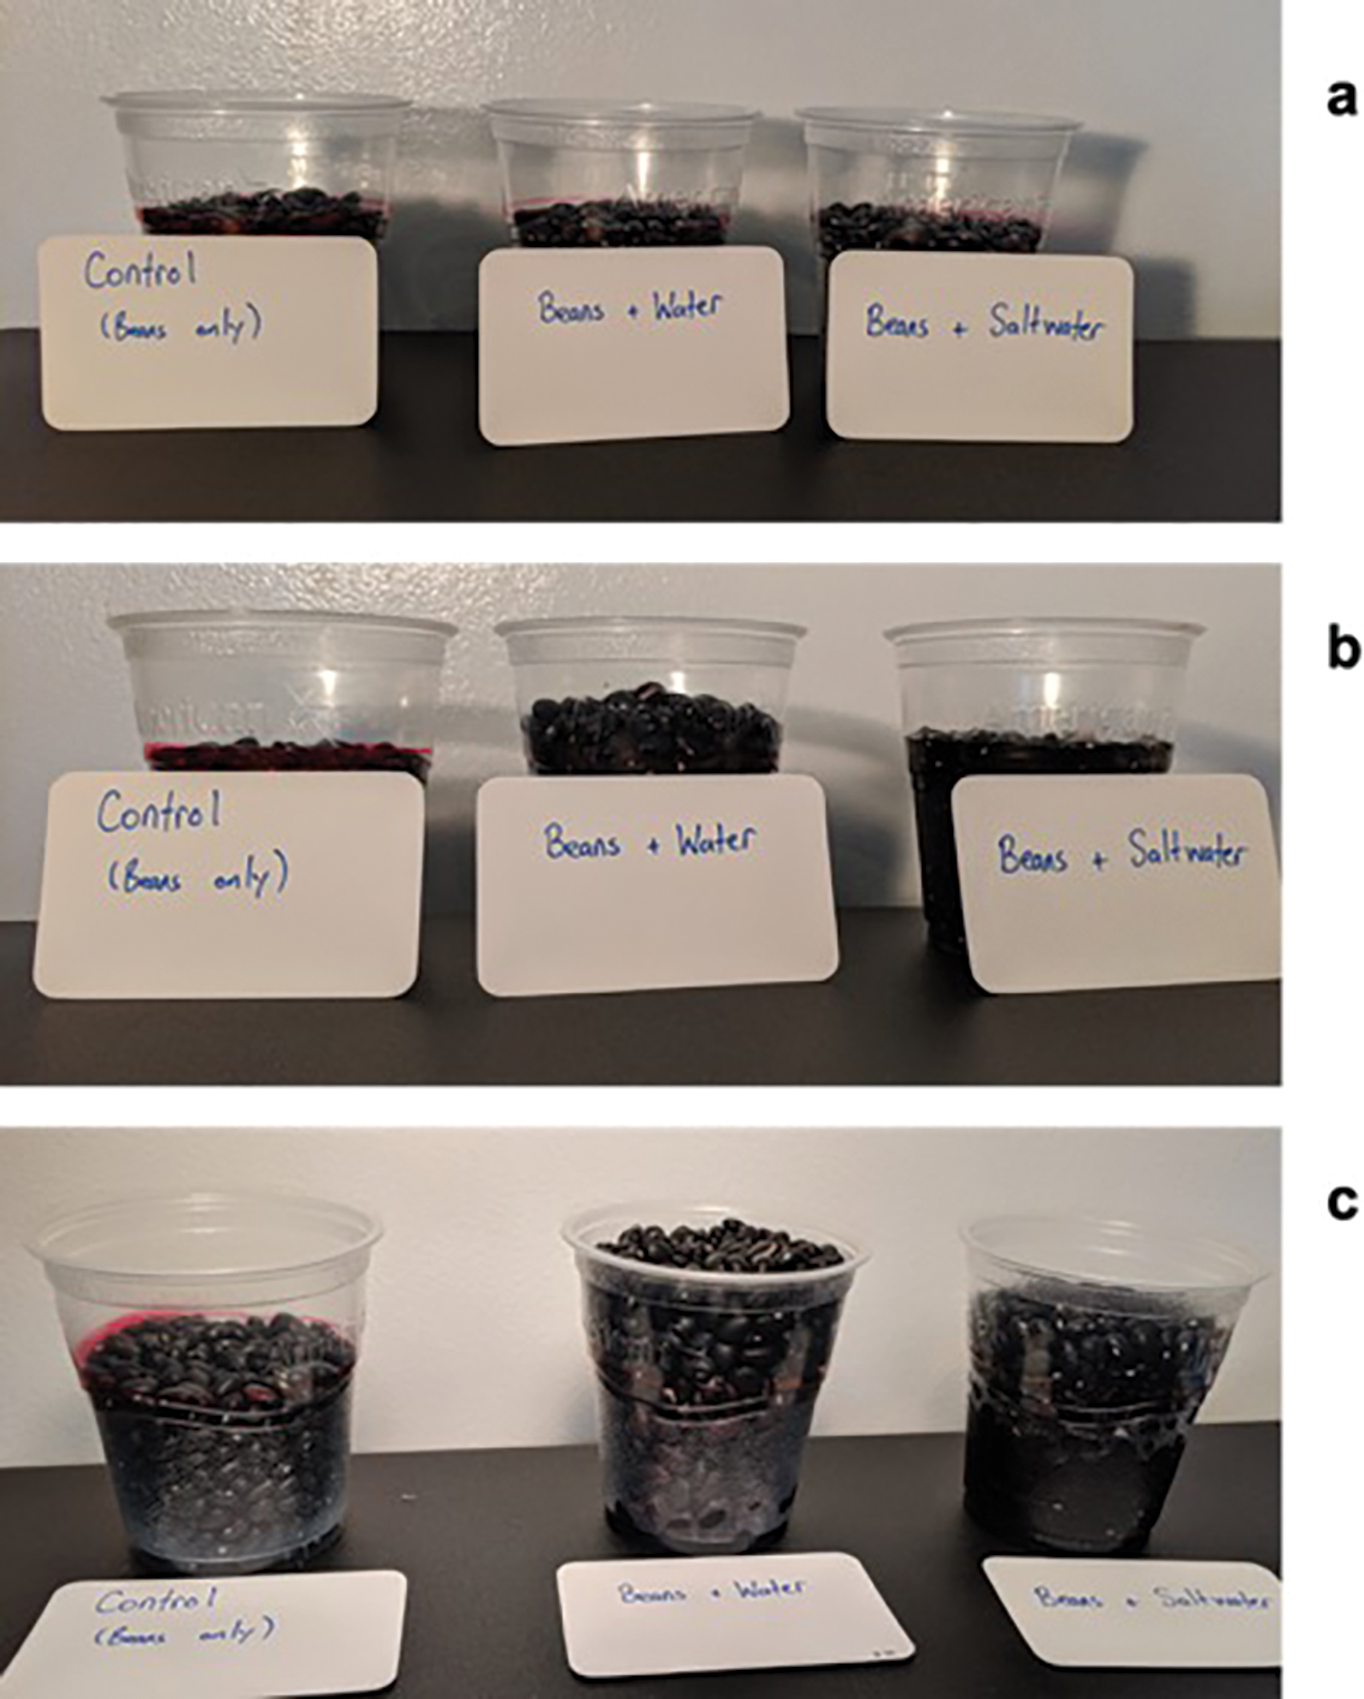
Instruct students to write a procedure for an experiment that will run overnight; students take initial measurements and set up their experiments in class, then return the next day to record and analyze results. Figure 2a shows one setup that will work: one control cup with 150 g of dry beans (~200 ml), a second with 150 g of dry beans and 75 ml water, and a third cup with 150 g of dry beans and 75 ml of salt solution. Ask students to submit their procedures to you before they get materials; review submissions for the presence of appropriate controls, safety procedures, and a plan to measure the dependent variable. Once you approve plans, let students access their materials, take initial measurements of their beans’ volume, set up their treatments, and clean up.
Sample experimental setup and results
Some change will be visible in only 10–15 minutes (Figure 2b), so if time allows, allow students to make some follow-up observations as the day ends. The next day, let groups take final measurements of their beans’ volume (Figure 2c) and calculate the difference in volume for each set of beans.
Differentiation note: Groups who struggle to create a procedure are often helped by “hint cards,” index cards on which you have pasted a printed-out photo of one acceptable experimental setup. You might leave a few of these at the back of the room and let groups who need the extra help borrow one.
Explain
Have students share their results and identify trends across the groups. Students will note that the beans in freshwater absorbed nearly all the water and grew in size the most. Beans in salt water will have grown considerably less—liquid will remain in the cup, and the beans may look somewhat shriveled. Control trials (i.e., beans that have been in a cup with no liquid) will not change in volume. Students also often note that the beans exposed to tap water are somewhat softer—some may even have ruptured.
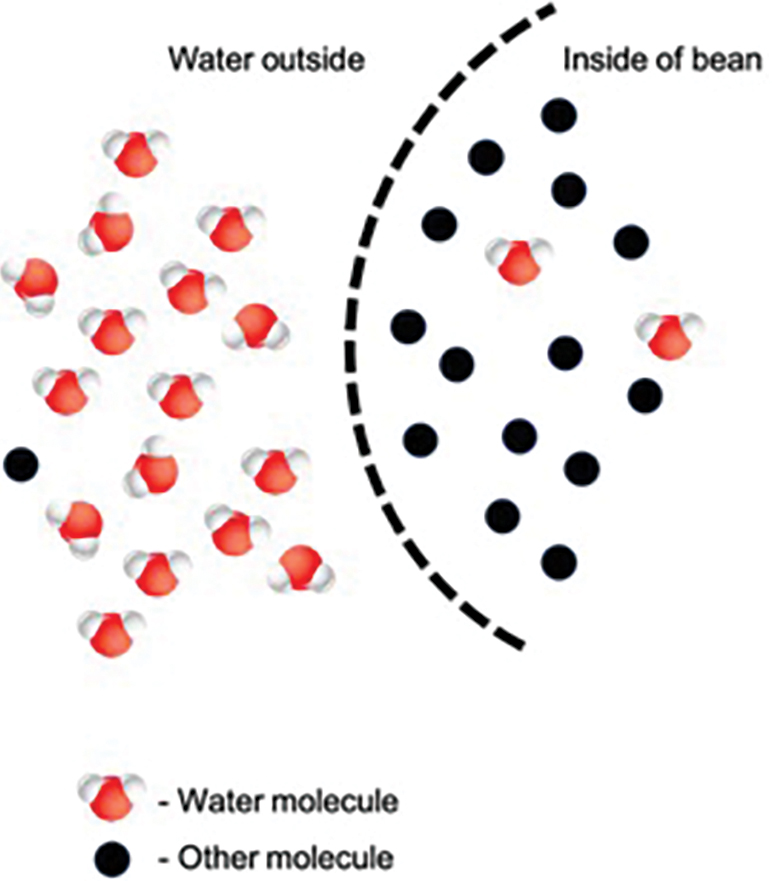
Ask students to provide their best explanations as to what caused the changes that took place. Build on their ideas to explain that the beans have provided us with a model of a cellular process called osmosis, and that the beans’ seed coats have acted like a cell membrane. Tell students that osmosis is the movement of water across a membrane from a place where there is more water (compared with other molecules) to a place where there is less water (compared with other molecules). Ask students to guide you in creating a diagram like the one in Figure 3 to illustrate what happened to the beans in the tap water condition. Have students explain how the movement of molecules could explain the results of their experiments.
Diagrammatic representation of osmosis
Tell students that the technical term for the ratio of other molecules to water molecules (students might colloquially refer to this as the “amount of other stuff dissolved in the water”) is concentration and tell them to revise their definitions of osmosis to include this new vocabulary.
Then ask students: Why didn’t the beans in salty water absorb water equally quickly? Look for the answer that the salt water already has a lot of other stuff in it—namely, dissolved salt ions! Less water is needed to enter the beans for there to be roughly equal amounts of water and other stuff—that is, equal concentrations—inside and outside the beans. Water can diffuse through cell membranes, but many other particles cannot because the cell membrane is semi-permeable. (Note that—just as with the egg in corn syrup—the solutes inside and outside of the “cell” are not the same. Concentration for the purposes of osmosis depends only on the number of particles dissolved in the water, not their type.)
Finally, ask students to predict what would happen to red blood cells in a high concentration salt solution and in distilled water (which has virtually no other molecules dissolved in it). Show students a video of red blood cells in concentrated saltwater and in distilled water (see Resources), providing narration as needed to ensure students can tell what is going on. As a check for understanding, ask students to diagram a model or write about what happened and how water is moving into or out of the cells throughout the video.
Elaborate
As a follow-up, ask students to hypothesize about whether water temperature affects osmosis, and why. Then, conduct a quick test. Prepare a quart of ice water (0°C, 32°F) and another of boiling-hot water (100°C, 212°F). Drop 100 ml of beans in each, and compare their volumes after 5–10 minutes of soaking. Additionally, have students make qualitative observations of the beans (and the remaining liquid) after this time. The beans in the hot water will increase in size much more than the other beans, and their seed coats will be the most changed. Push your students to connect this phenomenon to the higher kinetic energy of molecules of hot water. Higher kinetic energy means molecules are moving faster, which ends up resulting in more frequent collisions with the membrane and ultimately more opportunities to pass through the membrane.
Additional options: Time and materials permitting, you could have students conduct this experiment in small groups. You can also add a room temperature trial to the mix. However, keep in mind that a large volume of water is necessary to maintain the temperature differential between the trials for the entire soaking time.
Evaluate
Ask students, in light of these experiments, why recipes for cooking beans frequently call for an overnight soak in cool water or soaking the beans for an hour in water that has been brought to a boil. Then, have students investigate another culinary use of osmosis (salt-curing meats, pickling vegetables, etc.) and draw a picture of how osmosis, and for that matter diffusion, are used in producing many of the preserved foods we enjoy.
Conclusion
Understanding osmosis can be challenging, but students who see the process firsthand and discuss their results using appropriate representations have a better chance of developing an enduring understanding (Friedrichsen and Lankford 2012). Though some components of osmosis (such as its connection to the second law of thermodynamics) are beyond the scope of this lesson, it nonetheless provides a powerful model for understanding concentration and the movement of water across membranes.
Safety notes
Chemical splash goggles and gloves should be worn when using liquids. Only the teacher should handle boiling or hot water, and they should wear appropriate protective gear. Work in a clear, unobstructed area to minimize the possibility of spills or collisions. Wash hands after handling uncooked eggs. No part of the activity should be ingested.
General Science Interdisciplinary Labs Lesson Plans Teaching Strategies Middle School