
feature
Integrating Crosscutting Concepts and Literacy Strategies to Support Visual Literacy
Science Scope—July/August 2021 (Volume 44, Issue 6)
By Eric Brunsell, Elizabeth D. Alderton, and Josh Morris

CONTENT AREA All science content areas
GRADE LEVEL 5–9
BIG IDEA/UNIT Using the crosscutting concepts and common literacy strategies to support student understanding of visual representations
ESSENTIAL PRE-EXISTING KNOWLEDGE An introduction to the crosscutting concepts is necessary if students do not have previous exposure
TIME REQUIRED Varies; 10 minutes to an entire class period
COST No cost
SAFETY No safety issues
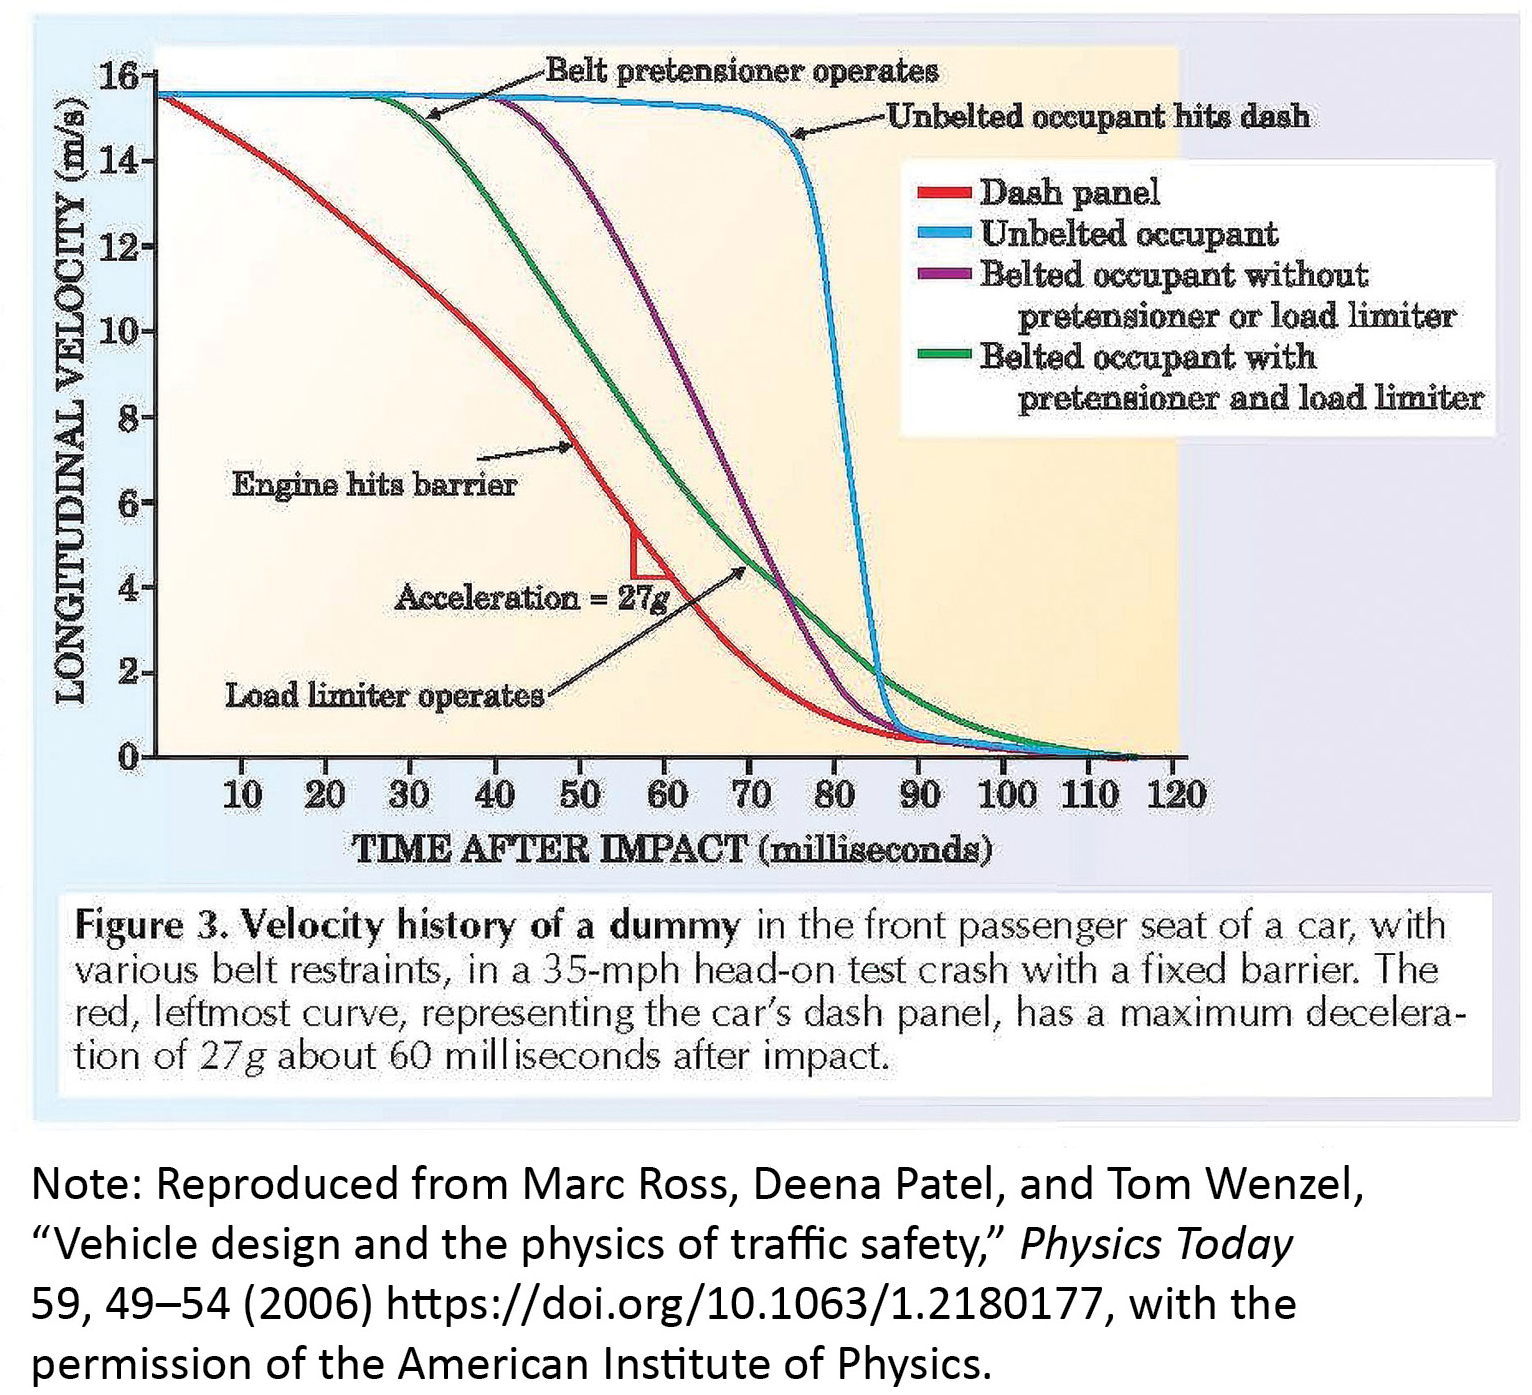
Whenever possible, we think it is important to engage students with data from real-world applications of the science concepts that they are learning. For example, after students have developed a basic understanding of Newton’s law, the first author likes to challenge students to interpret a graph that shows the change in velocity of a passenger during a head-on crash (see Figure 1).
Visuals such as the one in Figure 1 are found throughout textbooks, sometimes as often as once a page (Canham and Hegarty 2010). Such visuals can provide different ways of representing information that can positively contribute to a text’s accessibility for diverse learners (Rose and Meyer 2002). Unfortunately, there is growing evidence that students often have inaccurate understanding of these visuals (Florax and Ploetzner 2010). In this article, we describe an approach to improving students’ visual literacy skills by combining prompts based on the Next Generation Science Standards (NGSS; NGSS Lead States 2013) crosscutting concepts and three research-based literacy skills including making connections (visual to self, visual to text, and visual to inquiry), summarizing, and writing to learn. We provide a series of specific thinking prompts to encourage students to actively use crosscutting concepts and common literacy strategies while making sense of graphs, infographics, illustrations, and other visual representations of science information.
Crosscutting concepts
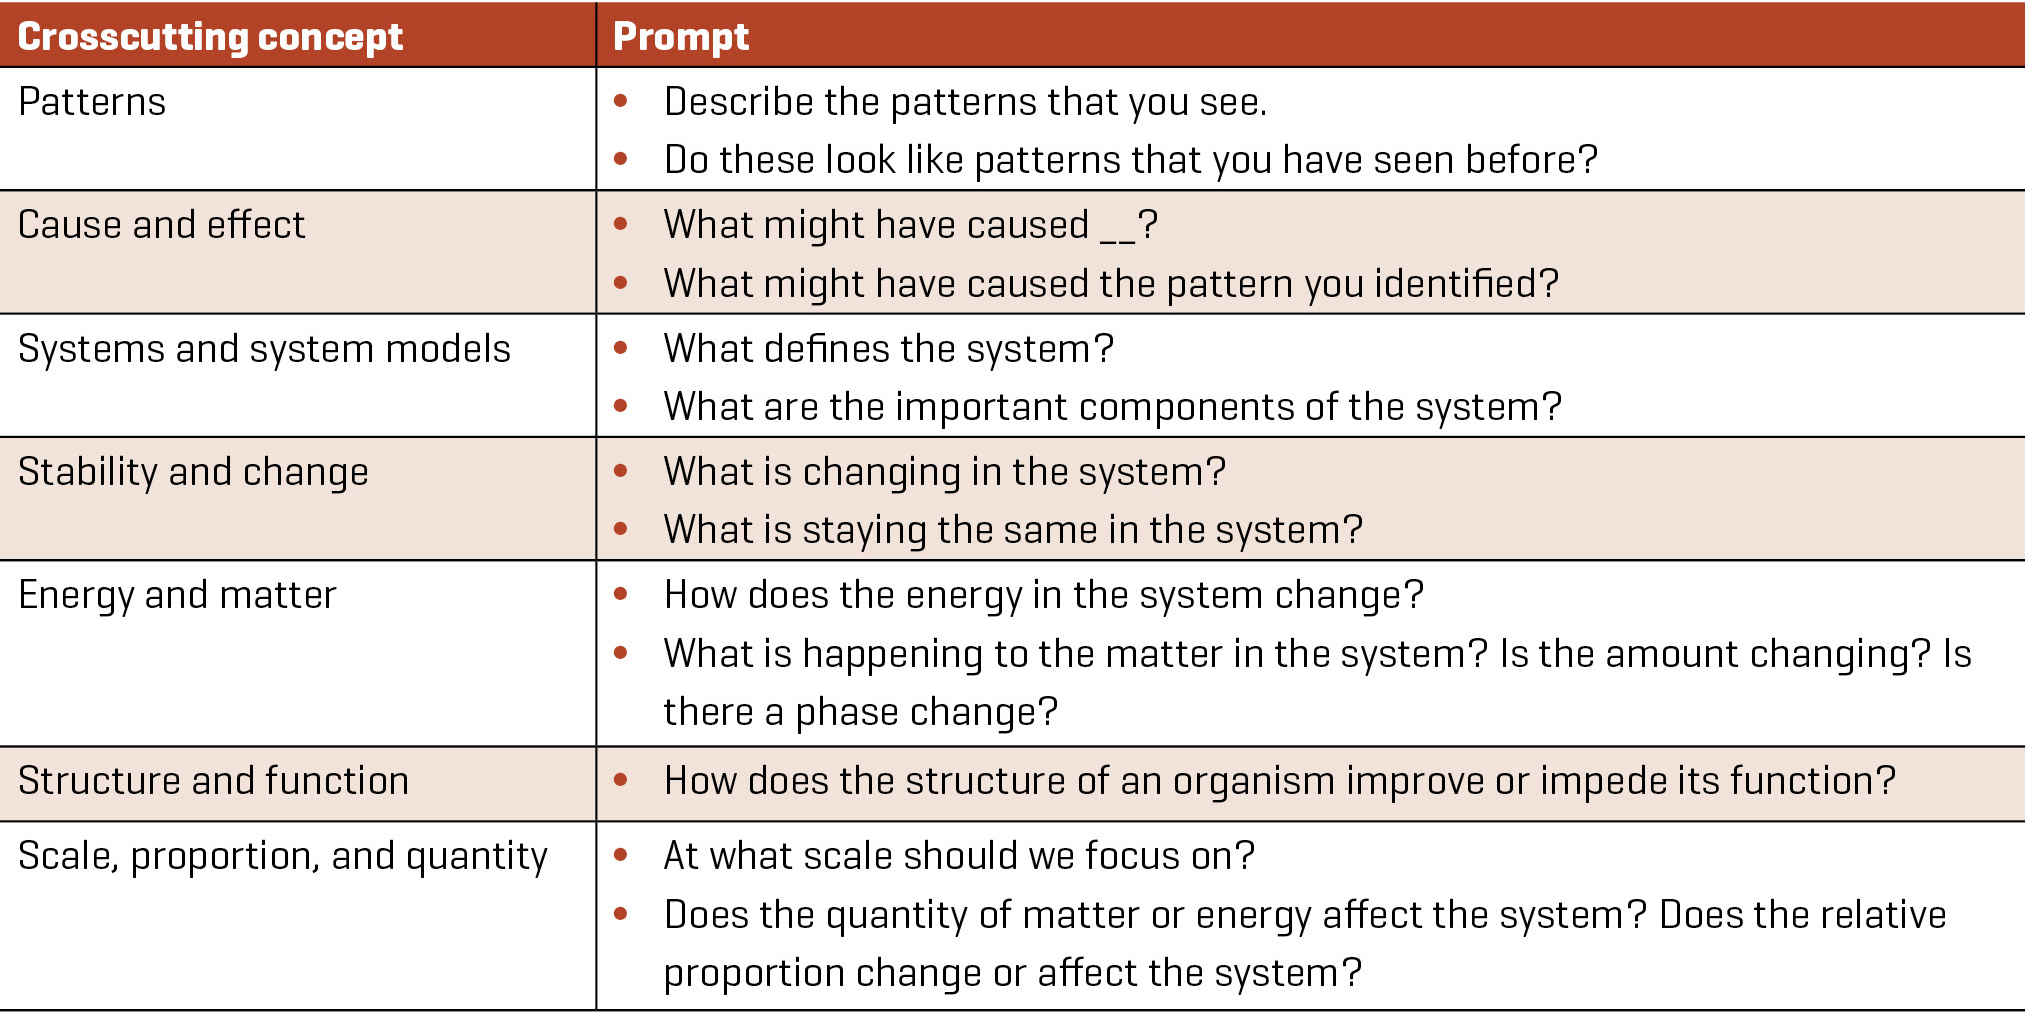
The crosscutting concepts in the NGSS are often viewed as ideas or themes that provide an organizing framework for connecting knowledge in the sciences. However, the crosscutting concepts also provide an excellent framework for approaching scientific phenomena that are new to us (Governor, Bowen, and Brunsell 2016). If we view an image returned from the surface of Mars, we can attempt to make sense of that image by using the crosscutting concepts: What is the scale of this image? Is there evidence that matter on the surface is moving? Do any patterns resemble other patterns that I have seen? Table 1 shows how each crosscutting concept can be used as a prompt to interrogate phenomena.
Coupling these prompts with literacy strategies allows students to actively use the crosscutting concepts to understand visual representations. The use of crosscutting concepts with literacy strategies promotes purposeful discussion, repeating organizational structures, and multiple representations of information. These strategies are helpful to all students and are important supports for the success of English language learners and students that have reading challenges (Brunsell, Kneser, and Niemi 2014).
Making connections
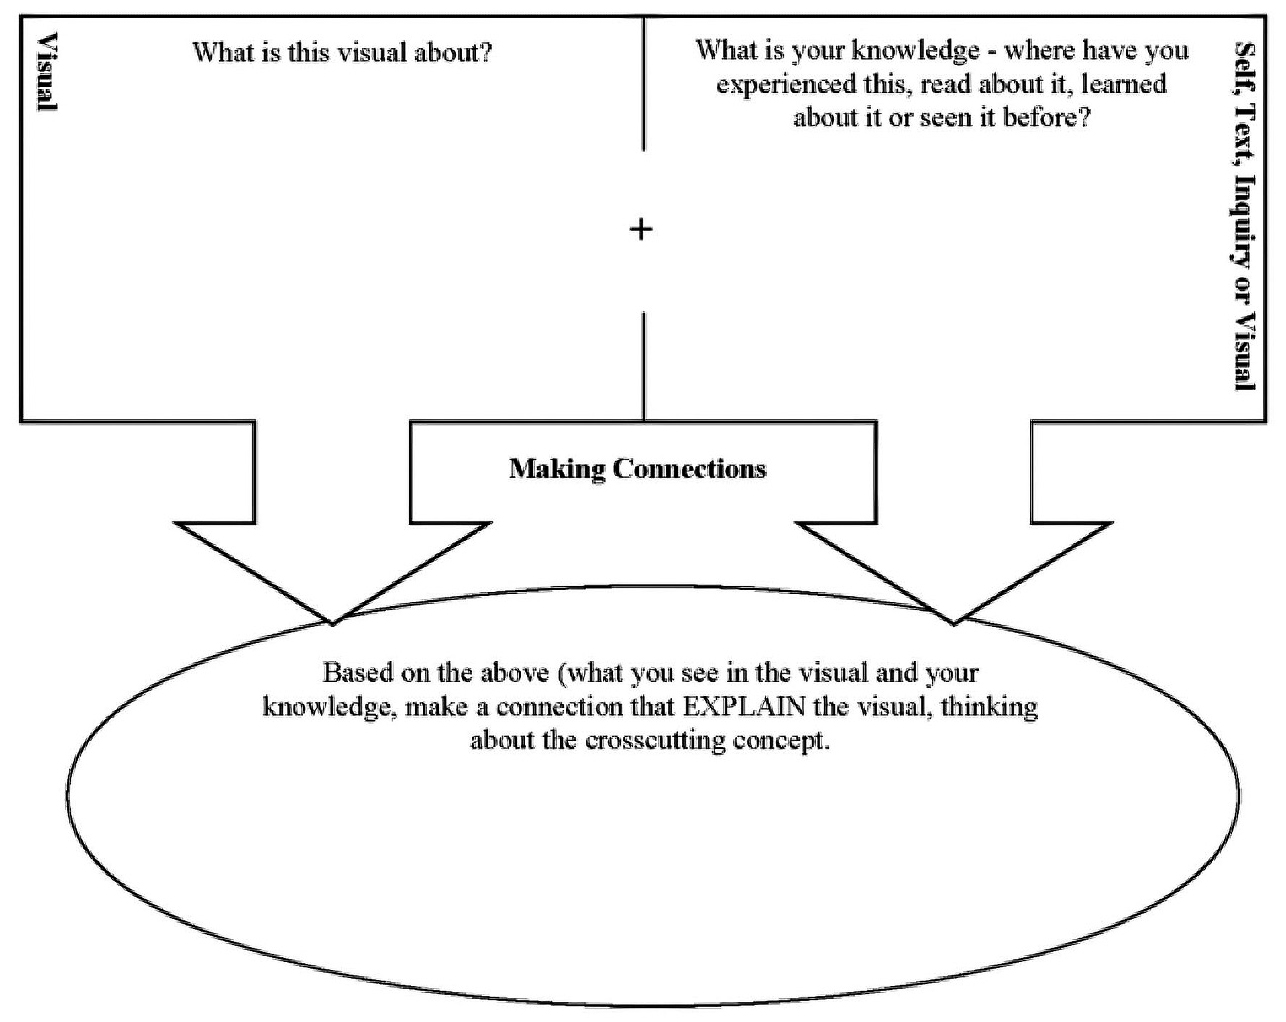
Expert thinkers make connections between visual representations that they are trying to understand and their previous knowledge, the text that the visual is situated in, and the science experiences they have had. The importance of these connections for comprehension of text has been shown over decades of research (e.g., Keene and Zimmermann 1997). Figure 2 provides an example graphic organizer that can be used to help students make connections.
Visual to self
Students make connections between visual representations and themselves when they think about new information in the context of their personal experiences. Teachers can promote connections by asking questions such as: When have I seen this before? Does this remind me of something I have experienced? Have I gone somewhere that relates to this? For example, if students are looking at an illustration of sound waves, they could be prompted to discuss what they have seen and felt when standing next to a loud speaker and use those experiences to describe the transfer of energy by sound (crosscutting concept).
Visual to text
Science textbooks commonly include visual representations alongside text. Students should make explicit connections between a visual and what they have read. For example, in a textbook reading on ecosystems you can ask students to explain how the figure of a food web illustrates energy flow through the system (crosscutting concepts).
Visual-to-text connections can also be made between new visuals and what they have read previously. Successful students should ask themselves: What do I already know about this topic?, Have I read about . . . ?, and What is different or the same in this visual than what I read?
Using the same visual-to-text strategies to identify connections between different visuals (visual to visual) can improve their comprehension and their reasoning about the diagram (Miller, Cromley, and Newcombe 2016). For example, if students view a weather map of a region, they will be better able to understand the physical conditions at a location if they can make connections to images of cloud formations and a data table showing temperature change. The crosscutting concept of cause and effect can then help students explain the relationships between these different observations.
Visual to inquiry
Making connections between visual representations and scientific investigations that students conducted supports deeper understanding of a phenomena. For example, viewing a drag race and connecting it to investigations using motion detectors could help students better understand concepts related to acceleration and velocity. Students can also be prompted to make connections between visuals and previous investigations through questions taken directly from the crosscutting concepts prompts (see Table 1).
Summarizing/Synthesizing
The first step in summarizing information represented visually is to survey the visual by identifying the heading, title, labels, trends, scale, and other features to determine what the visual is about (Serravallo 2015). Prompts related to the crosscutting concepts of scale, proportion, and quantity systems and system models can focus student thinking on what is being represented. For example, in a classic predator–prey graph, students can use the axis labels and title to define the system being studied (the two animals) and explain that the graph is showing how the quantity of the two animals is changing.
Self-questioning techniques using prompts from the crosscutting concepts help students identify more detailed information. For example, students should ask themselves if they can identify any patterns in the visual, or if changes in the amount of matter or energy are important to understanding the phenomenon being represented. If students are viewing an illustration, it could be important for them to ask themselves if the form of the object or organism being represented could help explain its function. Finally, they should ask themselves if any cause-and-effect relationships could explain what they see in the visual.
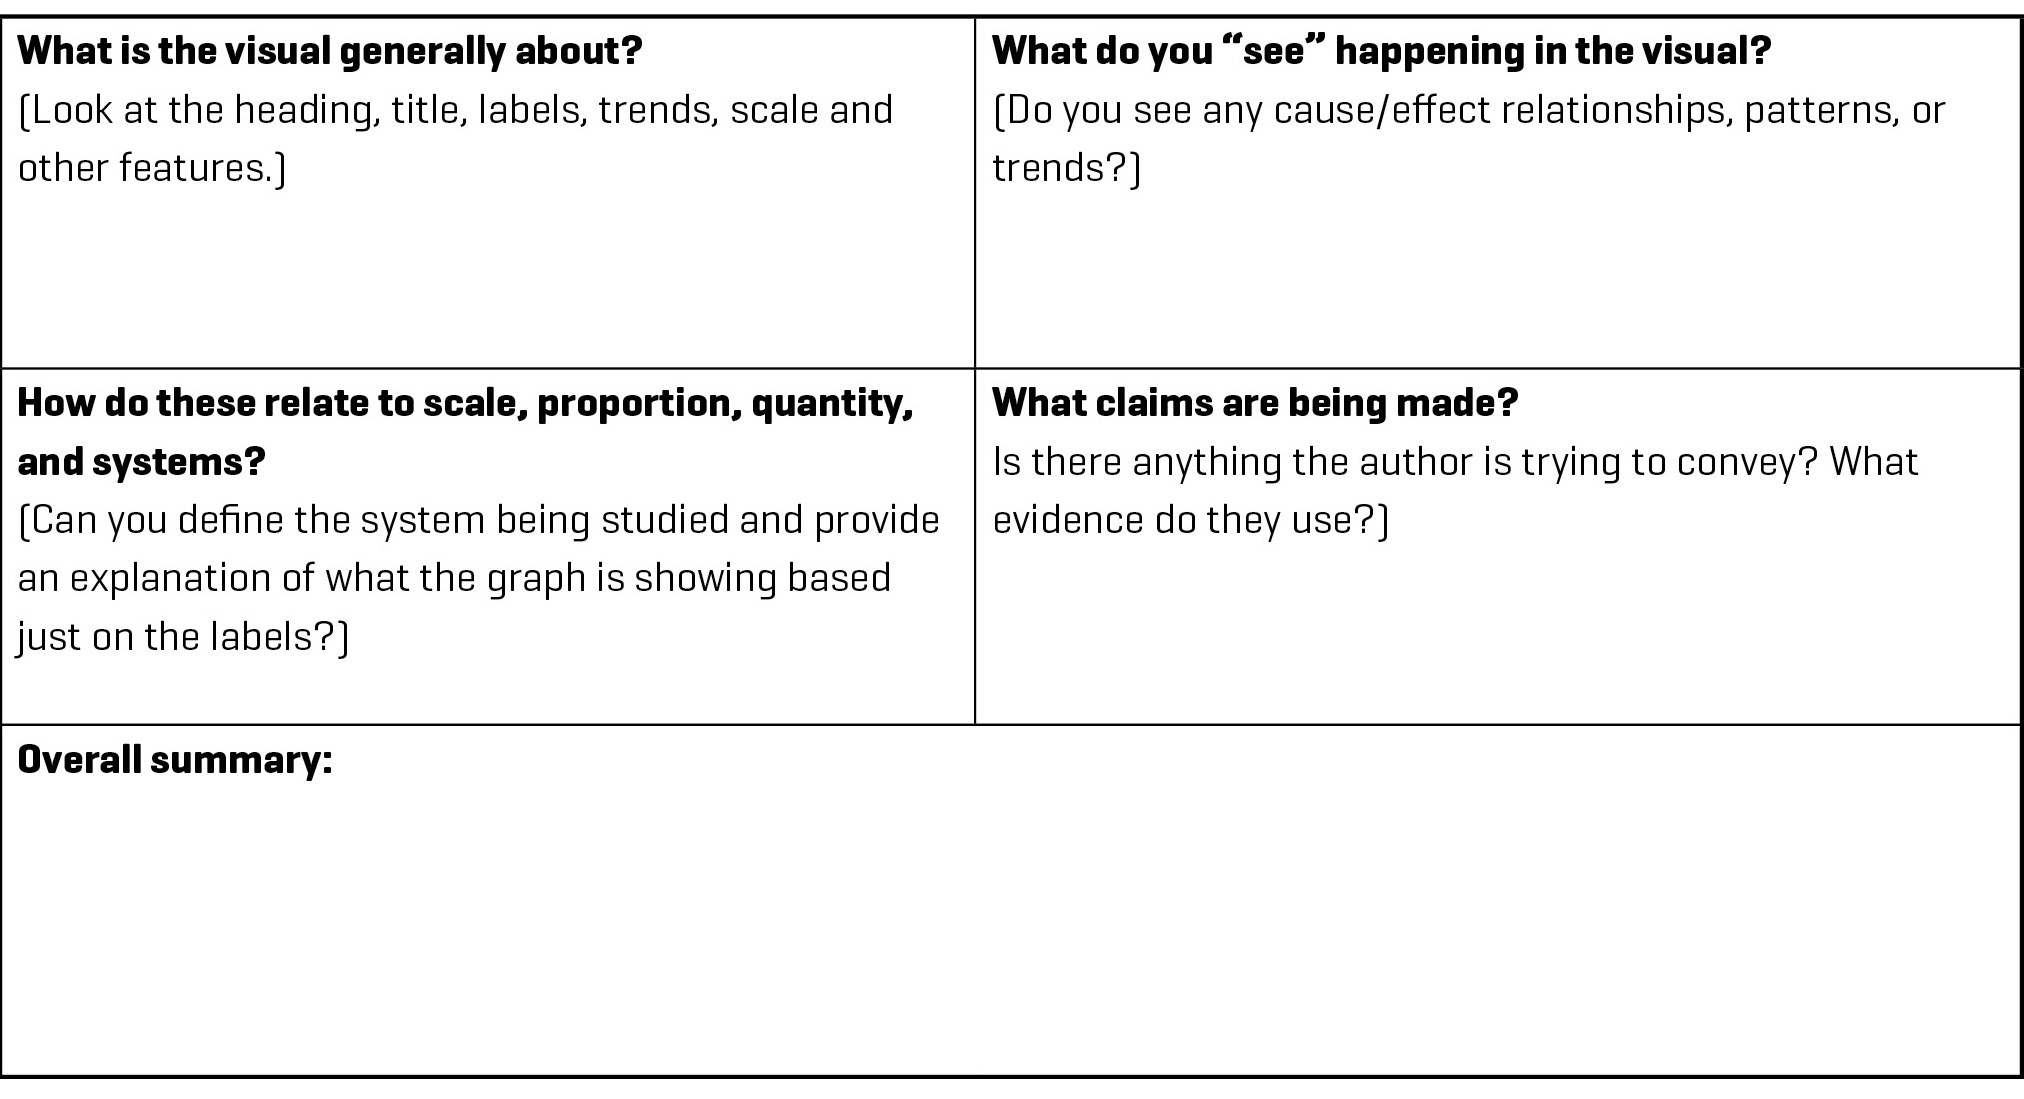
When students are ready to synthesize details into a summary of the visual, they should be able to discuss the main idea that the author is trying to convey in the visual or describe the claims that they can make about the visual. Teachers can support this final step by providing sentence starters such as, “This graph is about [topic], and shows [detail] and [detail].” A more complex sentence starter adds in additional analysis. For example, “This graph is about [topic], and shows [detail] and [detail], which indicates [claim]. This claim is supported by [evidence from the graph].” Figure 3 is an example graphic organizer that can be used to help students summarize and synthesize information presented visually.
Writing to learn
Writing as a means to learn about text and visuals in the science classroom helps students develop their understanding of scientific concepts and exposes their scientific thinking (Fulwiler 2011). Using the crosscutting concepts while writing about visuals encourages students to focus on the most salient pieces of the representation and not be distracted by “seductive details” (Sanchez and Wiley 2006). For example, students learning about plate tectonics often view illustrations of the Earth showing plate boundaries and the direction of movements of plates and maps identifying volcanic activity or seismic activity across the globe. Students will better understand these visual representations if asked to write about patterns to focus them on the interaction between plates and resulting volcanic or seismic activity or asked to write about the change of energy and matter (stability and change; energy and matter) at plate boundaries. Finally, having students identify and write about the cause-and-effect relationships between plate movement, plate boundaries, and volcanic or seismic activity will solidify their understanding of plate interactions.
Our conception of “writing” can be expanded to include student-created visual representations of information in graphs, charts, annotated illustrations, and informal doodles. For example, when students are learning about the heat, they could be asked to draw an annotated illustration of a lava lamp to demonstrate their understanding of conduction, convection, and radiation.
Integrating strategies in an instructional sequence
Integrating these strategies into your teaching requires consideration of your teaching goals at different times during an instructional sequence. If you are using these strategies in a 5E instructional model, implementation in the Engage phase will look different from implementation in the Explain phase.
Engage
The goal in this phase is to gain student interest in the content and allow them to begin making sense of a phenomenon by using their previous knowledge. During this phase, the teacher also gains valuable knowledge about strengths as well as gaps in student knowledge. Visual literacy strategies used in this phase should focus on helping students activate their prior knowledge by making connections and using crosscutting concepts question frames.
Explore
In this phase, students are developing and testing explanations related to the phenomenon being studied. Visual literacy strategies can be used similarly to the Engage phase, but also to draw attention to their ideas and the ideas presented by the rest of the class.
Explain
During the Explain phase, students are comparing their understanding to scientific explanations and theories. The use of visual literacy strategies in this phase is critical for helping students comprehend graphs and other visual representations presented in textbooks, simulations, or other sources.
Elaborate/Extend
In this phase, students apply their new understanding of scientific concepts in new situations. This phase provides an excellent opportunity for using these visual literacy strategies to scaffold students’ abilities to use their knowledge to comprehend complicated applications of scientific concepts. The initial example of the collision graph at the beginning of this article provides an example of how students can apply their new understanding of Newton’s laws to explain vehicle safety features.
Evaluate
Throughout the instructional sequence, teachers monitor student learning. Visual literacy strategies can be used to guide students and to help them focus their thinking. Students should be able to demonstrate their understanding of new knowledge as they interact with and think about the visuals, especially with supports such as summarizing and making connections with graphic organizers.
Incorporating strategies within a lesson
When incorporating these strategies into an individual lesson, it is important to include sense-making tasks before, during, and after viewing (Duke and Pearson 2002). We can use our initial example of the complicated collision graph to illustrate how to structure a lesson focused on comprehending visual representation of information.
Before
Before showing students the collision graph, you can help students connect to their previous experiences and knowledge by asking them to talk about seat-belt use and their explanations for how seat belts protect people during an accident. Then, follow with questions that focus students on relating their ideas to crosscutting concepts including energy, systems (the entire car and passengers), and stability and change. Finally, ask students to write a brief claim to connect the discussion about crosscutting concepts to seat-belt safety.
During
You can support students’ interpretation of the graph by using questions focused on the crosscutting concepts as they synthesize and summarize information. For example, a prompt about scale, quantity, and proportion helps students identify what is being measured on each axis and what units are being used. You can then connect those units to students’ previous knowledge by adding the corresponding velocity in miles per hour to a few of the labels. Next, ask students what relationships are being shown by each line on the graph. After understanding the differences between the lines, have students identify and explain the patterns that they see in those lines. Students should be able to discuss both the similarities and differences between each line on the graph. Finally, ask students to discuss with each other how they could describe the cause-and-effect relationships shown on the graph for collisions without seat belts, with seat belts, and with a seat belt with load limiter.
After
There are multiple opportunities for students to write about what they have learned to solidify and demonstrate their understanding of the graph.
- Students should return to the claim that they wrote about the connection between seat-belt use and the crosscutting concepts. They can revise their claim, write about how their ideas changed, and support the need for changing or clarifying their claim with evidence from the graph.
- Students could write about a previous experience with a car quickly coming to a stop. They should explain the role of a seat belt in keeping them safe. Encourage them to use scientific vocabulary and crosscutting concepts in their writing.
- Students can create annotated illustrations to show and describe what happens to a person in a collision wearing a seat belt and one that is not. Encourage students to annotate the illustration with sketches and text that shows their understanding of the graph.
Conclusion
The primary example used in this article was intentionally chosen to show how you can integrate crosscutting concepts with common literacy strategies to help students systematically approach a complicated graph or other visual representation. However, crosscutting concepts and literacy strategies can be used in different combinations to help students better understand any visual representation—from sophisticated infographics to simple animations—that they may come across as they learn more about the world around them. •
Eric Brunsell (brunsele@uwosh.edu) is an associate dean and a professor, Elizabeth D. Alderton is an associate dean, and Josh Morris is an assistant professor, all in the College of Education and Human Services at the University of Wisconsin Oshkosh.
Crosscutting Concepts Interdisciplinary Literacy Teaching Strategies Middle School