
feature
The “Magic” of Density
A Unique Take on the 5E Lesson
CONTENT AREA Physical Science
GRADE LEVEL 6–8
BIG IDEA/UNIT Density
ESSENTIAL PRE-EXISTING KNOWLEDGE A basic understanding of mass and volume. Some initial experience with creating and using models is recommended but not required.
TIME REQUIRED 6 50-minute class periods
COST $20–$30
SAFETY Safety goggles
The ratio of the mass of a substance to its volume, otherwise known as density, is rooted in many scientific principles taught in our science classes. The lessons described here allow students the chance to apply their knowledge about physical properties to explain why some things float while others sink. In them, sixth-grade physical science students investigated a “magic trick” that reveals how an object’s density can affect its behavior.
“Magic” of density lesson
We utilized the instructional model commonly known as the 5E Learning Cycle (Bybee et al. 2006). We know many instructors are familiar with this model, but we wanted to provide some background for those that are not. The 5E model breaks down instruction into five segments, each of which has a specific function and contributes to students’ overall understanding. The 5Es in the instructional model are: engagement, exploration, explanation, elaboration, and evaluation. When used effectively, the 5E model provides a sequence for science instruction that allows each phase to build on the last (Bybee et al. 2006). However, it should be noted that while the overall sequence of engage, explore, explain, elaborate, and evaluate should be maintained, teachers should be evaluating throughout all phases to ensure they understand where students are in their understanding. In addition, it may be appropriate to repeat some phases; for example, students might engage, explore, engage, explore, and explain, but this would still happen within the overall 5E sequence. This flexible nature of the 5E model played a large part in why we found that this lesson on density was well-suited for this instructional model.
Engage: Day 1 (10 minutes)
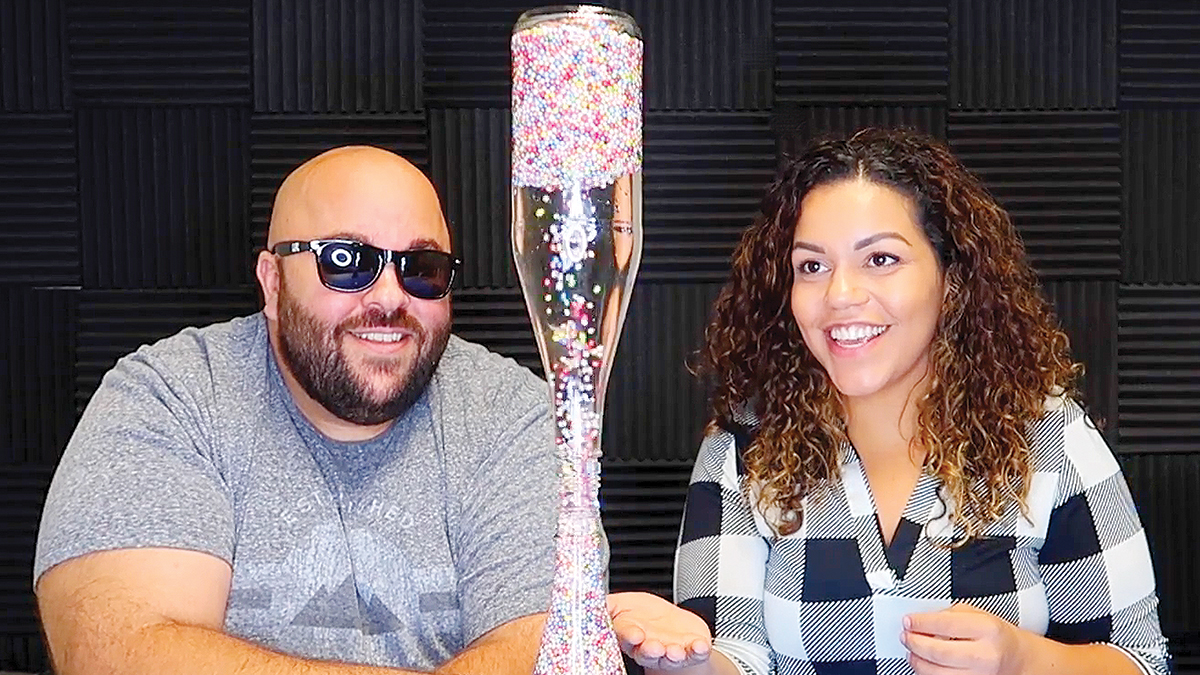
Grabbing students’ attention at the start of the lesson is key to ensuring participation. We suggest starting the lesson by performing a demonstration similar to that seen in a YouTube video by user EvanEraTV (see Online Resources) or by showing the YouTube video itself, specifically minutes 12:48 through 13:42 for this particular demo. The video shows a bottle with water being inverted over a bottle of Styrofoam beads. The beads “magically” switch places with the water. This serves as the lesson’s anchoring phenomenon.
If you chose to conduct the activity yourself, use two large glass or plastic bottles and fill one three quarters of the way full with water. Fill the other bottle halfway full with water and halfway full with Styrofoam beads. Carefully invert the water-only bottle so that the tops of each bottle are connected and watch as the beads from the bottle below rush upward into the top bottle! When the magic trick is complete, with all the Styrofoam beads settled above the water in the bottles, ask your students, “What did you notice? What do you think made this trick work?” Then, task your students with creating physical models to explore what caused the trick they just witnessed and ask that they write down any observations and/or questions they develop during their exploration. Rather than drawing a model initially, we chose to allow students to create a physical model to explore their own thinking (as described in the Explore section). We hoped this would allow students the opportunity to test out their ideas and to track their observations and questions about how the phenomenon works by interacting with the physical materials.
Explore: Day 1 (50 minutes)
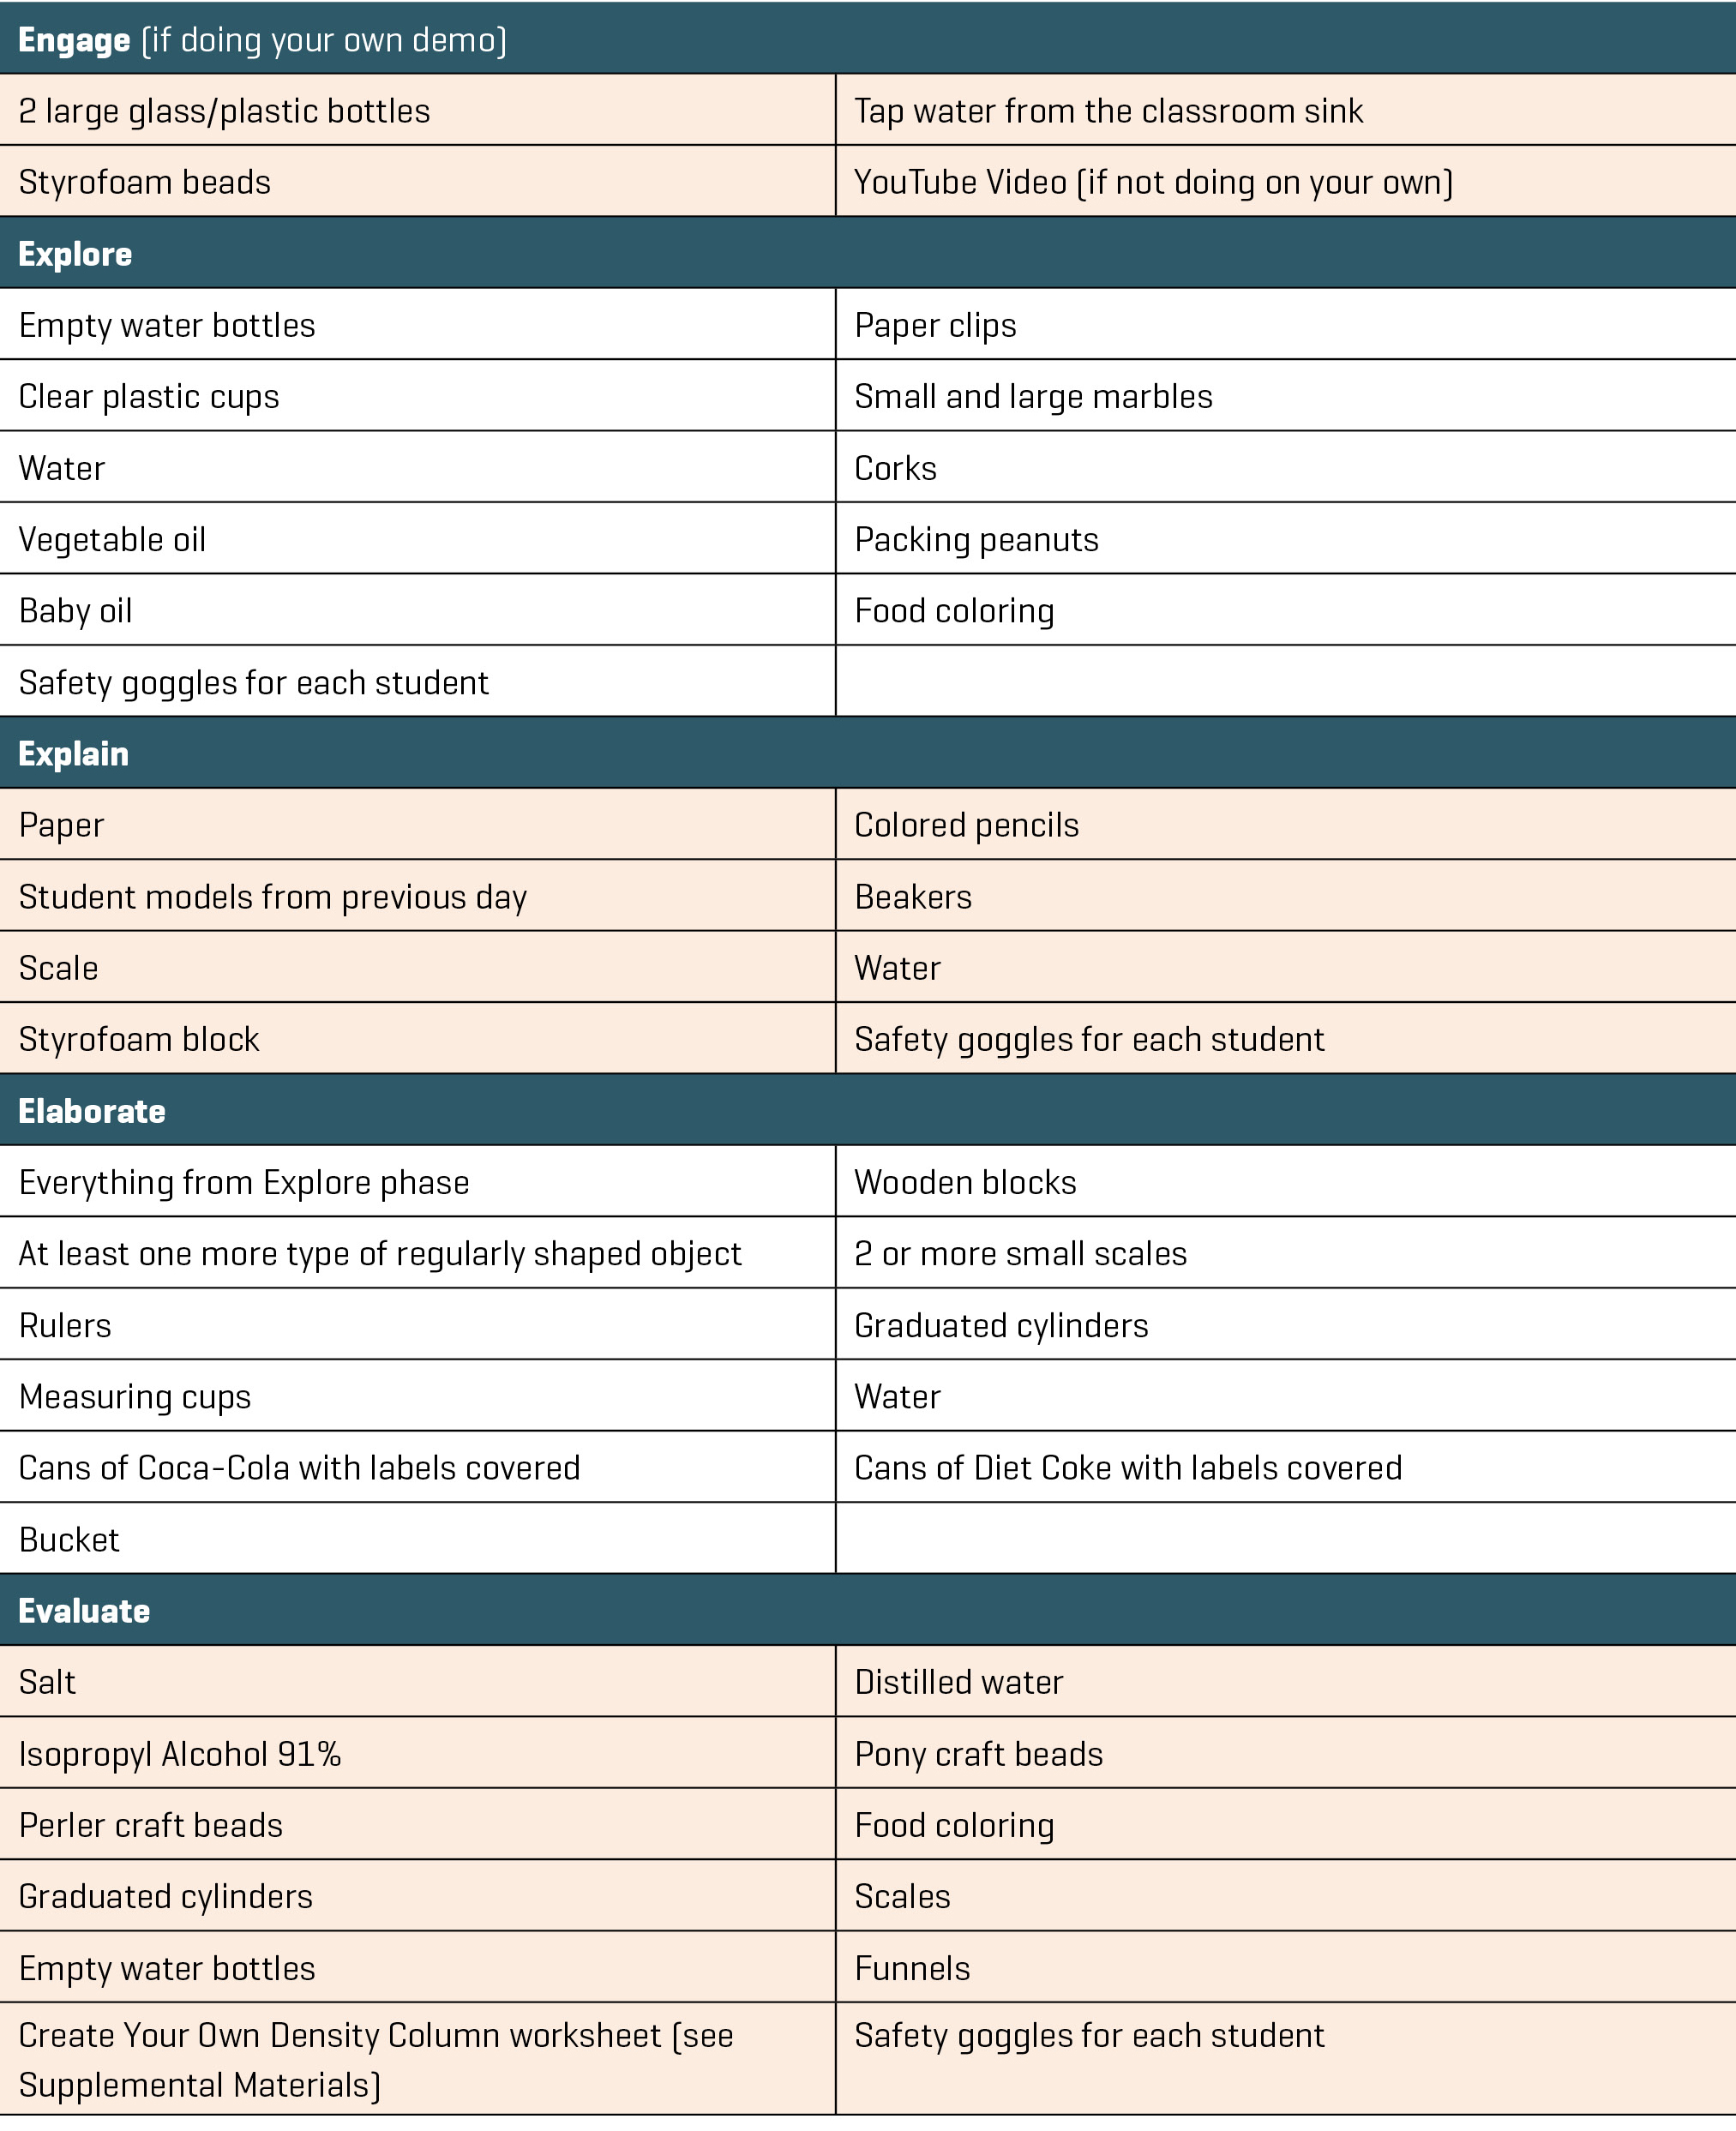
After introducing the phenomenon, students were given access to the necessary materials with which to create their models (see Table 1). All materials were carefully chosen with regard to each student’s reported allergies and medical conditions so that no items posed any dangers to students. Though none of the materials were toxic or dangerous, we still required students to wear safety goggles that we provided, as this taught and encouraged proper laboratory safety techniques. Students were limited to 15 minutes to create their physical models and record any observations they made or questions they developed.
In our classroom, several students were on the right track with their models; however, a few tried to recreate the magic trick using water bottles and small marbles, not understanding why the marbles weren’t rushing to the top of the water once the second bottle was inverted. Students who are on the right track will select materials that are less dense than the liquid they select for one of the bottles. You may see similar issues with your own students. Once students finished their models, they were encouraged to think-pair-share with their neighboring classmates, using their models to explain their thoughts for how the magic trick worked. The students were then allowed an additional five minutes to revise their initial models.
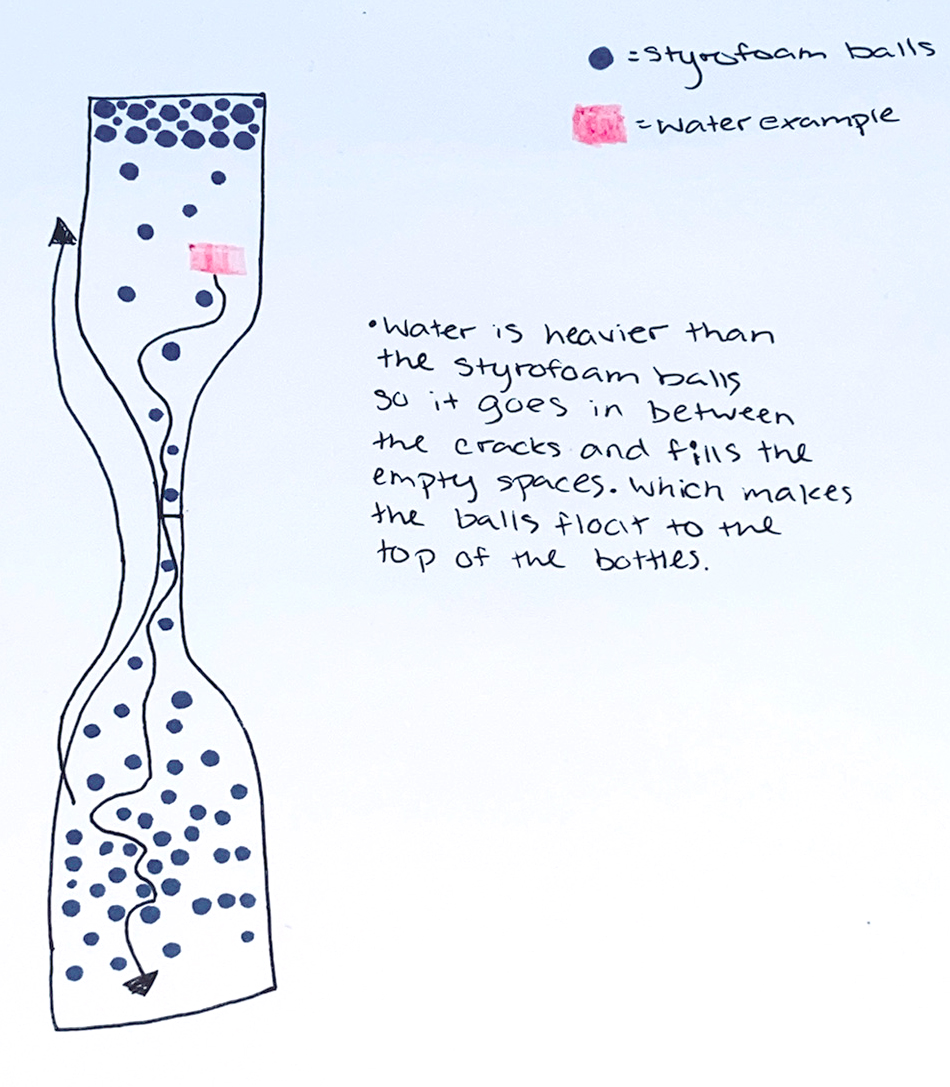
With the remaining 20 minutes of class, students were instructed to use their recorded observations from the first half of class to create models on paper to explain what they had learned through their exploration and what they think is happening in the magic trick. Figure 1 provides an example of one student’s completed paper model. In this example it is evident the student is confusing mass and density; this is one of the common misconceptions that students hold with this topic. It is important to make sure that the final models don’t represent this same thinking, but as a formative assessment, this first model helps elicit student ideas and other misconceptions students may be holding about these concepts at the end of this initial exploration. While students were creating their models, teachers walked among the tables and watched as students pieced together their explanations. This observation provided a sense of students’ current understanding of density. Circulating around the classroom also allowed the teacher to determine which models could be used to explain the magic trick most accurately and decide in what order students should share their ideas with the whole class the following day. At the end of class, student models were collected and stored in a safe place so students could use them the next day.
Explain: Days 2 and 3
(two 50-minute class periods)
To begin the second day of the lesson on density, we opened up with a whole-class discussion about what students learned the previous day. The class discussion addressed students’ explanations for how the magic trick worked, and during this time, students also shared their physical models with the class and used them to explain their predictions. Plan to spend about 20–25 minutes letting students explain their models and allowing other students to ask questions. The order in which you have students share may impact your discussion, so thinking about how you want to develop the concepts and what you observed on Day 1 will be important (Cartier et al. 2013; Ross and Davidson 2020). In addition, whether you have all students share, or just a select few, will also depend on the amount of time you have for the discussion.
For our discussion, we had multiple students share, but we saved two students who had more accurate ideas to share at the end. By starting with student models that were less complex and moving to models that were more complex, we structured the sharing for this discussion so that the complexity of the models would build, allowing us to add new ideas as we examined each new model. The next-to-last student to share created her model using a water bottle, two clear plastic cups, water, baby oil, and food coloring. She measured out equal amounts of the liquids in the two cups, mixed a drop of purple food coloring into the water, combined the liquids in the water bottle, sealed it, and shook it up. After a couple of minutes, the two liquids separated, leaving the baby oil on top of the water. Her prediction was:
The same relationship happens with the beads and the water in the magic trick. When I filled the cups, the one with water felt heavier than the one with baby oil. Since the oil sat on top of the water, I think that means the beads weigh less than the water in the magic trick, which is why they went to the top.
The last student to share used a similar method of explaining the phenomenon. He filled the bottom half of an empty bottle with torn-up packing peanuts, then poured water over them and watched as the packing peanuts rose to the top of the water. His prediction was:
Gravity pushed the water down through the cracks in the pile of packing peanuts. The peanuts are really lightweight and floated to the top of the water. The beads in the magic trick must be really light, too.
Both students created models that helped us segue into a deeper discussion on density. As students interact throughout the discussion, the teacher should also monitor what ideas are elicited and being shared. The ideas can be charted on a monitoring tool as suggested by Ross and Davidson (2020). These comments and ideas serve as a formative assessment of student thinking and identify where the teacher may need to reinforce or revisit ideas.
With the remaining 25 minutes of class, we wanted to build on the ideas brought up in the class discussion and lead the students to an understanding of the ratio of mass to volume that makes density. We did this by performing two small demos. For the first demo, we measured out 10 ml, 100 ml, and 1,000 ml samples of rubbing alcohol in premassed plastic beakers and asked students, “What is the same and different about these three samples?” We told the students it was rubbing alcohol and ensured that all students were wearing goggles. Students were then allowed to get close and examine the beakers but were not allowed to touch or hold them to ensure the alcohol did not get on skin. In addition, the beakers were covered with plastic wrap so the alcohol odor would not irritate noses or throats. Our students quickly responded, saying the similarity was that all three samples were room temperature rubbing alcohol, and the differences were the volumes and the masses of each beaker of rubbing alcohol. We used rubbing alcohol so we wouldn’t have a substance with a density of 1.00 g/ml—you can use any substance you want for this next discussion as long as the density is not 1.00 g/ml.
We then used a scale to find the actual mass in grams of the rubbing alcohol in each beaker and wrote the values down on the board along with the milliliter values for each volume. Next, we asked students if they could use the values on the board to find another similarity between the three samples. If students do not respond to this prompt, ask what they might do with the numbers in math class. We had a student suggest that we add the volume and mass values for each beaker and compare with the other two samples, but we explained that you cannot add or subtract values that have differing units. This led them to multiplication and division. Of course, multiplying the values does not produce a similarity between the three samples, nor does dividing volume by mass for the samples (as long as the density is not 1.00 g/ml). However, dividing mass by volume gives answers that are very close among the three samples (approximately 0.786 g/ml). Allowing students to explore these different methods for calculating may be the best choice for helping them find out that only one of the methods produces a pattern. Students may also bring up the idea of ratios in this discussion, and that is a good point to ask students to keep in mind as you move the discussion along. We left the values on the board and ended the class here, asking students to think about what this value could mean in preparation for the next class.
On day 3, we were still in the Explain phase of our lesson. We opened this class with a second demonstration, this time using Styrofoam. Plan to spend 25–30 minutes on this demo and ensuing discussion. From a block of Styrofoam, cut out one small, medium, and large piece to use as your three samples (e.g., 1 cm3, 10 cm3, 25 cm3). We suggest cutting them in cubes so they are easy to measure. As in the first demo, ask your students to compare and contrast the three samples. Our students again mentioned that all three were made of the same material and all three were different sizes. Use a scale to measure the mass of each sample. Our students recalled using volume the previous day and asked how to determine the volume of a solid. If your students do not, simply remind them of the properties they used when comparing the water samples in the first demo. We used this time to teach students how to calculate volume of the blocks by measuring the dimensions of the solid sample. When the masses and volumes for each sample are determined, write the values on the board as was done before in the first demo and work through the same process of finding a shared value between the samples by dividing the masses by their respective volumes (approximately 0.05 g/ml). The teacher should then open a discussion about what these shared values from each demo mean. We emphasized the observation that even though the rubbing alcohol samples had different volumes and the Styrofoam samples were different sizes, the rubbing alcohol samples and Styrofoam samples each shared similar ratios between their mass and volumes that is a value we call density. It is important students understand that this relationship between mass and volume does not change for a substance regardless of sample size. Building on these ideas, we defined density as the ratio between the mass of a substance and its volume.
To check for understanding, we then asked students what the density of 85 ml of rubbing alcohol and a fourth Styrofoam block were. Ideally, they will understand at this point that the density doesn’t change even though the mass and volume of the substance may change. If not, you may need to do some additional review before moving on to the next part of the discussion. It may help to graph the densities for students to see that doing so creates a straight line for each substance, with the slope of the line being the density. Depending on the level of your student, this approach may or may not help your student’s understanding.
After students were introduced to density, and the density values for rubbing alcohol and Styrofoam were determined, students were asked how they could use what they just learned to further explain the phenomenon that utilized water and Styrofoam beads. Our students realized they needed to determine the density of water. They found their calculations showed that Styrofoam had a lower density than water. We used this realization to guide students to their final understanding that the Styrofoam beads in the magic trick moved to the top of the water because Styrofoam has a much lower density than water.
Elaborate: Days 4 and 5 (two 50-minute class periods)
The fourth day of the lesson focuses on students learning to measure and calculate density themselves. We brought in the various household objects and liquids used to create the students’ initial models on the first day as well as a few regularly shaped objects (i.e., wooden blocks), at least two small scales, rulers, graduated cylinders, and measuring cups so students could calculate the densities of the substances. The volume displacement method was demonstrated to calculate the density of irregularly shaped objects. Irregularly shaped objects, like marbles or buttons, were slid into a graduated cylinder of water after recording the beginning water level, and the final water level was recorded. The difference between the two levels was recorded as the volume of the object. We chose to do this by using the marbles and the plastic buttons so our students saw the method used with different types of objects.
Students were then divided into groups and instructed to work in rotations to mass and measure each item before working as groups to calculate each item’s density. You can choose the best way to divide up your groups for your class. We chose to divide students into groups based on where their understanding was at the end of day 1. We chose to heterogeneously group so there were students with different ideas in the same group as they moved forward. We found this to be useful for students to continue questioning one another and building their understanding. However, you could choose to group differently depending on your students’ needs. For the liquids, we gave specific instructions on how to get the mass values: record the mass of an empty measuring cup, pour in your liquid, reweigh the cup with the liquid, and subtract the values (make sure to require the use of safety goggles to teach proper laboratory safety). This information is important not only for accuracy, but also in preparation for the last segment of the lesson. As each group finished their calculations, we walked by with precalculated values to compare their answers. If a group’s values were vastly different from the correct ones, we spent two to three minutes clarifying the misconceptions.
In the last 10 minutes of class, students were given an exit ticket to complete that served as a formative assessment. The instructions included were to: (1) explain the steps necessary to measure the density of a paper clip, and (2) calculate the density of a cube with sides of 3.0 cm and has a mass of 15 g. Answers on the exit ticket allowed the teacher to gauge the confidence levels of students in regard to using multiple methods to determine the densities of varying substances.
On the fifth day, we continued our Elaborate phase of the lesson by introducing a new phenomenon. We placed two cans of dark-colored soda with their labels covered in a bucket of water at the front of the room. One can floated while the other sank, and we tasked students with figuring out which can was Diet Coke and which was regular Coca-Cola using density. Students were allowed to use any materials provided during their density calculations on the fourth day, and we provided additional cans of each soda (labels covered and the tops of the cans marked A or B) to be used in their investigations. Students were only told that can A is the one that floated and can B is the one that sank. Most students began attempting to measure the density of each using the graduated cylinders and scales available to measure the mass and volume of a sample of each. Depending on the availability of scales and glassware, allow 30–40 minutes for this activity. Students should come to the conclusion that Diet Coke is in can A because it has a density less than that of water, while Coca-Cola is in can B because it has a greater density than water. This activity serves as another formative assessment of student understanding of calculating density as well as using density to identify a substance. We used the rest of the class period to answer questions and go over any misconceptions that still remained.
Evaluate: Day 6 (50 minutes)
On the final day of the lesson, the goal is to assess students’ learning through another modeling activity. The students are tasked with creating a DIY column using seven unknown liquids (i.e., no distinguishing labels). Table 2 shows the liquids we used and their respective densities (see Amazing 9 Layer Density Tower in Online Resources), but these can easily be replaced depending on availability and/or cost. We recommend adding food coloring to the clear liquids (i.e., water and baby oil) so they are easily distinguished in the columns. Again, safety goggles should be required during this phase.
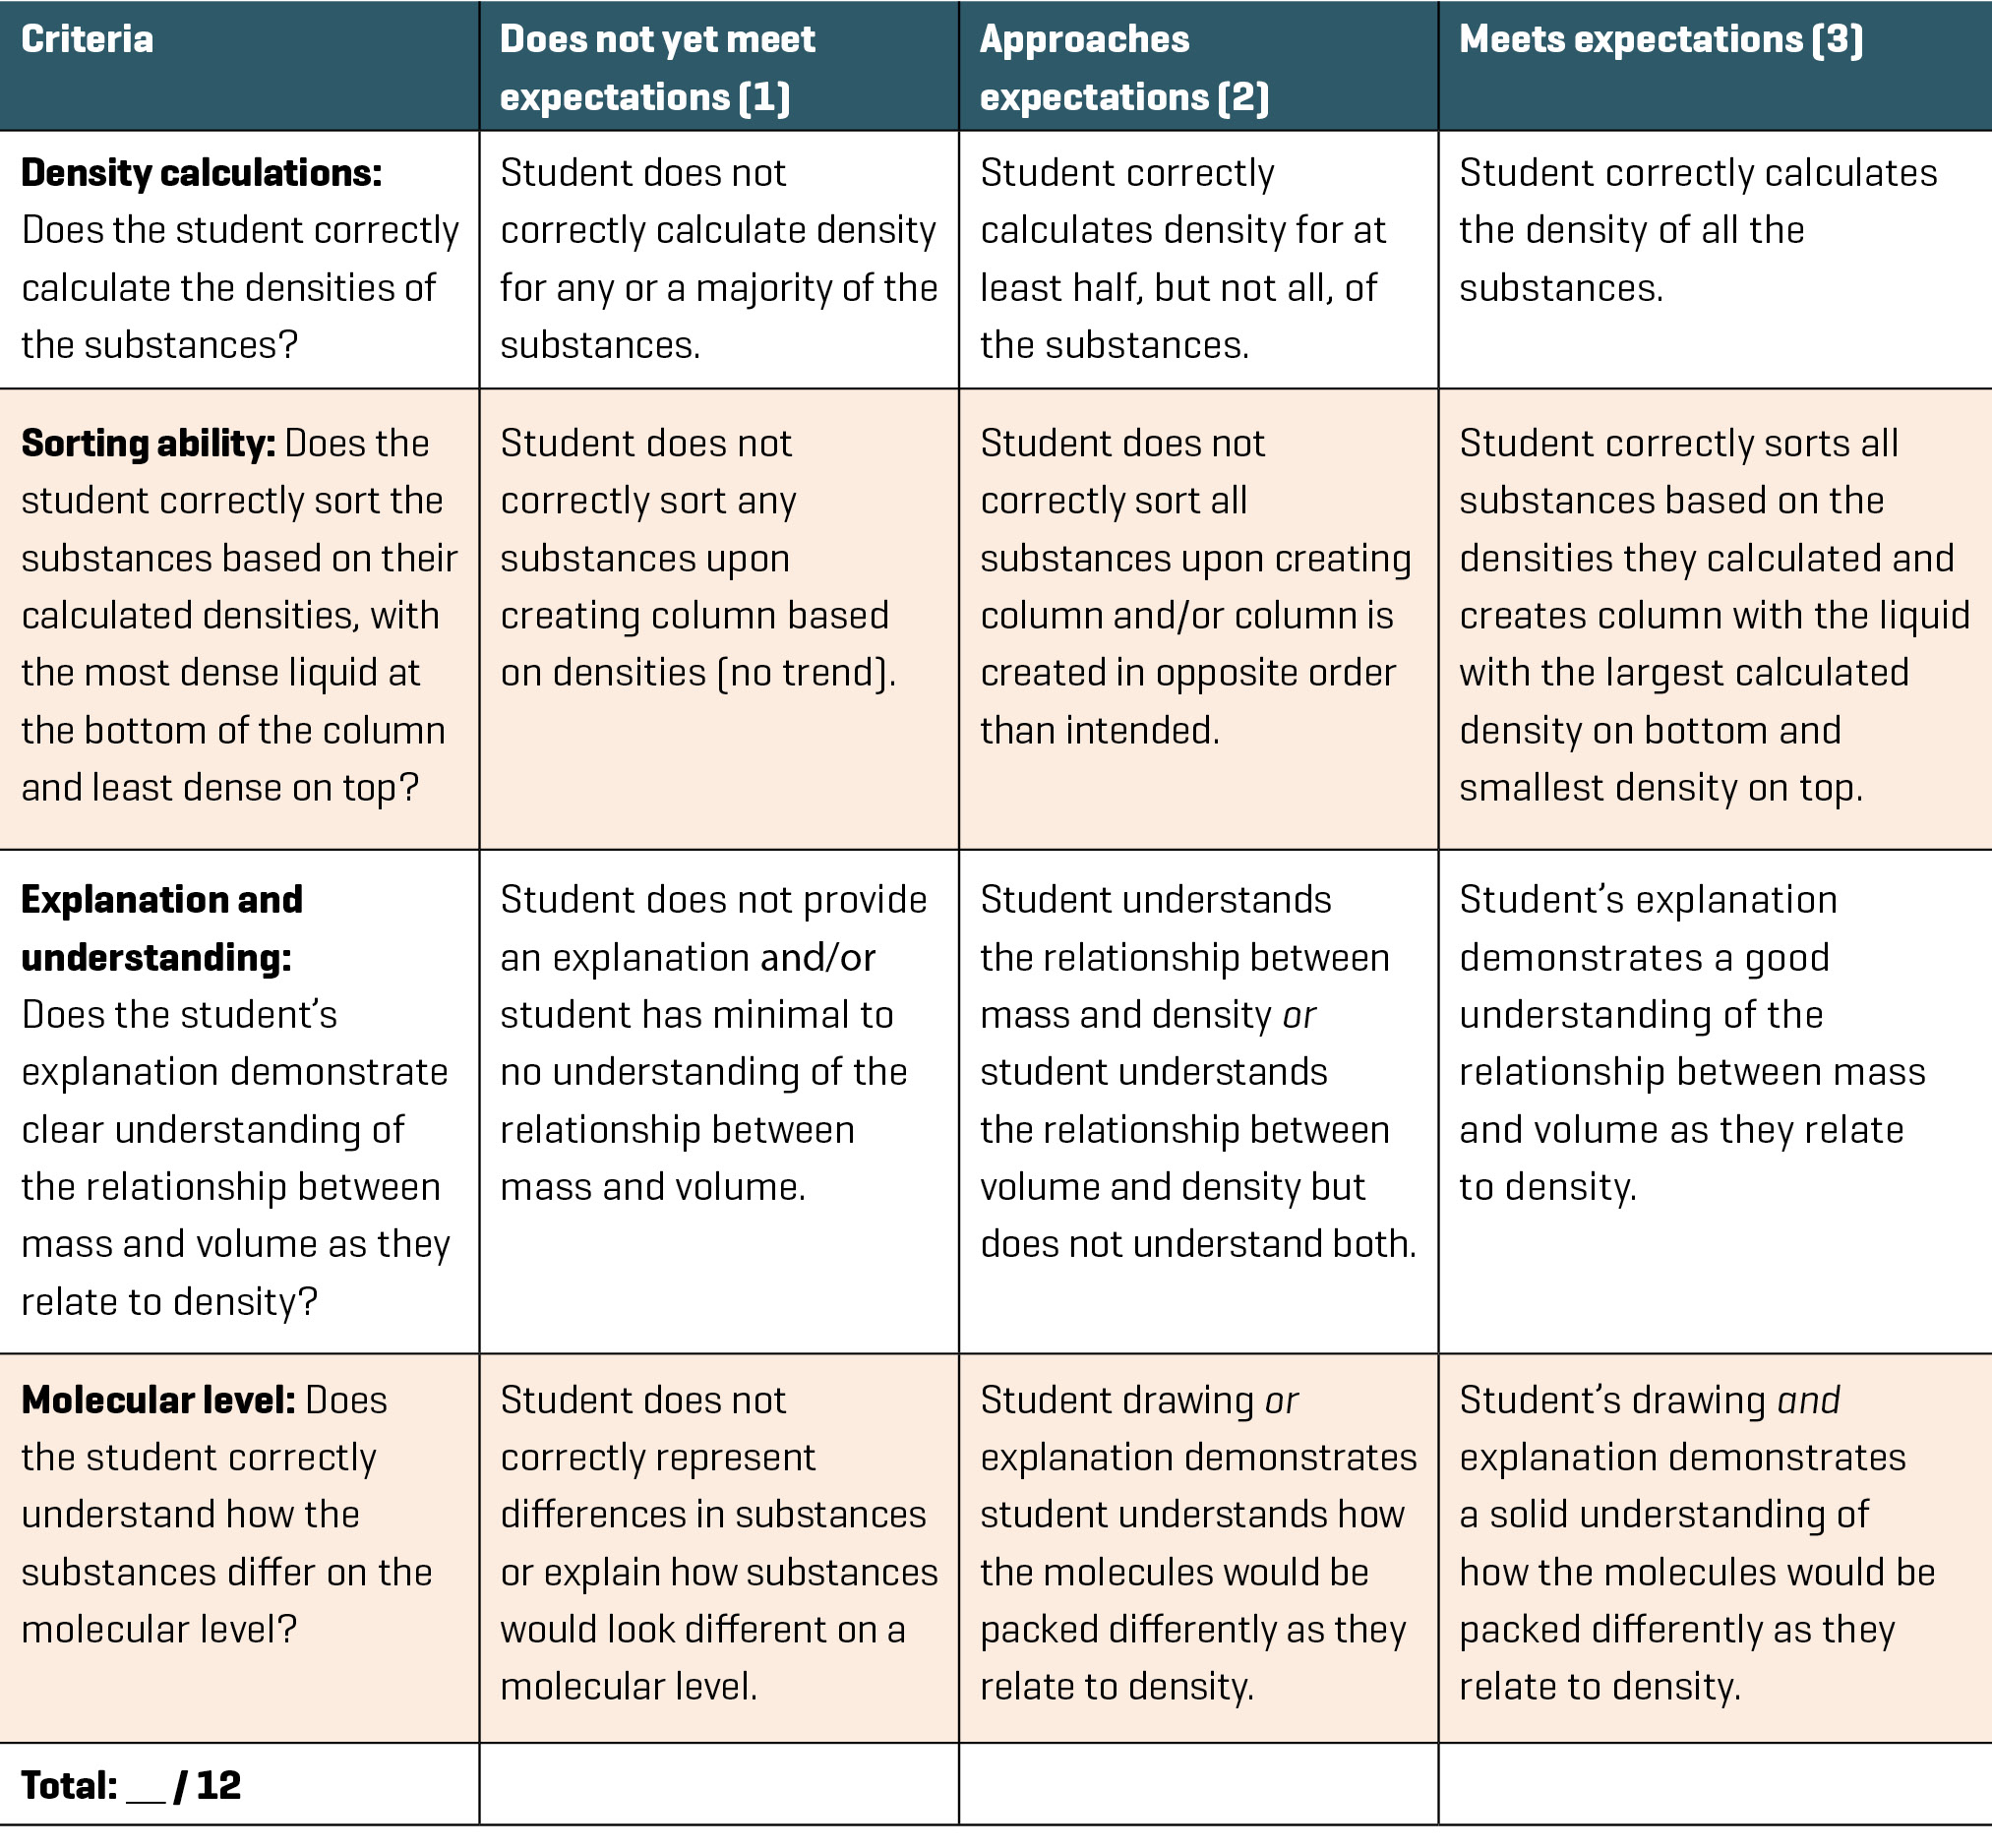
This activity serves as a summative assessment and provides evidence of a student’s ability to accurately measure a substance’s density and use that value to distinguish it from other substances. All students are given access to measuring cups and scales, as well as clear water bottles and funnels, with the instructions to “calculate the density of each liquid and use those values to create your density column” (see Create Your Own Density Column worksheet in Supplemental Materials). The assessment guides students through calculating the densities of the substances, ordering the substances from most to least dense in the column, and writing explanations about why the density would cause the substances to be ordered in a certain way to include the molecular differences in the substances. We allowed students the entire class period to create their columns, as the limited number of scales required them to wait on one another for access (this will not apply if there is a sufficient number of scales to go around). As each student began making measurements and carefully funneling their substances into the bottles, we walked among the tables making note of any repeated mistakes. This information was used to reevaluate the lesson for future use. When students completed their DIY columns, Table 3 was used to assess their knowledge and determine if their column layers were correctly sorted. This should be done soon after students are finished creating it since the layers will eventually separate into the correct order based on their properties. Another option is to have them record their order before pouring so that you have a record of their predictions (see Create Your Own Density Column worksheet in Supplemental Materials). For our class, we created and utilized the rubric seen in Table 3 to assess each student’s knowledge of density based on their ability to create their DIY columns. We also made sure students knew they were expected to keep their area clean as they worked so as to not distract or bother their peers.
Conclusion
The 5E lesson presented here was implemented in a sixth-grade physical science classroom. After careful evaluation of the lesson’s results and based on feedback from both the students and the teachers, we suggest some possible improvements. Students complained about having to share the balances, so one option if you don’t have several balances is to demonstrate how to properly use the balances but provide premassed objects for students to use. You can give students the masses so they don’t have to go through this step. We also suggest leaving out the materials used on the first day so extra time is not spent bringing these back out for day 3 (see Table 1). An option for additional assessment is to have your students work in groups to create videos of their own density demonstrations based on what they learned throughout the lesson.
There are also additional scaffolds you can provide for students with special needs as they work through the lesson. Rather than a blank sheet of paper for the models, you may want to provide a template (recommended by Windschitl, Thompson, and Braaten 2018) for them to complete their model that prompts them to include specific details such as a microscopic view of what’s happening along with a macroscopic view. You may also choose to group students for different parts rather than have them do it individually if you feel that would support your students more effectively. We also recommend that this lesson be followed by a lesson or series of lessons on buoyancy to ensure there are no misconceptions about sinking and floating. This lesson lends itself to also addressing the concept of buoyancy, but thus far we have separated out these concepts in our classroom though you could choose to teach them together.
Overall, the 5E instructional model was effective in teaching this lesson on density, and the YouTube video was a good way to engage the students. By day 4, a large majority of our students were able to correctly determine the densities of the four unknown substances and create their columns in the correct order. In addition, their explanations of what was happening were more accurate than when we have taught this concept in other ways. Embedding the science and engineering practices into this lesson seemed to play a role in its effectiveness, as did using the exciting YouTube video as an anchoring phenomenon. Many students expressed that this was one of the best activities of the semester. We recommend embedding phenomena and science and engineering practices as much as possible when teaching middle school science topics. •
| Table 2. Liquids and their densities used for DIY column. | ||||||||||||||||
|---|---|---|---|---|---|---|---|---|---|---|---|---|---|---|---|---|
|
Online Resources
Supplemental Materials
Jacquelyn J. Mosely is a graduate teaching assistant in the Department of Chemistry and Biochemistry at the University of Mississippi in University Park. Brooke A. Whitworth (bwhitwo@clemson.edu) is an associate professor of science education in the Department of Teaching and Learning at Clemson University in Clemson, South Carolina.
5E Literacy Physical Science Teaching Strategies