
Feature
Thinking Big
Using computational thinking for data practices in high school science
The Science Teacher—February 2020 (Volume 87, Issue 6)
By Erin Peters Burton, Peter Rich, Timothy Cleary, Stephen Burton, Anastasia Kitsantas, Garrett Egan, and Jordan Ellsworth

One of the science and engineering practices from the Next Generation Science Standards (NGSS), Using Mathematics and Computational Thinking, provides opportunities to help guide data practices in high school science investigations. Data practices are a suite of undertakings that students perform in order to make scientific claims from the evidence found in data. Weintrop and colleagues (2016) have identified five data practices that scientists engage in while doing investigations: Creating data: Generating data from tools or observation Collecting data: Gathering and recording data Manipulating data: Sorting, filtering, cleaning, normalizing, and combining data sets Visualizing data: Communicating results with a representation such as a graph or chart Analyzing data: Extracting meaning from a data set for the purpose of drawing conclusions
As teachers, we may recognize these practices as crucial processes that students must undertake in order to gather valid and reliable data and make strong conclusions about scientific phenomena. A challenge for many students, and particularly those with less experience with scientific practices, is making effective decisions regarding how to use data practices in an integrated way during science investigations.
Simply developing student knowledge about these data practices will not typically be sufficient for enabling students to use such practices. Students need guided practice and feedback, but can also benefit from learning how computational thinking practices can be used to explain the detail in the processes of data practices.
What is computational thinking?
Computational thinking (CT) is an approach to solving problems and designing systems that requires students to think recursively, reformulate problems to see them in a different light, model relevant aspects of problems, and use abstraction and decomposition in tackling complex problems. Wing (2006) defined CT to indicate a “thought process involved in formulating problems and their solutions so that the solutions are represented in a form that can be effectively carried out by an information-processing agent.” CT can be a useful addition to instruction as it is a suite of complex processes that students can use to become skillful in data analysis in scientific investigations (Weintrop et al. 2016).
Because science and mathematics increasingly emphasize computation, introducing computational tools in the classroom can give a more authentic view of these disciplines (Augustine et al., 2005). Computational thinking practices can help students understand what to perform during data analysis in a way that reflects the scientific discipline.
There are several CT practices that are naturally linked with data analysis, such as decomposition, pattern recognition, abstraction, algorithm building, and automation. Decomposition is defined as the breaking down of a complex problem into less complex subproblems. The specific approach to problem decomposition can vary, but the purpose is the same—to reduce the main problem into manageable steps or subproblems.
For example, in order to better understand what causes tides, we might identify some variables that may affect tide height, such as the position of the Moon or shape of the coast. To gather tide data more systematically, we might consider ways to measure the height of a tide, the format in which we would want that data, how often we want to measure tidal data, and where to place our instruments to get reliable information.
Another computational thinking practice is pattern recognition. Pattern recognition is defined as the identifying, clustering, and modularizing of steps, parts, or correlations that repeat or can be repeated. The primary purpose of identifying patterns is to cluster related parts of the problem by their recurring feature(s).
For example, to understand how a specific factor affects tide height, we might look for correlation (or pattern of behavior/relationship) between the cycle of the moon and tide height. While manipulating collected data, we might notice an additional relationship (i.e., the nature of an observed pattern) between the shape of the water body and tide height, such as an increased correlation when controlling for time.
Abstraction is conceptualized as a process of identifying and organizing relevant information and removing unnecessary information. The purpose of abstraction is to clarify the problem and generate generalizable solutions, which is an essential skill for constructing models in science and engineering (Gilbert 2004).
To better understand the relationship between two variables such as tide height and position of the moon, we might remove outliers so that we can focus on the data points that are most coherent. When testing correlation with many different factors in our tides example, such as latitude or temperature, we might notice that some factors have minimal correlation with resulting tide height. We might then choose to omit that factor from consideration, given that it does not appear to have a meaningful impact on our observations or predictions.
Algorithm building is defined as the creation of a series of precisely defined steps or rules that leads to successful solutions to a problem. An algorithm, in simple terms, is an unambiguously defined process to address an initial question. It may involve the steps to collect certain data, the steps to analyze that data, or any other defined process. The steps of the algorithm should, if built correctly, lead to a correct solution of the problem every time, or within a known error chance. To determine the factors that affect tide height, we might create a process of data collection and analysis to determine the extent to which location of the moon and shape of the water body impacts overall tide height. In order to predict future tide heights, we might create a formula for calculating tide heights given specific patterns or measures identified.

Automation involves performing a procedure with little or no direct human interaction. This term typically refers to the use of machinery or computers to perform the automation. At this level of computational thinking, the goal is to outsource work so that it reduces or removes the requirement for direct human action to achieve the desired outcome. For example, with a defined formula for determining future tide height, we may automate the process of calculating the precise predicted tide height for the next 24 hours by programming the formula into a computer to calculate. Rather than collecting data by hand, we will use a machine or computer to measure a specific variable at predefined time intervals. Automation can occur even at small scales, allowing scientists to focus on data analysis rather than the minutiae of repeated process.
For example, to reduce tedium in data manipulation and analysis (e.g., converting units of measure from imperial to metric), we may use a computer to store and manipulate our data in a quicker manner.
How does computational thinking help student data practices?
Blending CT practices with data practices can provide students with a metacognitive guide for making decisions while engaged in scientific investigations. Based on an analysis of CT and data practices, we hypothesize that different combinations of CT practices are well-aligned or fit naturally with different data practices. Table 1 (see “On the web”) displays the matrix we developed to help teachers focus CT to the most relevant data practices. We felt that not all CT practices and data practices align, and those areas are represented on the crosswalk by a blank space.
From this matrix, we have developed an extensive set of questions that a teacher can use in the lesson planning process or that students can use while engaged in creating data, collecting data, manipulating data, or visualizing data. The questions are organized by data practice and then by computational thinking for each data practice. After we present the questions, we explain how this set of questions can be used.
What questions can we ask to support computational thinking in data practices?
Data practice #1. Creating: generating data from tools or observation
Decomposition:
- Break it down: What do we already know about this problem? What data are we generating? What are the key types/sources of data that we might use to answer the essential question? How will we generate this data? What metrics can we use?
- Evaluate and choose: Is the data primary or secondary? Which of the data sources will best help to answer our essential question?
Algorithm Building:
- Generalize: Which process will help us to effectively generate data to solve this problem? What are the rules or processes for creating data?
- Identify Conditions: What conditions (e.g., if this, then that) need to be implemented to gather the data? What are the limitations or restrictions to the process of collecting data? Is there any background information we need to know to set this up?
- Put it in order: What is the most efficient sequence to follow to generate this data?
Automation:
- Identify tools: What tools can we use/create to automate the generation of this data? How is the automation working to get the results? Does the automation help or hinder the data collection process?
Data practice #2. Collecting: gathering and recording data
Pattern Recognition:
- Identify patterns: What are the intervals of the collected data? When does a data cycle end and when does it begin? Are we gathering enough data to see patterns or cycles in the phenomena?
Abstraction:
- Identify essential elements: How frequently do we need to collect data? Which data points matter to us? Do we have too much data?
- Identify noise: Is there certain information that is less helpful when trying to figure out how best to gather data?
Algorithm (Checking):
- Generalize: What are processes or rules that should be followed consistently and why? Are there ways to change the rules for data collection to improve our data collection process?
- Identify conditions: What conditions or events happened during the data collection that might result in influencing the data beyond what you are testing? Under what conditions will you NOT collect data?
Automation:
- Identify tools: What tools could we use to collect the data more efficiently? More accurately?
Data Practice #3. Manipulating: sorting, filtering, cleaning, normalizing, and combining data sets
Data Practice #5. Analyzing: extracting meaning from a data set for the purpose of drawing conclusions
Decomposition:
- Break it down: What possible factors could help answer our question? Are there factors we haven’t considered yet that we should?
Pattern Recognition:
- Identifying patterns: Do the data look random? Are they regular? Are there increasing or decreasing patterns? What “shape” is the data?
Abstraction:
- Remove noise: Is there noise affecting our data? What kind of effect is that noise having on our analysis?
- Create a model: How can we model the relationships between variables? Is there a variable that affects the outcome more than the others?
Algorithm Building:
- Generalize: Is there a formula we can use to describe the relationship between variables?
Automation:
- Identifying tools: What tools can we use to analyze and model the data?
Using the questions
The entire set of CT questions for data practices is not intended to be used all at once. Instead, teachers could use these questions in two ways. First, teachers could take a lesson that is already written and choose one or two data practices to focus on. For example, if the lesson calls for secondary data sets to be selected from the NOAA website, questions about creating data may not be as relevant, but questions about visualizing data may be more important. Alternatively, teachers could focus on one CT practice, such as decomposition, throughout the lesson and apply each decomposition question in the sequence of data practices from creating to visualization.
Students can benefit from having these questions embedded into lessons. For example, we asked students to conduct an investigation to find factors that influence the height of tides. In this investigation, we asked students to collect data on a NOAA website and to plot the height of tides for four locations. The data provided by NOAA can be downloaded by different time intervals. Many of the students downloaded the data using the same measure per day over the course of a year.
When students plotted the data, it appeared to be thick colored lines and students could not interpret the patterns (see Figure 1). We asked the students questions from the manipulating data section (“What information is most necessary to answer your research question? Can you filter the data to only show the most important data?”) Prompted by the questions, students decided to use a smaller amount of data, every hour for a month, which was more appropriate for interpreting the phenomena.
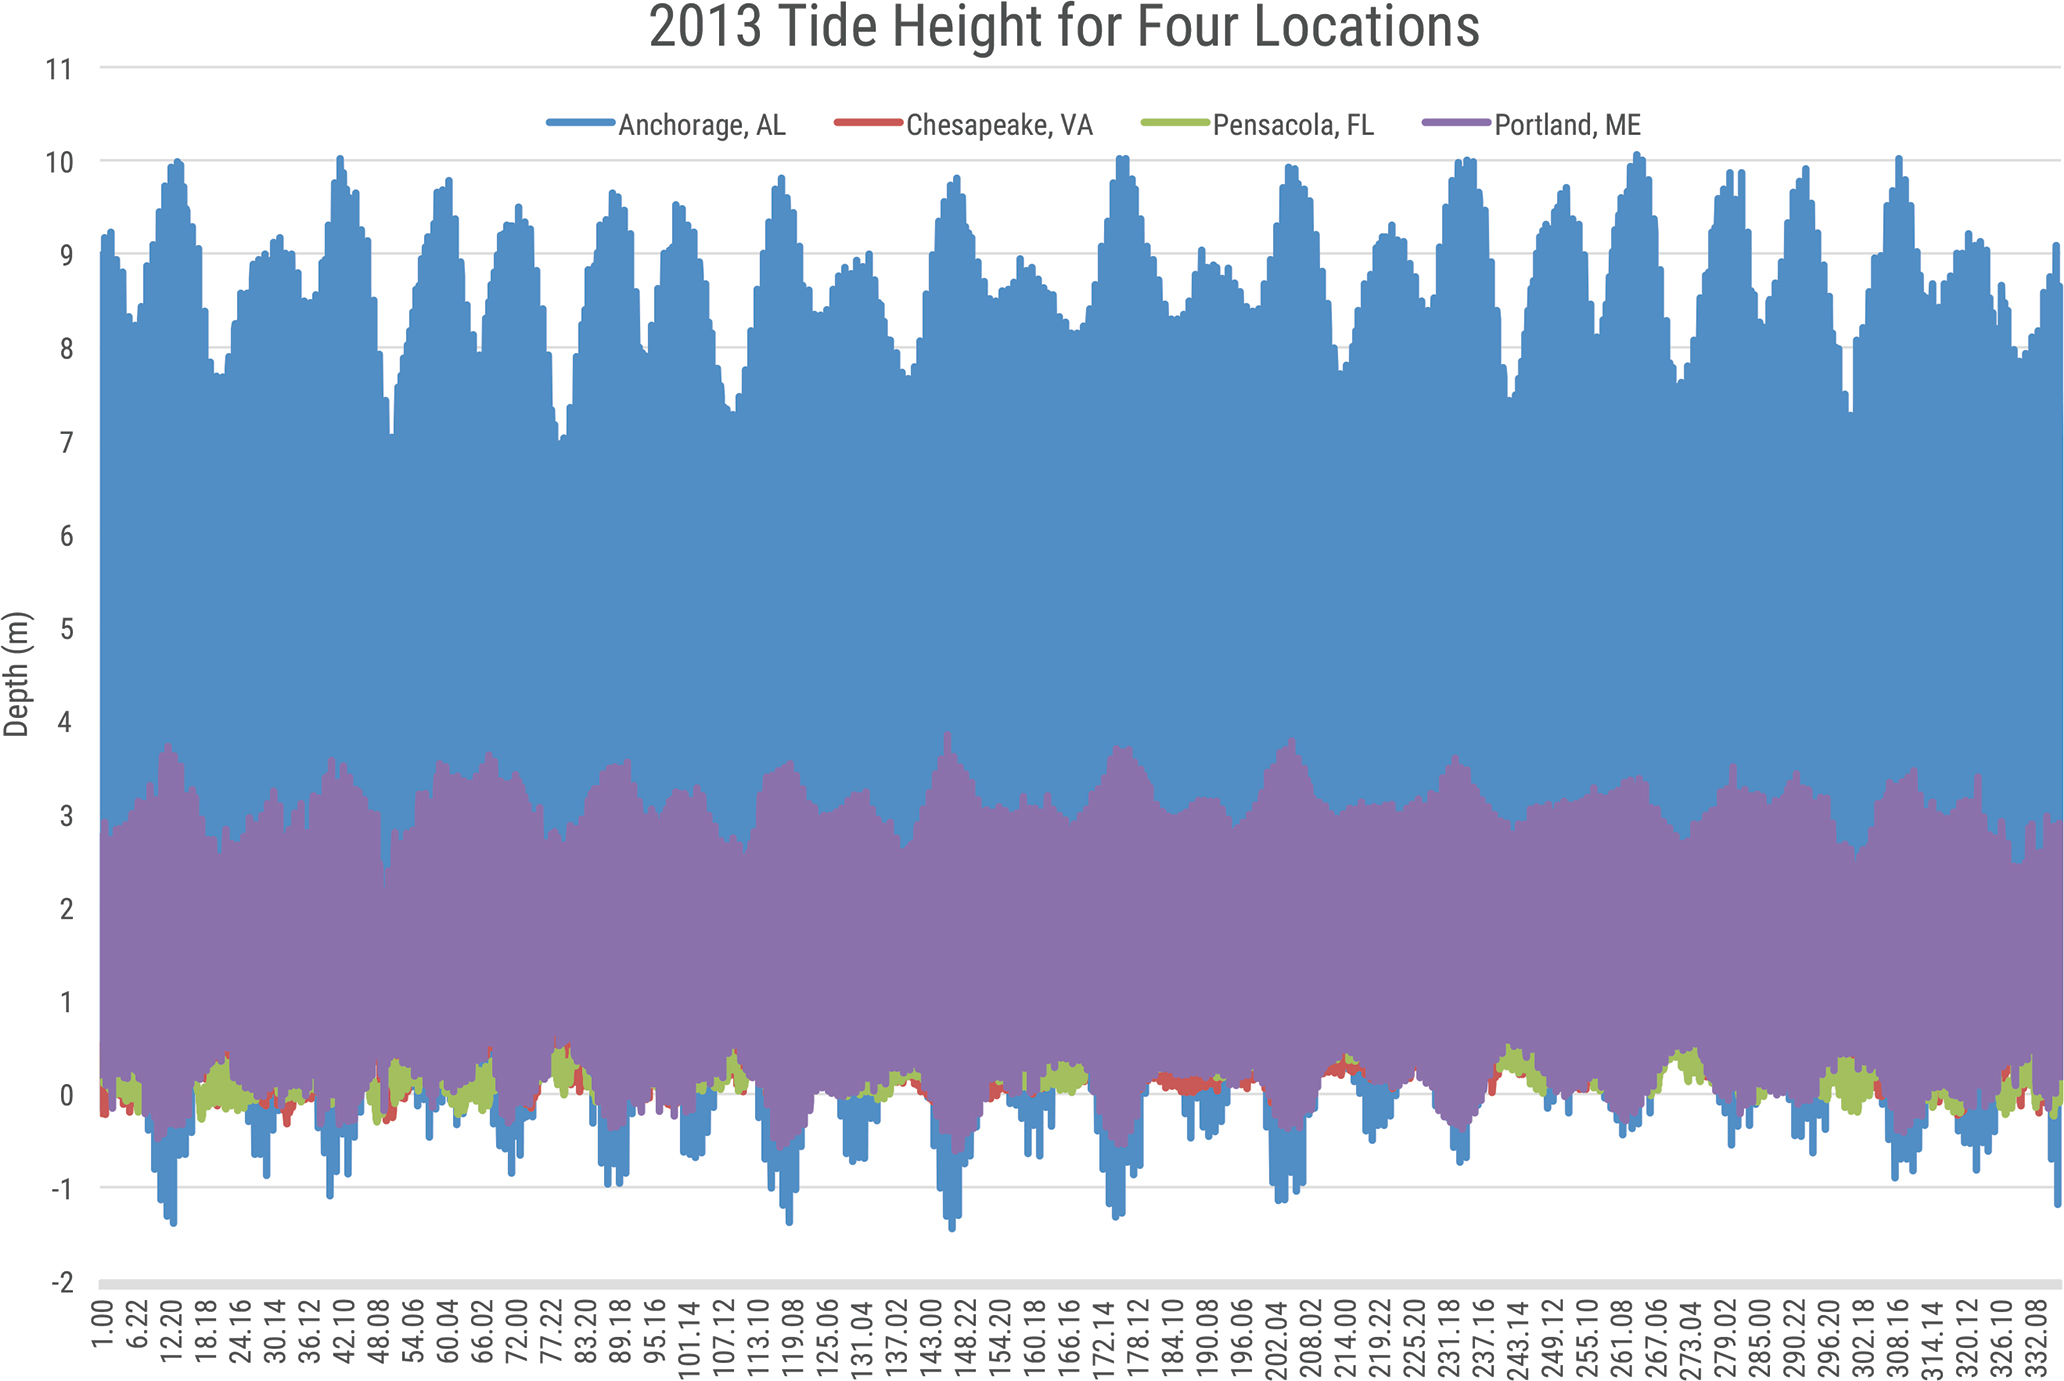
Plot of tide height from NOAA website for four locations at the time interval once an hour over 332 days. This plot demonstrates when too much data collection can prohibit pattern recognition
Interdisciplinary Literacy Teaching Strategies High School