
feature
What’s in a Wave?
Using Modeling and Computational Thinking to Enhance Students’ Understanding of Waves
The Science Teacher—March/April 2021 (Volume 88, Issue 4)
By Patrick Enderle, Natalie King, and Lauren Margulieux

Teaching about wave structure and function is a critical element of any physical science curriculum and supported by Next Generation Science Standards (NGSS) PS4: Waves and Their Applications in Technologies for Information Transfer. Often, instruction focused on these concepts involves identifying and describing several aspects of wave structure, including amplitude, frequency, and wavelength. To support students’ learning of these ideas, teachers often rely on developing graphic models of a wave with students identifying different aspects of wave structure. To enhance this experience, some teachers employ readily available simulations from trusted websites, such as PhET or Netlogo. Digital resources are valuable tools that teachers can use to support students’ science understanding through manipulating elements of digitally constructed scientific models. These approaches to teaching promote students’ engagement in the practice of designing (drawing a wave) and using scientific models (working with a simulation).
To expand upon these resources, we developed a series of instructional activities that deepen students’ conceptual understanding of waves by engaging in computational thinking while developing and using scientific and mathematical models. We use an accessible programming platform, called Pencil Code, which displays the simulation and its code side by side, offering learners more opportunity (in comparison to other platforms) to understand their interaction. This feature allows students to engage in more sophisticated thinking as demonstrated by the SAMR (Substitution, Augmentation, Modification, Redefinition) framework (Puentedura 2012), with adaptation and creation of digital products rather than just using them. The four different degrees of technology integration identified in this framework range from simple use of technology to substitute for other resources (e.g., e-texts instead of textbooks) to more sophisticated uses that involve developing entirely new products and activities (e.g., developing a simulation to model a phenomenon instead of drawing or writing about it).
Computational thinking as a scientific practice is perhaps one of the least characterized scientific practices emphasized in A Framework for K–12 Science Education (NRC 2012) and the NGSS (NGSS Lead States 2013). This multifaceted practice involves more than coding; computational thinking typically requires that students use information processing to support problem solving (Barr and Stephenson 2011). While characterizations differ, computational thinking consists of at least five common elements:
- abstraction: reducing the complexity of a system to only the key elements,
- algorithms: developing a series of detailed instructions that describe the relationships between key elements,
- automation: creating a digital artifact that can complete a repetitive task consistently,
- decomposition: breaking down a larger system or problem into more manageable pieces, and
- debugging: refining the digital product for accuracy and efficiency.
Students’ learning is enhanced as they engage in scientific practices within the context of figuring out a phenomenon and in conjunction with core science ideas and crosscutting concepts (Passmore 2014). The practice of computational thinking may seem relatively foreign for many students. Therefore, learning about it must occur over a longer period of time, which means it must be embedded in curriculum that addresses multiple topic areas. As teachers, we are also challenged with how this practice can be meaningfully incorporated into our teaching. We designed this instructional sequence as an example of how to engage students in computational thinking while they learn about the core idea of waves and their properties; several crosscutting concepts; and other practices, such as modeling.
Pencil Code
One key resource that you will need for this activity is a block-based programming platform called Pencil Code (http://pencilcode.net/). Although coding can be intimidating for some teachers and students, Pencil Code uses a more accessible version of programming involving already developed blocks of coding text that represent fundamental commands used in most algorithms. Thus, rather than students learning how to write code with specific syntax, they can focus on combining appropriate concepts in particular sequences to achieve their goal (modeling of a wave activity and effects of different media). The website is free and offers materials and tutorials to support your own learning.
As a web-based system, Pencil Code can also be accessed through tablets and smartphones, increasing the accessibility of the platform for students using various devices. Using Pencil Code with touch-based controls (e.g., smartphones), however, can be more glitchy than with keyboard and mouse, so we recommend saving work often if using touch-based devices. We have created a set of activities for science teachers to introduce students to block-based programming in Pencil Code (http://bit.ly/EMWaveActivity). Further, we have a public version of our own code generated in Pencil Code for this activity (http://lemarg.pencilcode.net/edit/WaveModelComplete) that you can use in your own learning and classroom.
Phase 1: Introducing the wave (1–2 Days)
This phase of the instructional sequence occurs at the beginning of a unit about waves and their applications, so students can familiarize themselves with key aspects of the fundamental core idea. For this work, students watch a video about sound waves (https://www.youtube.com/watch?v=px3oVGXr4mo&feature=youtu.be; “What does sound look like?” (NPR 2014)). In small groups, students develop initial descriptions of what they observed in the video, and can recall from previous episodes of learning about waves. Students also describe other ways they talk about sound. These ideas are recorded so that they can be shared with the whole class through a whiteboard or poster paper.
As students share their ideas, pay attention to comments about things repeating, size and changes in the images in the video and if they mention the term “wave.” Building on students’ ideas, teachers can draw explicit attention to the crosscutting concept of patterns, highlighting that patterns help scientists generate questions to investigate about relationships within a system. Teachers can create this focus by using questions such as, “What patterns did you notice in the video about sound waves?” and “What do those patterns reveal about potential relationships between factors such as size and speed?” Teachers should prompt students to develop initial questions they have about sound and its structure. These questions may be used as resources to guide the next phase of developing a standard 2D model and bridge to Phase 2 of this instructional sequence.
Once students share their ideas, split them into small groups to briefly discuss ways that waves are typically represented through pictures. Students should generate a public record of their thinking, such as creating posters or charts with their ideas, including initial picture models. Ask groups to describe their representations to the whole class, and record them on the main board. Drawing on the students’ ideas, create a standard 2D model of a wave on the board. Using this model and characteristics generated about a wave’s repetition and size, begin to identify key concepts about wave structure, including wavelength, frequency, and amplitude. As you review these features with students, fill in labels on the wave diagram on the board. Revisit the concept of patterns to help students identify basic relationships amongst various aspects of a wave structure. For example, once the main 2D model has been established, construct two or three other 2D models that vary in wavelength, frequency, and amplitude. Work with students to establish the inversely proportional relationship between wavelength and frequency and the independence of amplitude from these factors. Provide a short exit ticket with relatively straightforward prompts, such as, “Describe two things you learned about the nature and applications of waves today” and “Write one question you still have after today’s lesson.” As the classic model is discussed, observe the comments that students offer and facilitate whole-group discussions where students build off each other’s ideas.
Phase 2: Creating a wave model using Pencil Code and computational thinking (1–2 days)
The next phase of this sequence involves using Pencil Code with student pairs that develop a model of waves that can also serve as an assessment of students’ understanding and their proficiency with engaging in aspects of computational thinking. The publicly available code we have prepared (http://lemarg.pencilcode.net/edit/WaveModelComplete) can be used to guide Phase 2 (see Figure 1). A teacher may begin by conducting a brief review of major wave concepts. Following this discussion aimed at activating students’ thinking, set the stage by discussing digital models and describing the overall task. Following this introduction, students begin exploring the programming platform at pencilcode.net. Students must create their own login for the site. Once students have access to the site, allow approximately 15 minutes for unstructured exploration so they can run some of the already developed programs and get a sense of the actions that certain block combinations produce. When they start creating programs, a common introductory activity is using block-based coding to draw the letters of their first name. You can use the activity sheet (http://bit.ly/EMWaveActivity) to guide them through starting their own model or jump ahead with the code we have developed.
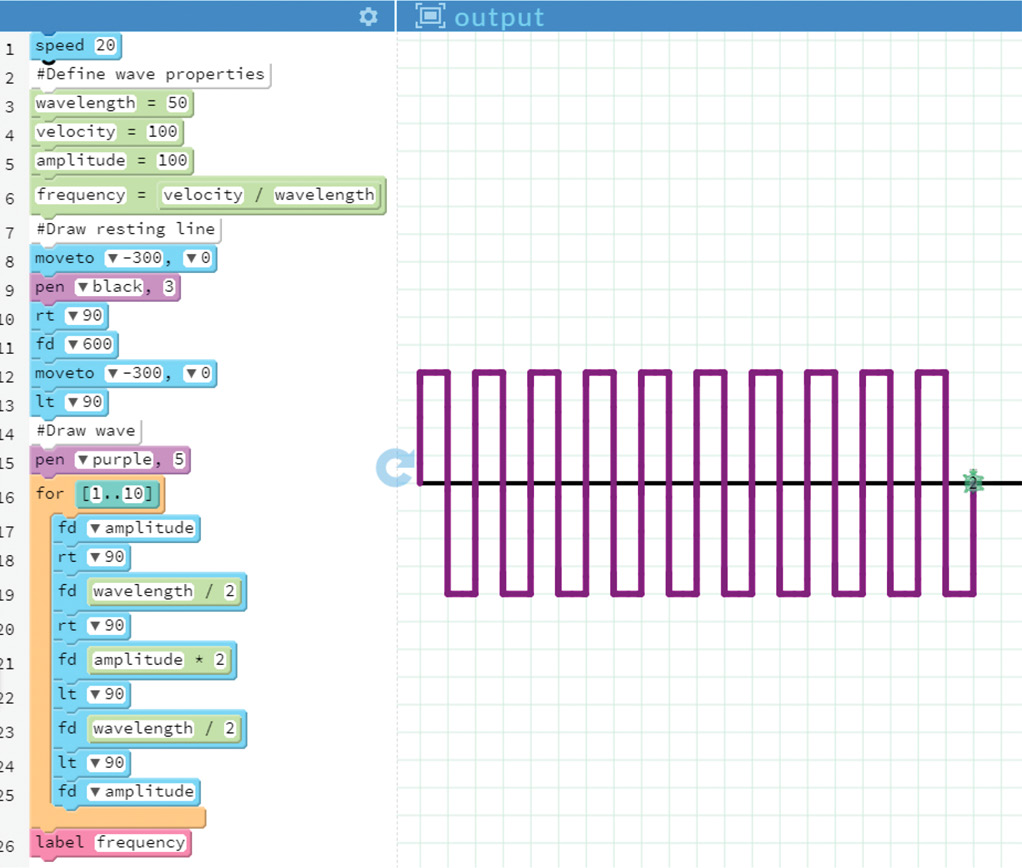
Pencil Code model of wave that is publicly available at http://lemarg.pencilcode.net/edit/WaveModelComplete
Once students become familiar with the programming platform, introduce them to the sample wave code. During this time, draw explicit attention to the crosscutting concept of structure and function by noting that during development of dynamic scientific models, such as simulation programs, different elements serve different functions in the model. Take some time to review the code block by block, discussing what function each block represents and what the particular values in certain lines of code represent. The speed can be changed to make the drawing slower or faster to help students see how the program executes. To promote collaboration, have students work in pairs to describe what each line of code means or the action it is directing. This commenting activity is a very common practice in computer programming and can help learners understand the function of particular blocks of code.
The length of this segment of Phase 2 will depend on how familiar your students are with coding. Even if they have no coding experience, Pencil Code is an accessible platform. As students continue to gain familiarity with Pencil Code, begin to focus their thinking on how the provided code represents components of a wave. You can deepen students’ thinking by identifying not only what the code represents graphically but also the groups of code blocks that lead to particular aspects of wave structure. For example, one period of a wave can be linked to blocks 3–12 of the code pictured in Part A of the activity sheet (http://bit.ly/EMWaveActivity). Conversely, if you are using the existing code, students can describe what should happen on the graphic in connection with the blocks that reference a particular element of wave structure. You can also reduce the speed at which the program will run by lowering the number in the “speed” block so it is easier to map the code to the output. Based on the sequence of blocks in the developed code, the turtle will move upward on the screen as the first value determines the “height” or amplitude of the wave, while the right turn (rt ‘90’) and the forward code will develop the first half of the wavelength. This work should include having students adjust several of the numeric values in the code, predict what they think will happen to the wave model, and then record observations of what changes occurred. With the speed at a high value, running the code repeatedly does not take much time, so students can tinker with it easily. This segment of Phase 2 could potentially take an entire 50-minute class period. Encourage students to create changes in the code and provide opportunities to share through a gallery walk session.
After giving students time to acquaint themselves with Pencil Code and the example model of wave properties, direct them to create their own model. Completing through Part C of the activity sheet (http://bit.ly/EMWaveActivity) creates the full model that students have already seen, though without the frequency calculation. The full activity is appropriate for students with limited or no coding experience and can be modified for those who otherwise want a challenge. You can have students make several revisions and save the different stages as separate programs, or have them take screen shots of each stage to record their work. Table 1 (see Online Connections) offers an example of a rubric to use in scoring final products.
Phase 3: Learning about refraction through computational models (3–5 days)
This final phase of instruction focuses on extending students’ knowledge of waves through a series of activities exploring the concept of refraction through different media. These activities most directly address HS-PS4-1 where students develop a claim about how relationships between wavelength, frequency, and velocity shift in different media. To develop this claim, students can work with the two other models developed for this instructional sequence.
The first model involves sound waves traveling through different media that students select, and then the simulation will run and print out values for velocity, wavelength, and frequency (http://lemarg.pencilcode.net/edit/HSCSSoundWaveDiffMedia). Students can collect data from this readout to develop an initial claim and determine the refraction value. During the data collection and analysis activities, teachers should again emphasize the concept of patterns to identify trends in velocity, wavelength, and frequency. Students should begin to identify that a change in media affects the velocity of the wave, which in turn changes the wavelength. The frequency of the sound wave does not get affected by different media. In the reasoning developed to support their claim, make sure students acknowledge the particle level interactions of the wave with the molecules of the respective media and how that leads to a structural change in the wave. That is, interactions by the wave particle with molecules in a particular media lead to changes in the structure of the wave, such as wavelength getting extended. These changes in the wave structure then influence how the waves can be used in different media for different higher-level functions (e.g., transmitting information using sound waves through different materials).
Then, students can use the other simulation that involves light waves to test their ideas about refraction values (http://lemarg.pencilcode.net/edit/HSCSLightWavesDiffMedia). For this program, students will need to change the refraction index value (provided by the teacher) in the actual code, offering the teacher a chance to formatively assess their understanding of the code and their use of computational thinking to adapt it. Further, they should observe that velocity and wavelength values shift in different media again but frequency values do not.
The sequence of activities described here offers physical science teachers an engaging way for students to explore wave structure and observe the impact of different media. Most importantly, these activities also provide an example of how teachers can incorporate the scientific practice of computational thinking through combining it with the practice of developing and using scientific models. ■
Online Connections
Table 1. Rubric https://www.nsta.org/sites/default/files/journal-articles/TST88-4/Enderle/Table_1.docx
Table 2. NGSS Connections https://www.nsta.org/sites/default/files/journal-articles/TST88-4/Enderle/Table_2-NGSS.docx
Patrick Enderle (penderle@gsu.edu) is an assistant professor of science education at Georgia State University in Atlanta, GA, Natalie King is an assistant professor of science education at Georgia State University in Atlanta, GA, and Lauren Margulieux is an assistant professor of learning technologies at Georgia State University in Atlanta, GA.
Computer Science Crosscutting Concepts Disciplinary Core Ideas Instructional Materials Phenomena Physical Science Physics Science and Engineering Practices STEM High School