
Feature
A Lesson in Geospatial Inquiry
The Science Teacher—November/December 2019 (Volume 87, Issue 4)
By Eric Nolan, Brooke A. Whitworth, and Lori Rubino-Hare
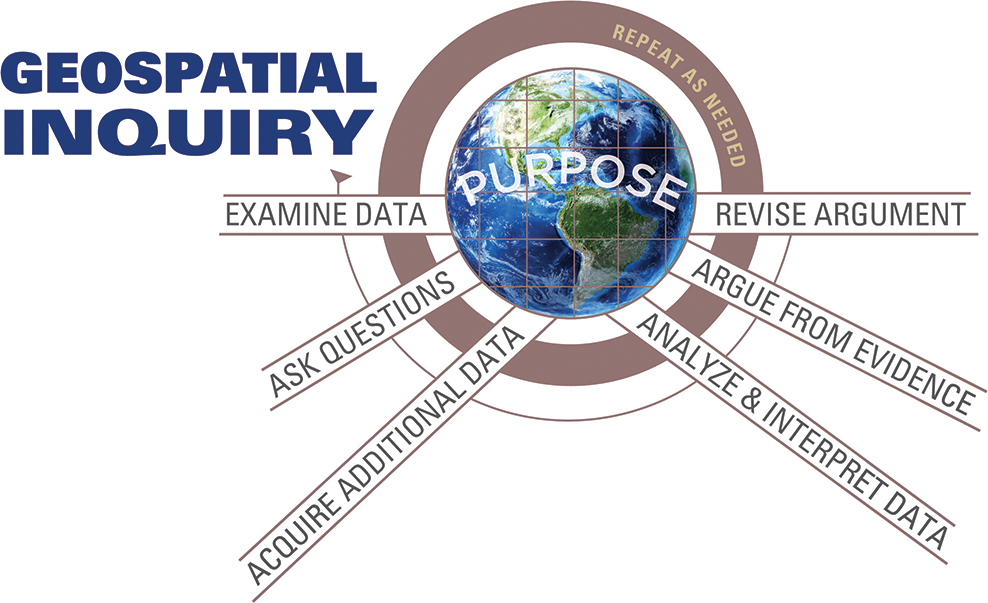
These do not have to be followed in a step-by-step process; rather, they may be iterative and cyclical, returned to or skipped, depending on the investigation.
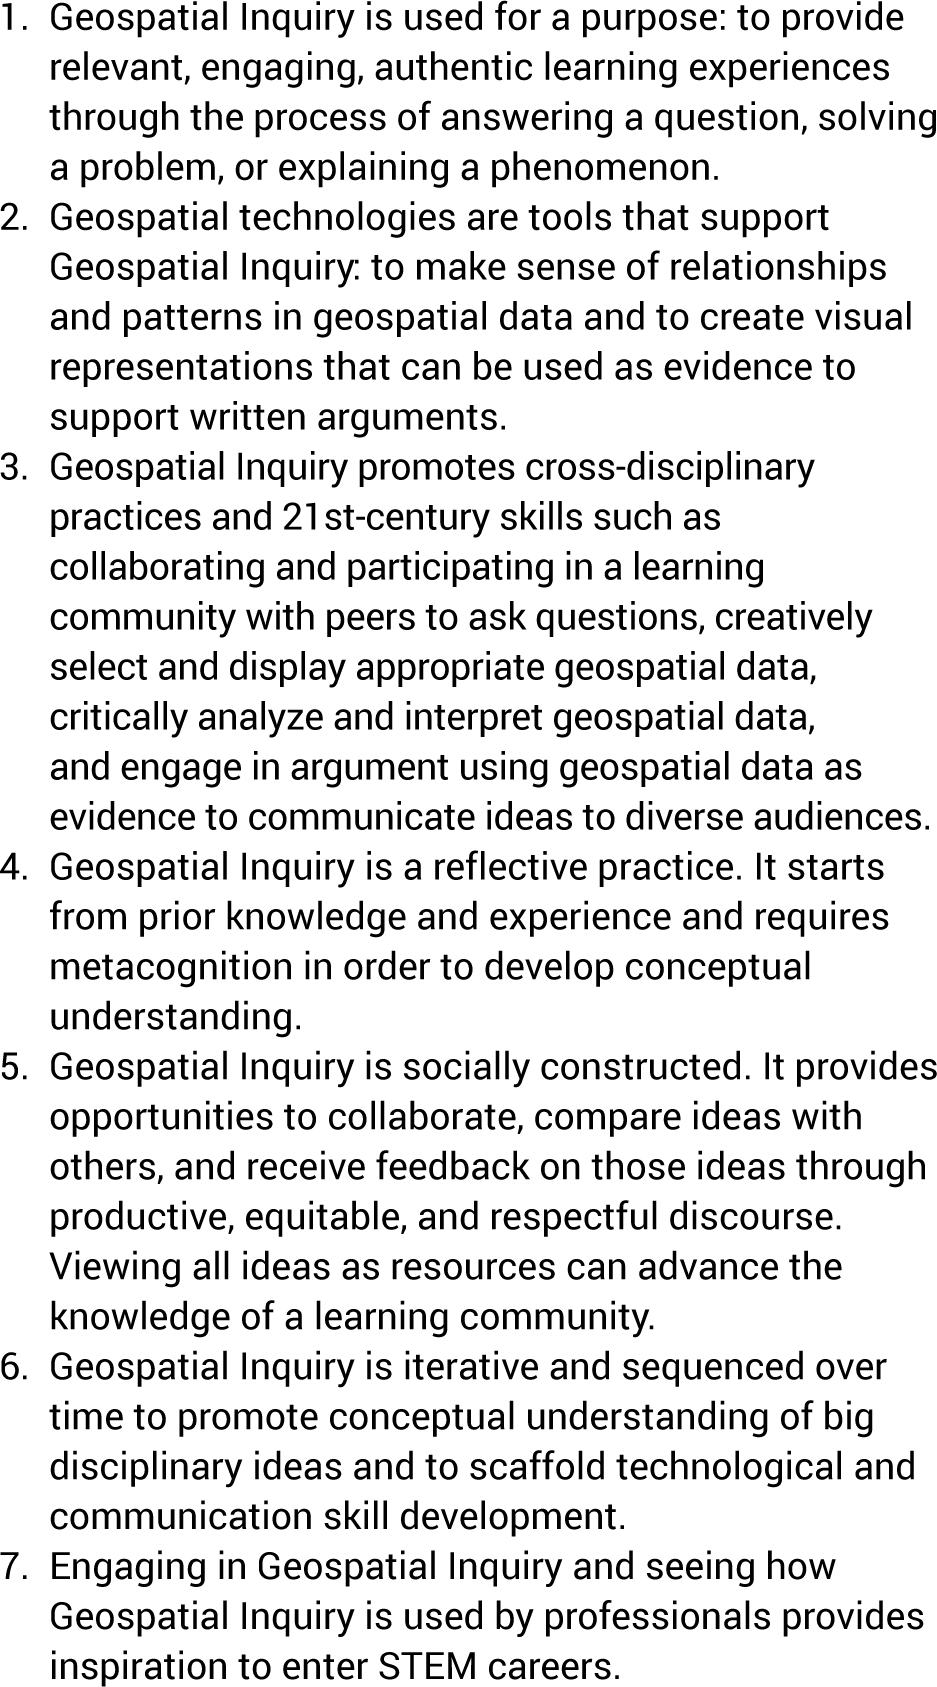
Geospatial Inquiry helps students formulate and structure their interpretations of geospatial data into claims and arguments based on observation, critical thinking, and reflection. Not only are students given opportunities to express their understanding of data in interesting and creative ways, but they also become familiar with the nature of processing and visualizing data sets. For guiding principles that will help create a lesson plan on Geospatial Inquiry, please refer to Figure 2.
Using Geospatial Inquiry within an Environmental Science Unit
To help provide an example of how to use Geospatial Inquiry, we have designed a climate change unit that you can use or modify to fit a more appropriate focus area. The guiding question of the unit is: What is our local impact on global climate change? This unit incorporates two Next Generation Science Standards (NGSS) under Earth’s Systems and Earth and Human Activity (see NGSS box, page 33).
Products for this unit include an outline and a presentation. The presentation should include maps that provide a visualization for the data used. The purpose of the presentation is to help students learn to communicate an argument with data. These products provide students diverse opportunities to engage through writing, discussion, and an oral presentation. The purpose of the outline is to help students structure their presentations with clarity and bring their ideas back to the overarching question. Using outlines may require scaffolding by the instructor to help ensure that students construct their outlines and presentations in an organized fashion to better communicate their findings. This lesson can be conducted for an 11th- or 12th-grade classroom over seven to eight days of 60-minute periods.
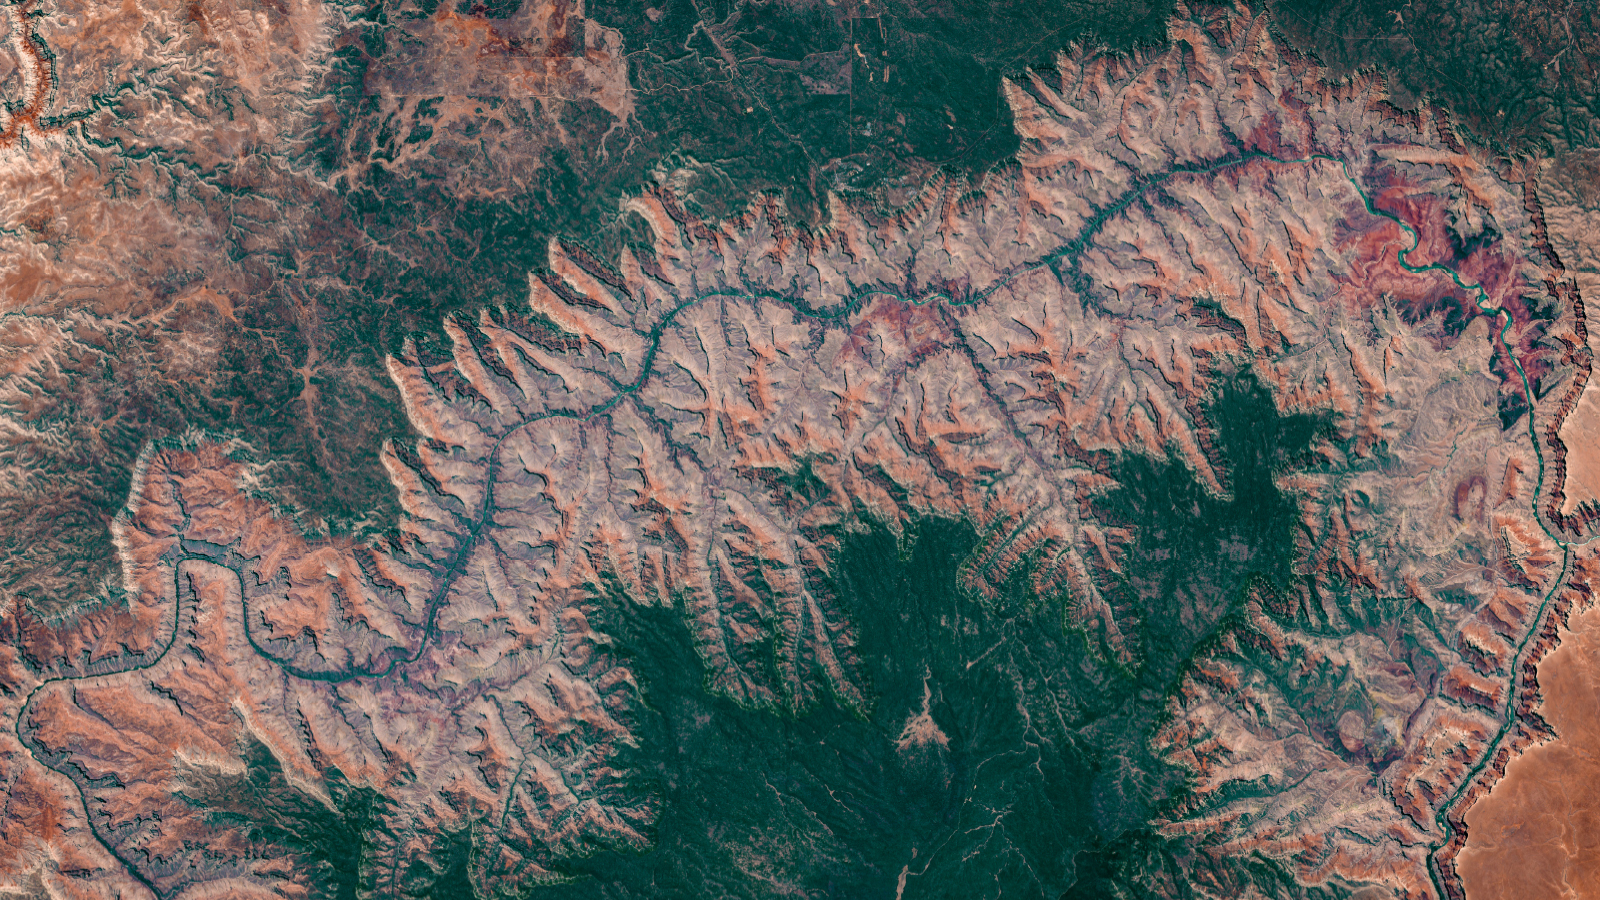
For our unit, we used ESRI’s ArcGIS Online software (see “On the web”), which offers a variety of features for map-building that encourages interaction and overlaying of different data sets (Figure 3). ESRI offers basemaps that show satellite imagery, land and ocean topography, and street views. We used their topographic basemap as the main map style, and selected the Colorado Plateau and Grand Canyon so students have a context of place. Since we are based in Flagstaff, Arizona, we looked at our region of the world as being situated in the high deserts of the Colorado Plateau surrounded by forestland.
ESRI also offers layers, which are company- and user-uploaded data files representing data geospatially on a map. Examples of the many different types of layers include USA Road Density, World Bioclimates, and USA Surface Water. If resources are available, we recommend using ESRI’s ArcGIS Online; if resources are limited, we suggest using Google Earth Pro for Windows or Mac, which is free and offers similar data types. Throughout the course of the unit, it would help to arrange for computers with internet access so students can familiarize themselves with geospatial technology and web-based searches.
When utilizing the internet for classroom use, it is important to make sure that students only open web browsers for the purposes of the unit and do not to engage with social media or other distractions that can take away from the lesson. Also, internet safety use can include (but are not limited to) the following: not sharing login information, keeping passwords private (except from parents), use of appropriate language, and for teachers and administrators to initiate parental controls when and where appropriate.
Day 1 and 2: Introduction of the overarching question, examining data, asking questions, and constructing an outline
The first day is best used to allow the inquiry process to take root as you and your students ask each other questions for the purpose of socially constructing a response to the overarching question. It would be useful to have a world map (if resources are available, we recommend using ArcGIS or Google Earth as the geospatial technology tool) on display during this initial discussion to show students the relevancy of the overarching question to their location so they can begin to think geospatially (NRC 2006).
We began by asking the question, “What is our local impact on global climate change?” so students had a guiding idea they could return to throughout the duration of the unit. We then asked our students to consider the following questions:
- What information do you need to explore about how our location is related to global climate change?
- What data would you need to acquire in order to offer evidence supporting your claims?
- How will you analyze and interpret the data?
By opening up a discussion of conditions that contribute to climate change, what scientists say about the dramatic changes we are seeing, and how our part of the world is affected by all of this, you begin to engage students in the inquiry process. Since this is the stage where you can gain student interest, it might be a good idea to let the conversation take a form of its own. Teachers should use the discussion as an opportunity to formatively assess students’ thinking and how those viewpoints relate back to the overarching question. Through these observations there may be moments when the conversation needs a guiding comment to point students in the right direction.
We recommend using a computer lab for the first day so that you can introduce the software and demonstrate geospatial mapping if students are not already familiar with it. It might be helpful to reserve a computer lab or other computer resources that would give students internet access to help them follow along with what comes out of the discussion. The process of finding viable information will take time as students may need to learn concepts such as validity, credibility, and reliability if they are not familiar with them (Georgetown University Library 2019). Therefore, depending on your students’ prior knowledge, you may need to adjust your lesson plans for more than one hour on Day 1. If time permits, allow students to conduct web-based searches with your assistance while they explore the overarching question. The goal is for them to find valid sources of information so they can structure their reasoning through evidence-based claims.
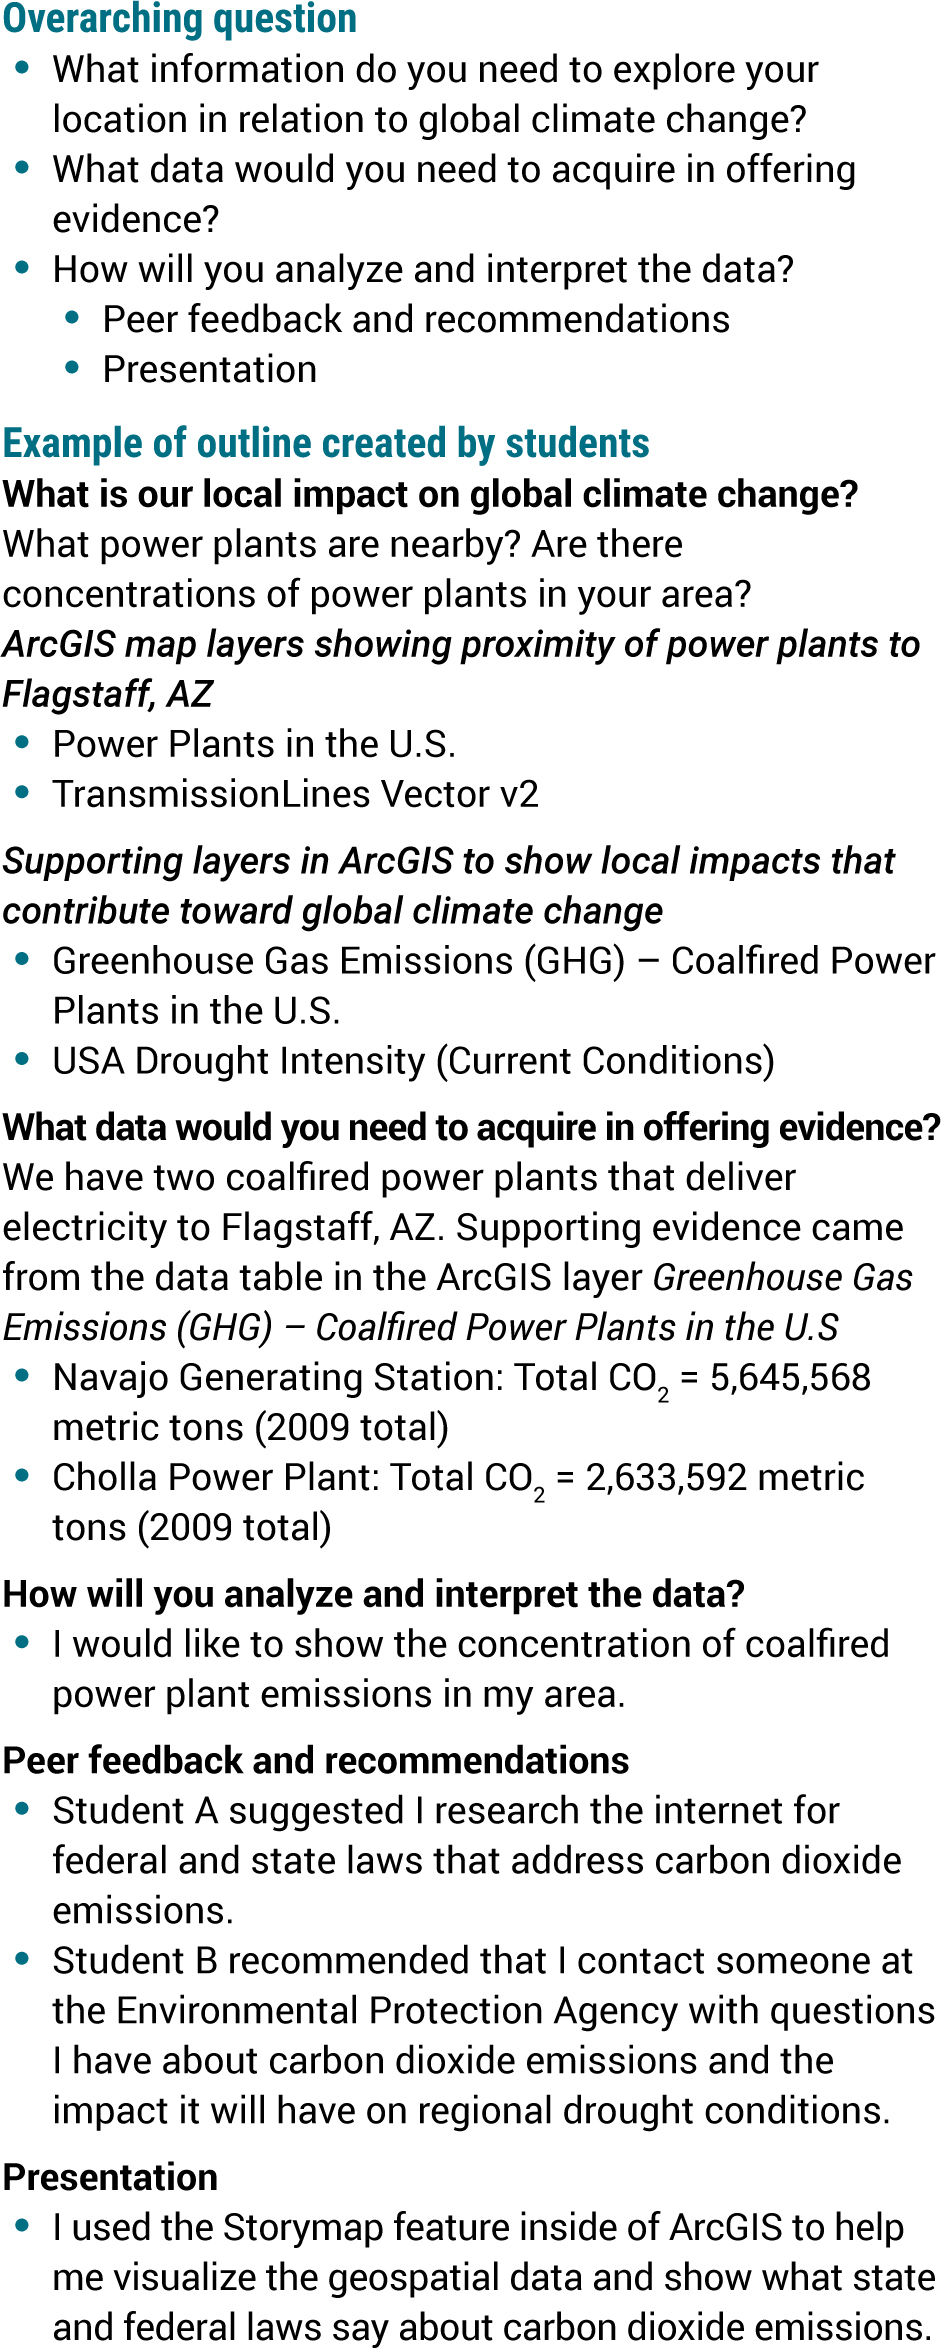
On Day 2, students can either begin, or continue from Day 1, constructing their outlines to answer the overarching question. Figure 4 shows an example of a completed student outline with the overarching question and sub-questions in italics, followed by a student’s findings beneath. For many students, this may be their first time constructing an outline, so it might help to introduce the portion of the outline in italics as a scaffold to structuring their investigation.
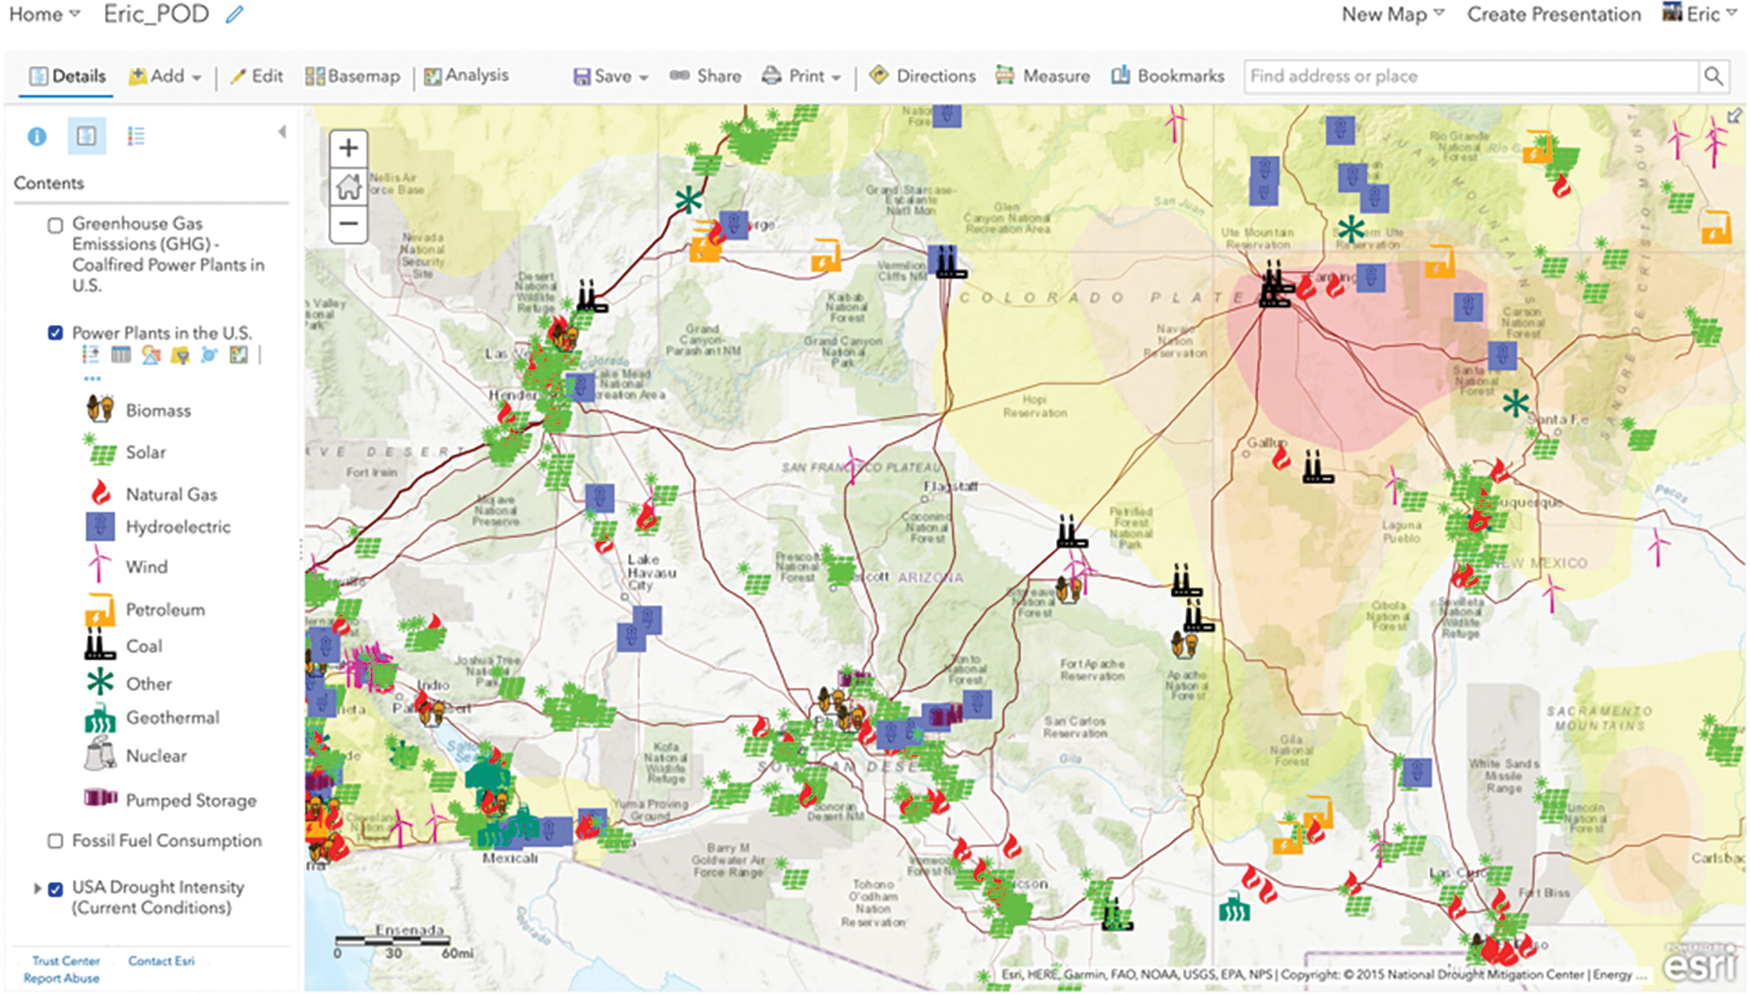
The outline is structured to focus students on examining where things are, what is nearby, and where areas of concentration are found by listing relevant findings. For example, in Figure 3 we put together a map within ArcGIS Online showing the locations of power plants and transmission lines in the southwestern region of the United States. While examining the map, students were asked to analyze the proximity of power plant locations to various cities and neighborhoods. Probing questions such as, “What type of power plant is close by?” “Which resources are being used in the creation of each power plant’s electricity?” and “What types of information would report carbon dioxide emissions from throughout the area?” helped scaffold students back to the overarching question.
Day 3–4: Acquiring Additional Data
For the third and fourth days, students should continue searching the internet for additional information to support their claims. Searching activities will need scaffolding from the teacher so students do not get lost looking at unverifiable or potentially discredited information (e.g., Who is the author? What is the quality of data?). We recommend looking at government websites, local news organizations, and overall reputable sources such as USA Today and Reuters as places to find facts and evidence that support their claims (Media Bias Fact Check 2019). There are many different directions students can go in during this part of the process and that is why we have included it as a two-day process.
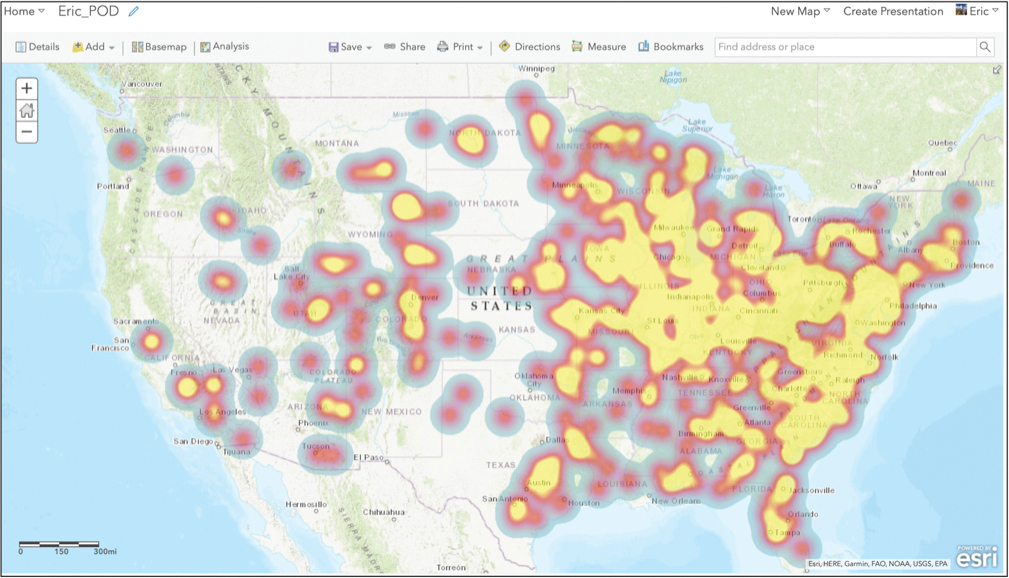
While acquiring additional data, students should continue constructing their outlines to help organize their thoughts and ideas into what will eventually be a presentation. Based on their initial inquiries, students can search the internet and library resources for evidence to support their claims based on what the geospatial data tells them. For example, additional data within our class ranged from finding extra layers in ArcGIS Online such as concentrations of greenhouse gas emissions from coal-fired power plants to finding news stories and federal and state policies on carbon dioxide emissions. Collecting additional data gave students a chance to build on their own knowledge to help them make convincing arguments supported by evidence.
Day 5–6: Analyze and Interpret Data, Argue from Evidence, and Revise Arguments
After students familiarize themselves with maps and collect information in relation to the overarching question, they can begin to openly discuss their ideas in a shared environment of peer feedback and recommendation. Depending on what the teacher sees as appropriate, having an open discussion with the class will allow time for reflection and critique. Students make their thinking visible so they can work on ideas together. The important focus here is not to subject students to ridicule but rather to give them an opportunity to listen to other perspectives. By the end of the fifth day, students should have a structured draft of their outline displaying any potential revisions to help strengthen their understanding and argumentation. By the end of the sixth day, students should have a final outline reflecting how they intend to present their findings and claims.
Day 7–8: Presentations
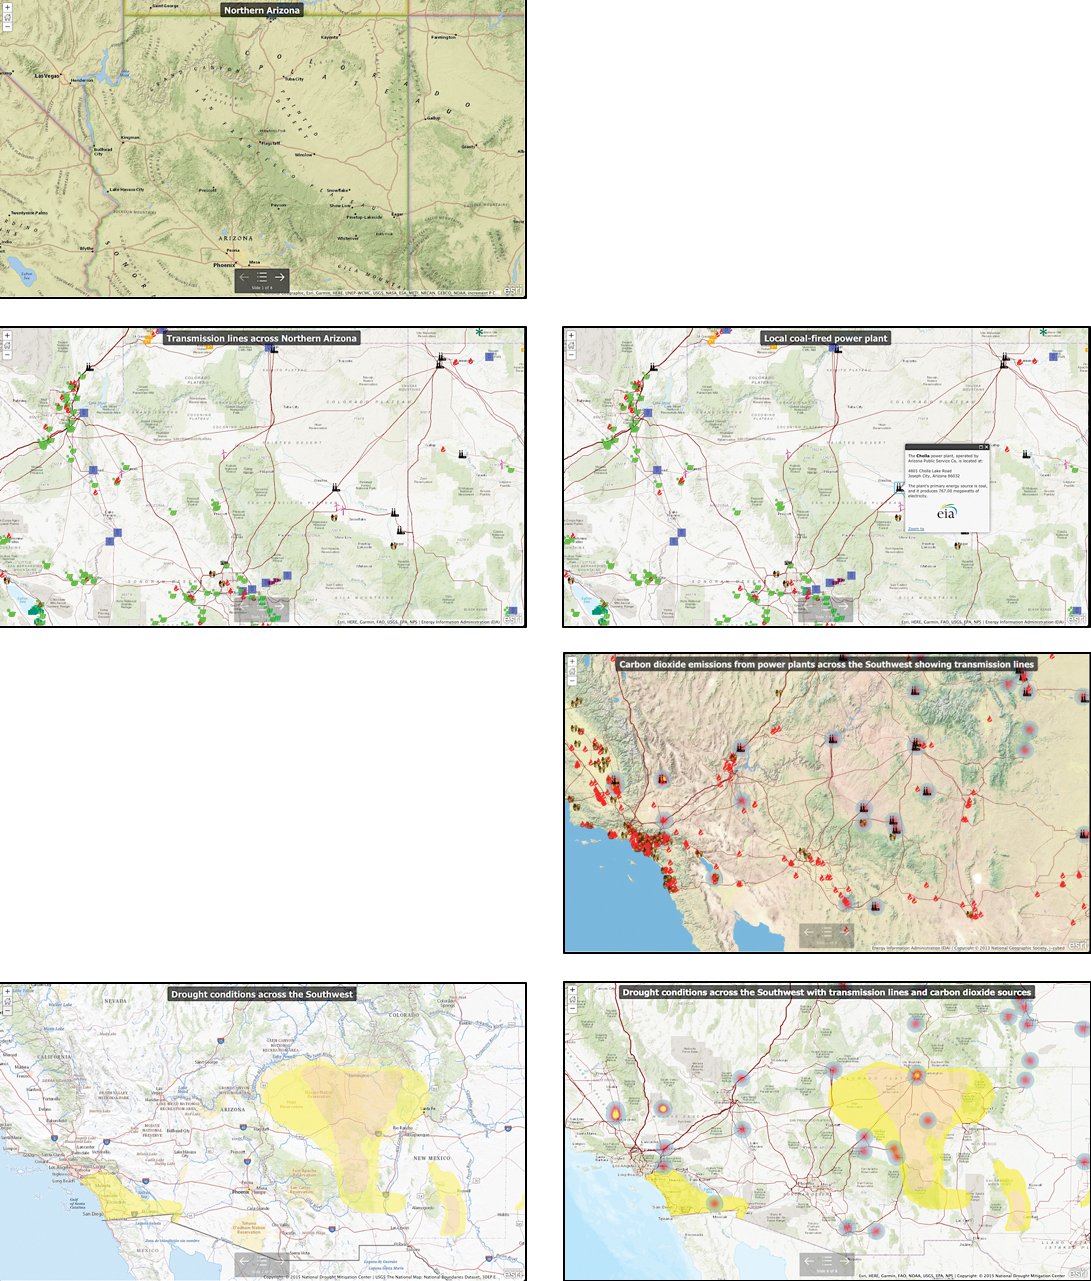
It should be noted that the timing of students presenting their work will greatly vary from classroom to classroom, so we recommend altering lesson plans to make sure students have sufficient time to make their cases. The presentation of students’ work can come in multiple forms such as slide shows (an example of an ArcGIS Online version is provided in Figure 6), portfolios, Storymaps (an additional feature from ArcGIS Online), and essays. These various formats should be guided by the outline constructed over the course of the lesson. Students are given 3–5 minutes to present their work during class and address questions from their peers. Depending on the number of students in your class and your students’ ability to complete their outlines by Day 7, you may need an extra day to complete presentations.
Assessment
| Sample rubric for presentations where students are evaluated on their argumentation using geospatial data. (modified from LDC CoreTools, 2019) | ||||||||||||||||
|---|---|---|---|---|---|---|---|---|---|---|---|---|---|---|---|---|
|
| The questions below help teachers design their assessments. | ||||||
|---|---|---|---|---|---|---|
|
The sessions of open discussion and peer feedback will give students and the teacher time to connect and help one another in the co-construction of their knowledge. Participation points can be included where students only receive points by asking and/or answering productive questions during the discussion sessions. The outline and discussion sessions can be used as opportunities for students to ask questions, analyze, and interpret geospatial data. A final outline and presentation will put forward the evidence needed to showcase their understanding of geospatial data and what they feel would be the next steps.
Diversity and accommodations in the use of geospatial inquiry
Geospatial Inquiry can be used for a multitude of purposes. For example, teachers within our research have used Geospatial Inquiry for looking at wildlife risks in public parks, the life history of endangered species, the history of civilizations within a particular ecosystem, social movements across the country, and human impacts on wildfires. Teachers should feel encouraged to use Geospatial Inquiry in a variety of disciplines within a variety of concepts. For other examples of using geospatial data within Geospatial Inquiry, please see (2019) and ESRI (2019a). And, for those in the Midwestern, Southern, and Eastern regions, we recommend World Precipitation Change 2050 Scenario 8.5. In addition, while we chose to use ArcGIS Online from ESRI as the geospatial technology tool, there are other GIS resources available for this activity you may want to explore. Some resources that may be of use include:
- http://www.geotechcenter.org/curriculum-resources.html
- https://storymap.knightlab.com/
- https://myworldgis.org/
- https://opensource.com/alternatives/arcgis
- https://mapstory.org/
- https://www.edutopia.org/blog/studentsmap-real-world-issues-free-geospatial-tools-suzie-boss
Adapting the unit to accommodate students with visual impairments or learning disabilities will require additional forethought. ESRI recommends using screen readers and a keyboard to navigate on-screen elements for the visually impaired; for further information please refer to ESRI (2019b). For students with learning disabilities, we recommend reading Casey (2016) and note the author’s take on personalized learning and the challenges and practices that come with technology and students’ learning.
ACKNOWLEDGMENT
This material is based upon work supported by the National Science Foundation under Grant No. (DRL 1513287). Any opinions, findings, and conclusions or recommendations expressed in this material are those of the author(s) and do not necessarily reflect the views of the National Science Foundation.
Inquiry Interdisciplinary Technology High School