feature
The Aurora Borealis
A dazzling STEM activity
Ask your students if they’ve ever heard of the Northern Lights (Aurora Borealis.) Most likely a large number of students have heard of them, and know that they are a phenomenon in the sky. Although students may not have seen the Northern Lights, most have probably seen other phenomena in the sky, such as a rainbow, shooting star, or super moon. These experiences provide an opportunity for students to reflect on the awesomeness of space.
This activity will show how mathematics is used by scientists to predict when the Northern Lights will occur, and should be used only after students have learned how to evaluate equations, create Venn diagrams, and calculate simple probability. These activities inform the class as a whole about the earth’s place in the universe and space systems, an important scientific practice identified in the Next Generation Science Standards (NGGS Lead States 2013) (see Online Connections).
It all starts on the Sun
Explain that the temperature of the center of the Sun is approximately 27 million degrees Fahrenheit or 15 million degrees Celsius! This heat in the core of the Sun causes convection near its surface, which generates magnetic fields. These fields can get twisted and tangled, causing the release of energy that produces solar flares and/or the ejection of billion-ton clouds of plasma called coronal mass ejections (CME). CMEs reach Earth in approximately 40 hours, causing disturbances in Earth’s magnetic field, which accelerate charged particles into the polar regions where they cause the dramatic and dazzling phenomenon known as the Northern Lights.
At this point, distribute the article “Aurora…fabled glowing lights of the Sun-Earth connection”. Give students a chance to read the article and make notes of the most important points. When everyone is done, collectively discuss these key points and make a public recording of them that can be referred to as needed throughout the activity (for example writing them on a large post-it easel pad or on portions of the board). Next, engage the students in a discussion surrounding the article to ensure everyone has a solid baseline understanding. Table 1 offers suggested question prompts and potential student responses.
| Table 1. Aurora article discussion. | ||||||||||||||||||
|---|---|---|---|---|---|---|---|---|---|---|---|---|---|---|---|---|---|---|
|
In 1859 a solar storm, referred to as the Carrington Event, had a severe impact on the telegraph system. Provide students with the article “A Super Solar Flare”. Have students read the article independently, discuss with a neighbor, and then discuss the main points with the whole class. See Table 2 for suggested question prompts and potential student responses.
| Table 2. Carrington Event article discussion. | ||||||||||||
|---|---|---|---|---|---|---|---|---|---|---|---|---|
|
Next, motivate students to predict solar storms by providing them with a few modern examples of what an unexpected solar storm could do. For example, a solar storm could cause a gas pipeline to explode (possibly killing hundreds of people); make a satellite mysteriously fall silent, interrupting TV and cellular phone traffic; or cause a power blackout, throwing millions of people into darkness. Ask students how long they think they could make it without their cell phone, TV, or electricity.
At this point allow students to pose questions about solar storms and share ideas about why and how they might have such serious impacts on Earth. Record students’ questions and ideas on the board so you can refer back to them throughout the lesson.
Solar wind and CME velocity
The solar wind can act as a conveyor belt, dispersing plasma and magnetic fields from the solar surface throughout the solar system. This activity begins with basic instruction about 2-dimensional vectors, which is then extended to 3-dimensional vectors, and then finally applied to calculating the velocity of solar wind.
Begin by activating students’ prior knowledge. Engage them with a think (ask students to think), pair (ask students to talk to their neighbor), share (whole class discussion, while you compile a list on the board) asking students to brainstorm physical quantities that have magnitude and direction. Some examples of vectors that may interest students include: a football thrown by a player, a billiard ball after being hit, or wind currents.
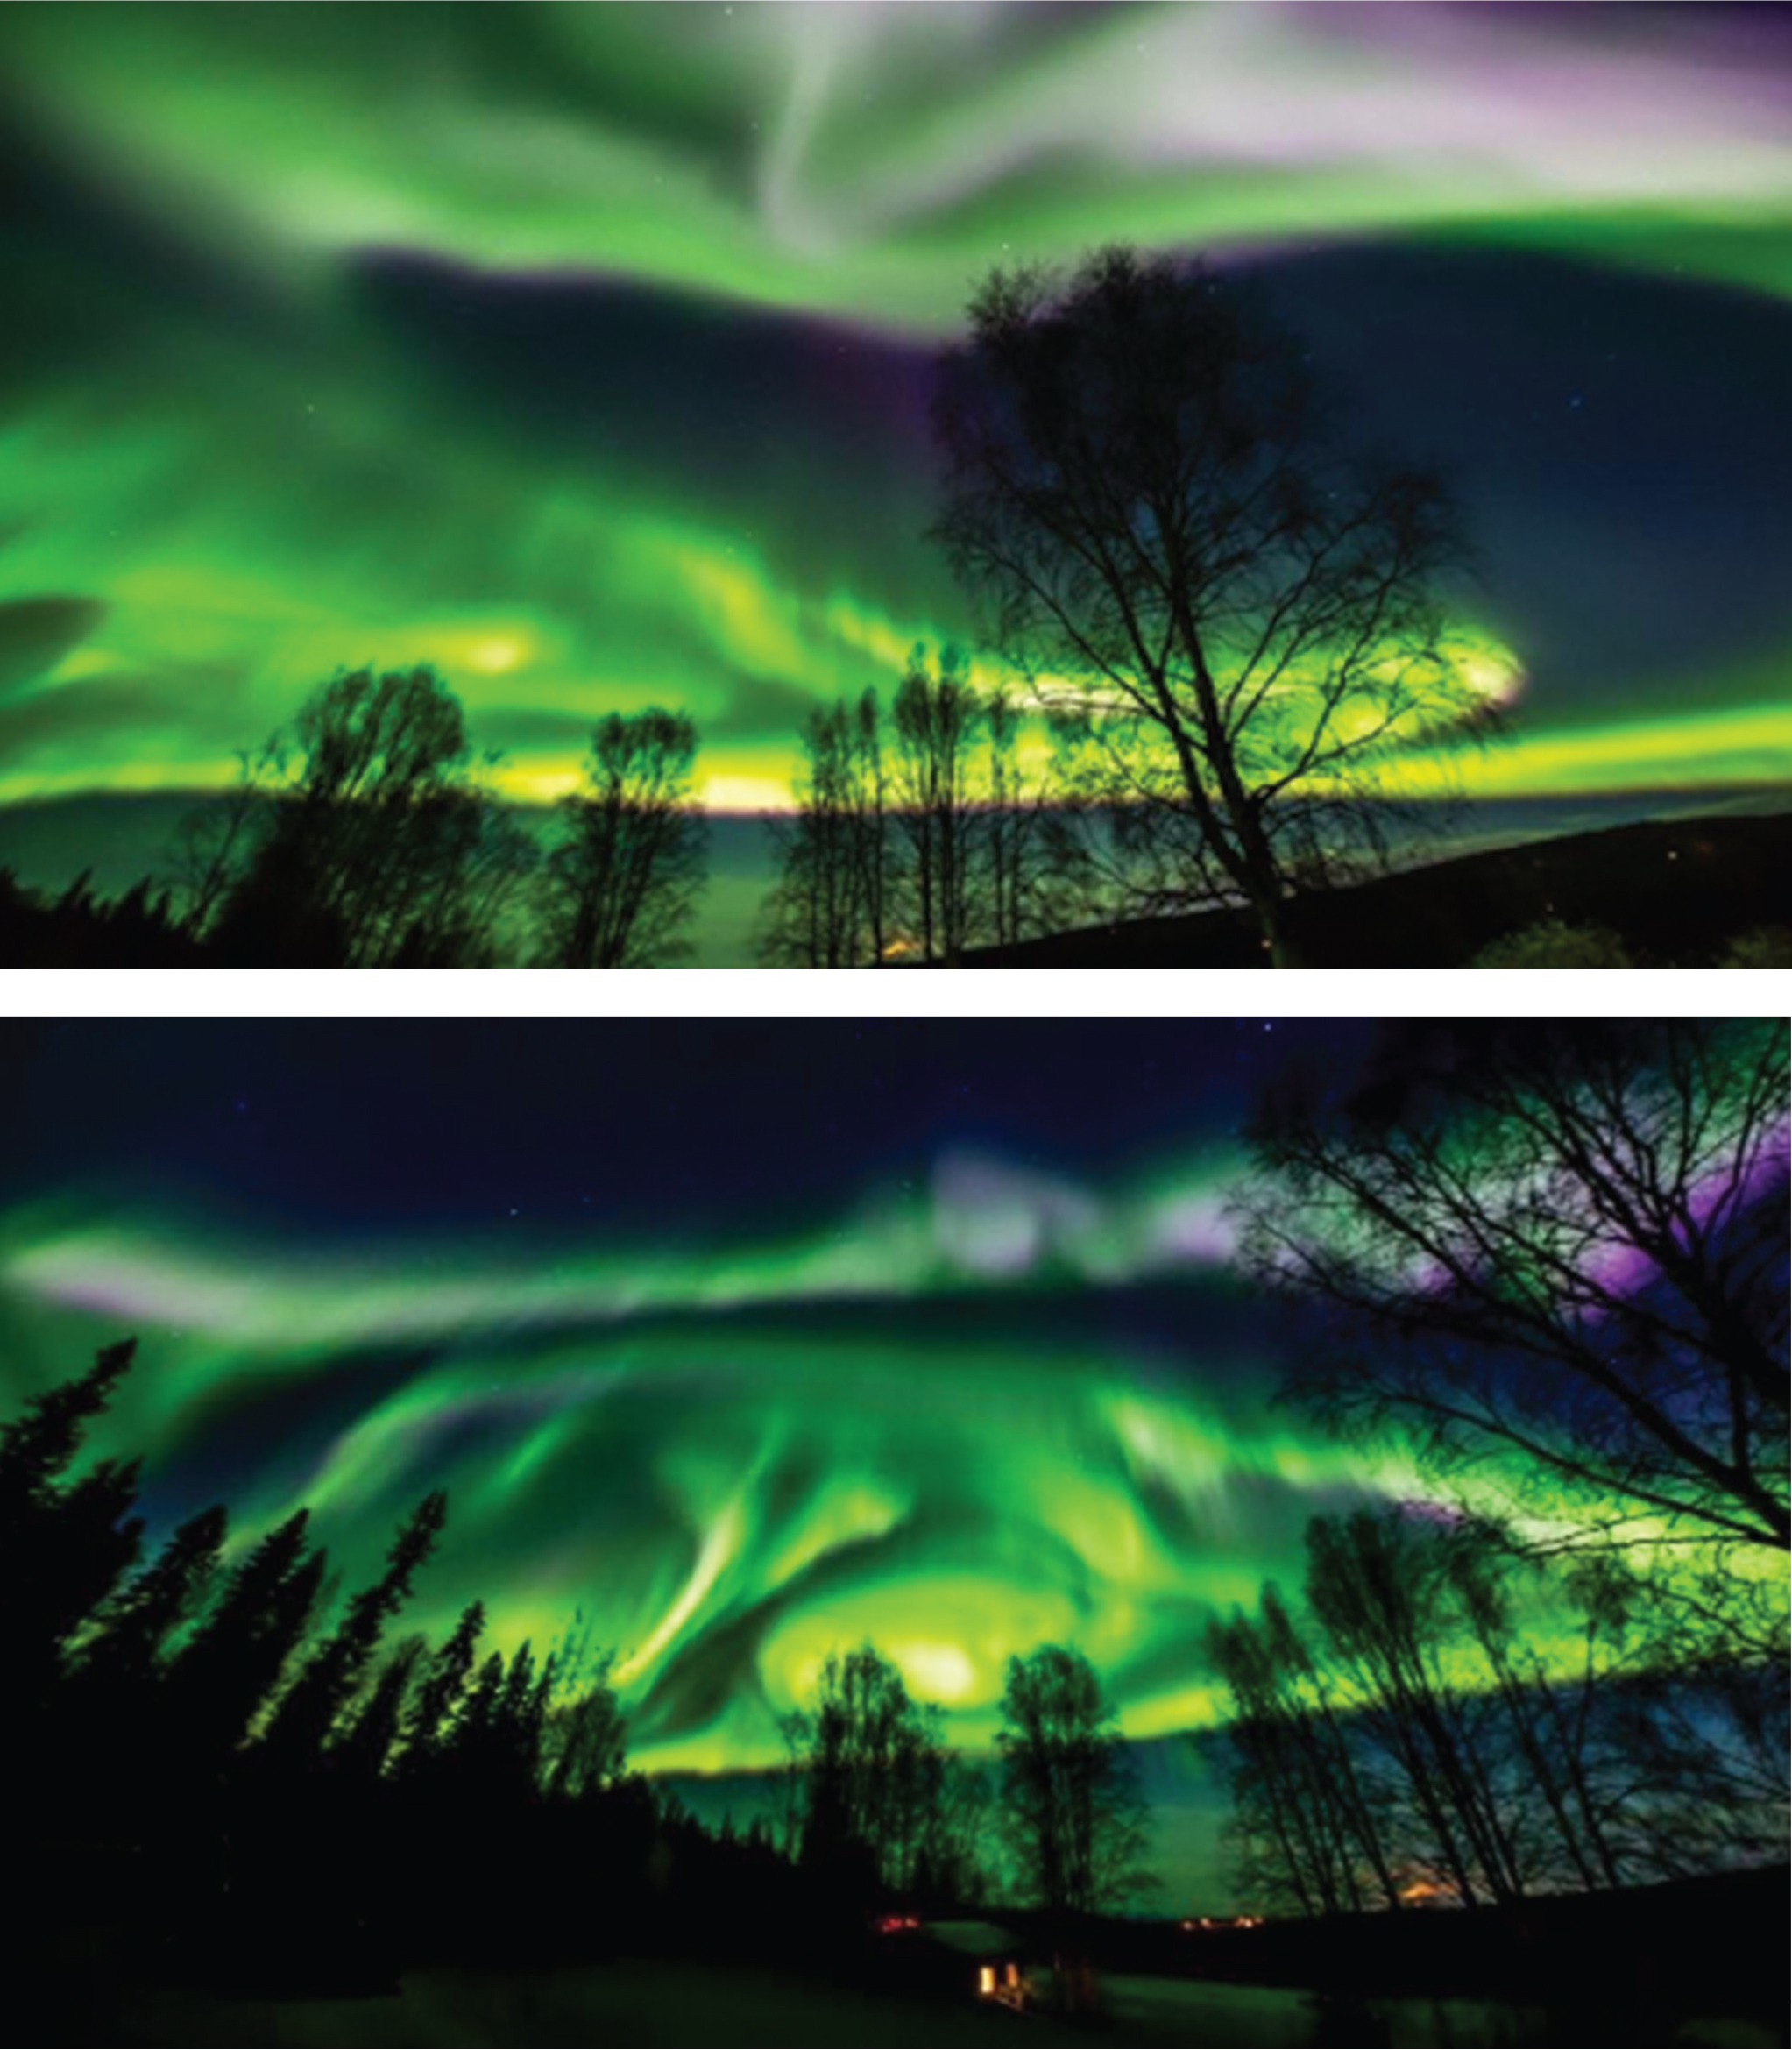
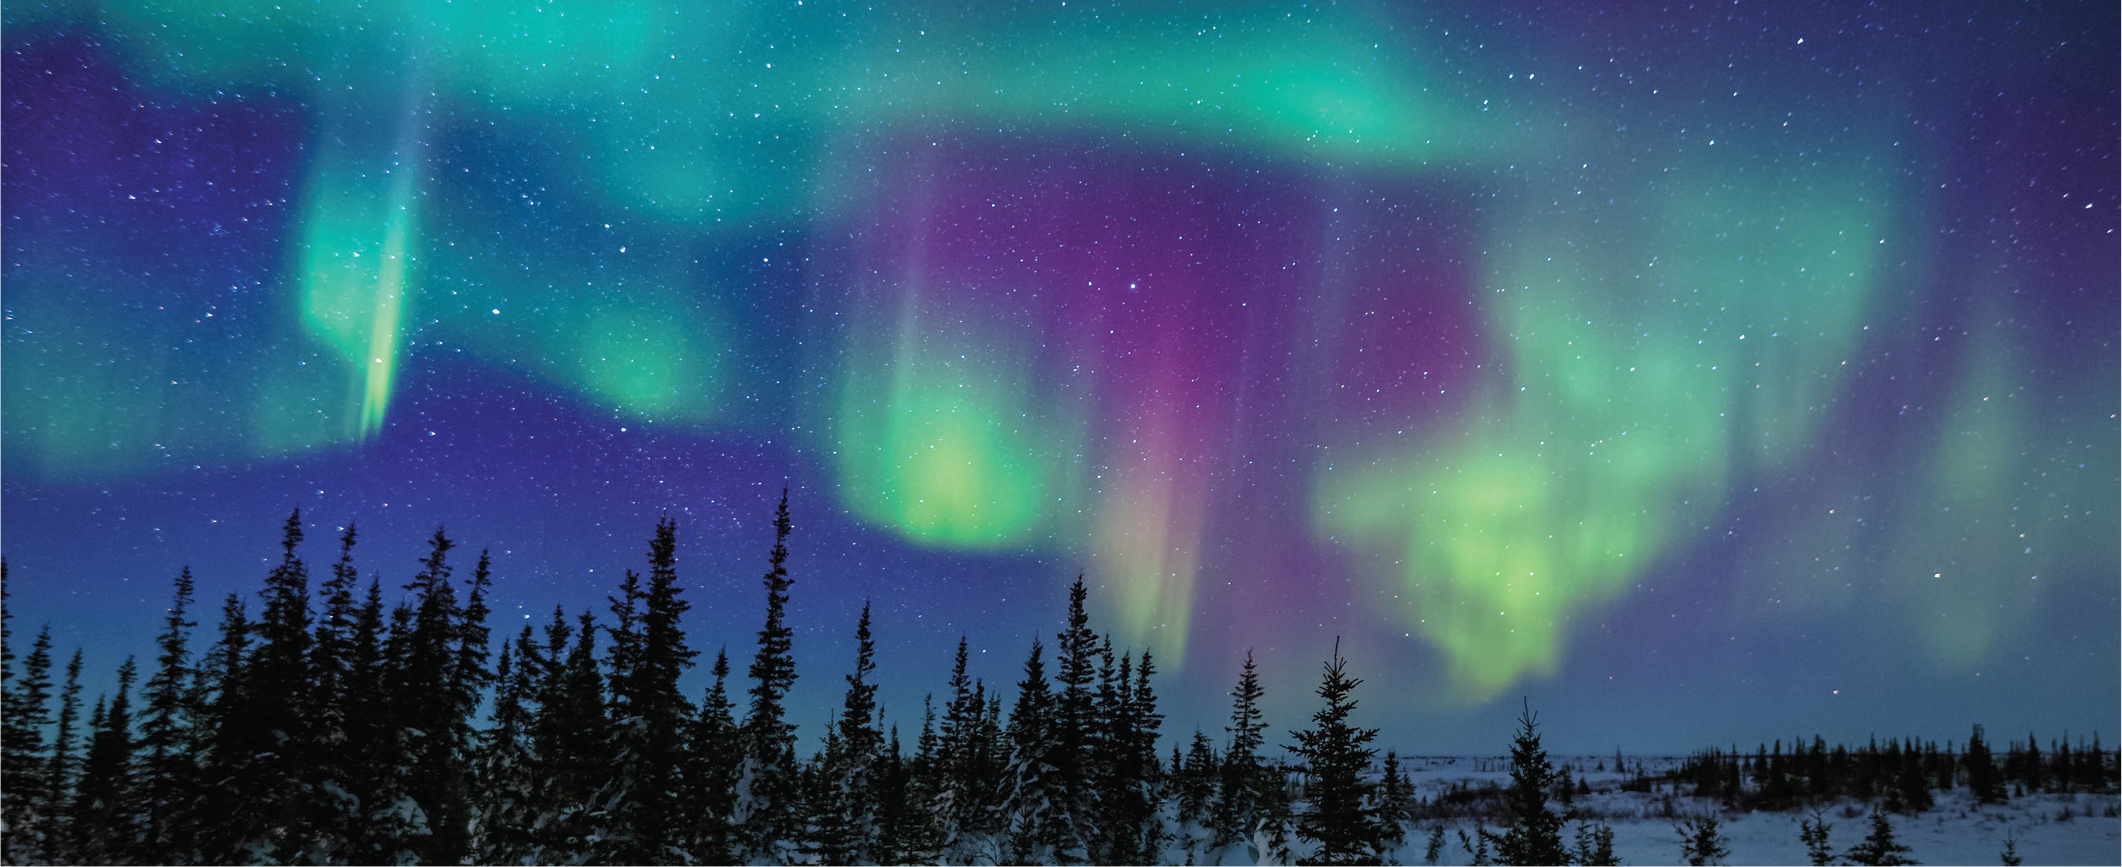
Images of the Aurora Borealis taken September 27, 2017 by Todd Paris. The two images (from the same night) show the variations of shapes and colors of the Aurora displays.
Tell students that a vector that starts at point P and ends at point Q would be written: PQ. Explain to students that vectors are arrows that represent two pieces of information: a magnitude value (the length of the arrow or distance traveled) and a directional value (the way the arrow is pointed or direction traveled). The magnitude of a vector is the distance between the initial point P and the end point Q. The magnitude of PQ is written: | PQ |. If the coordinates of the initial point and the end point of a vector are given, the distance formula can be used to find the magnitude of the vector (Figure 3A).
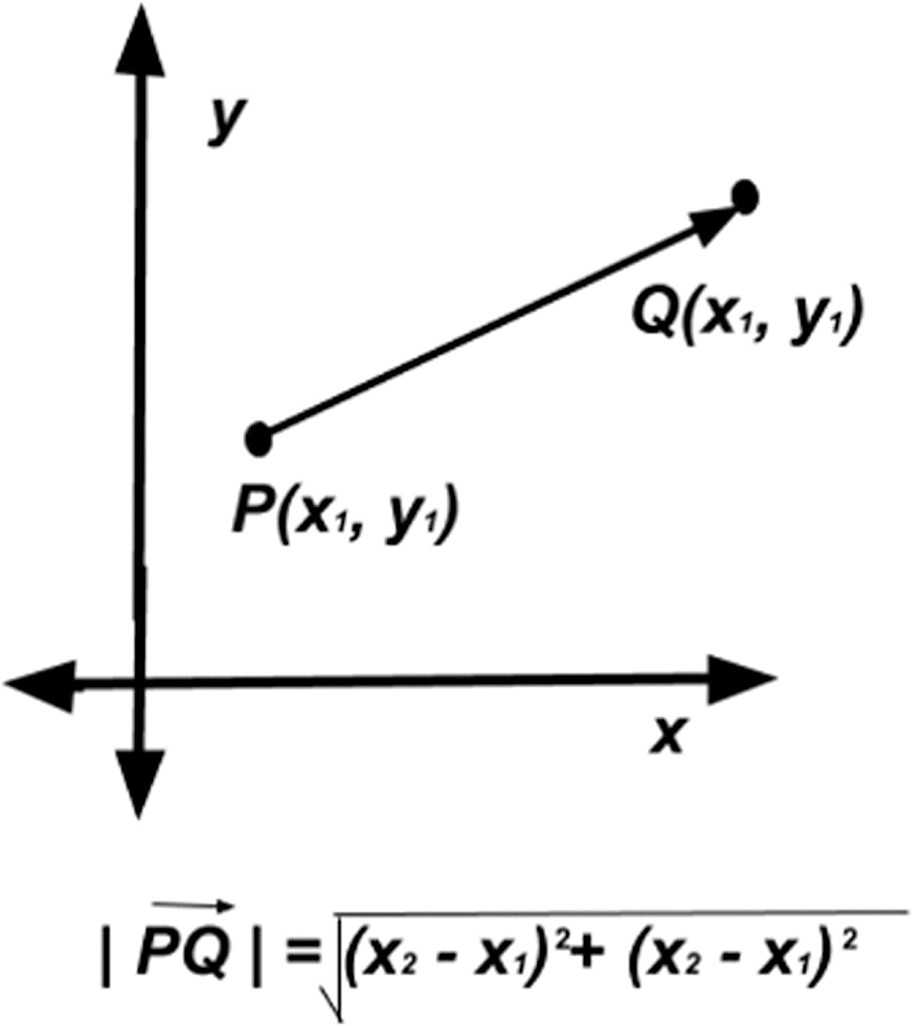
Magnitude of a vector
The direction of a vector is the measure of the angle it makes with a horizontal line. The following formula can be used to find the direction of a vector: tan θ = (y2−y1) / (x2−x1). Figure 3b provides students a concrete example of calculating a vector’s magnitude and direction. In this example | PQ | = sqrt {(4−1)2 + (7−3)2} = sqrt {9+16} = sqrt {25} = 5 and θ = (7−3) / (4−1) ≈ 53°.
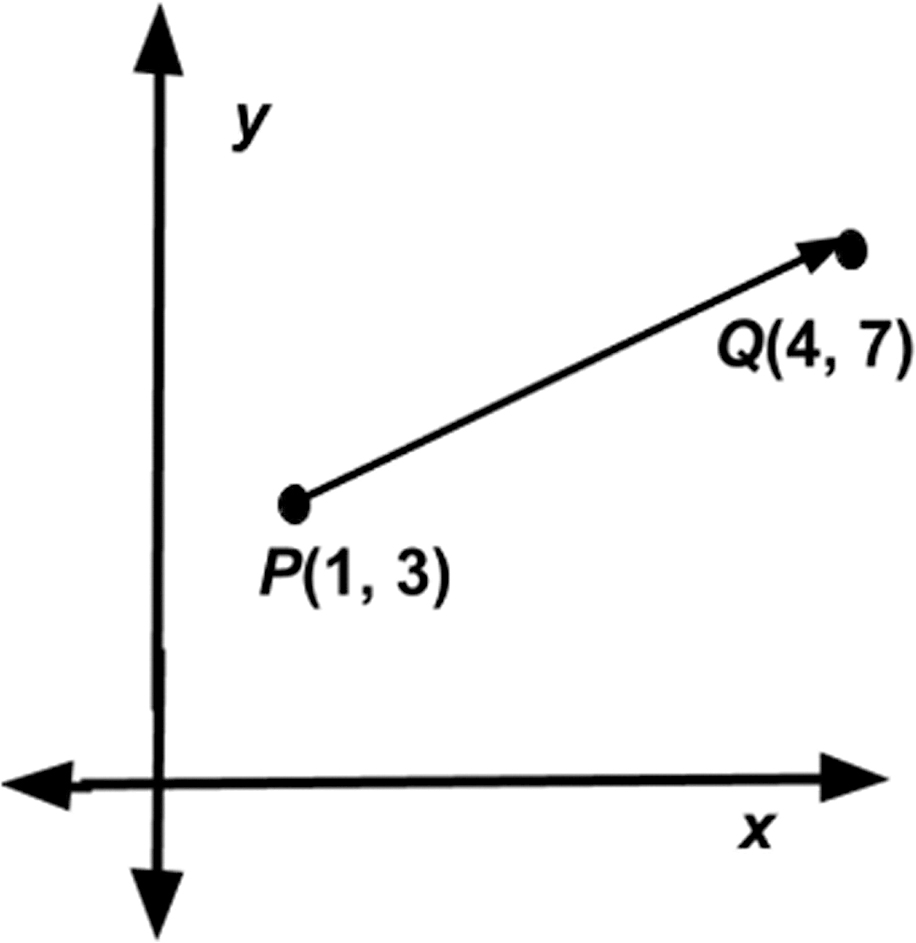
Example for calculating magnitude and direction of a vector.
Vectors provide us with a graphical method to calculate the sum of several simultaneous movements. Figure 3C shows that if movement is affected by only one variable (represented by vector A or by vector B), then the final position of the movement would be the end of that vector. However, if the movement is affected by two variables (represented by the sum of A and B), then the final position can be found by linking the two vectors together.
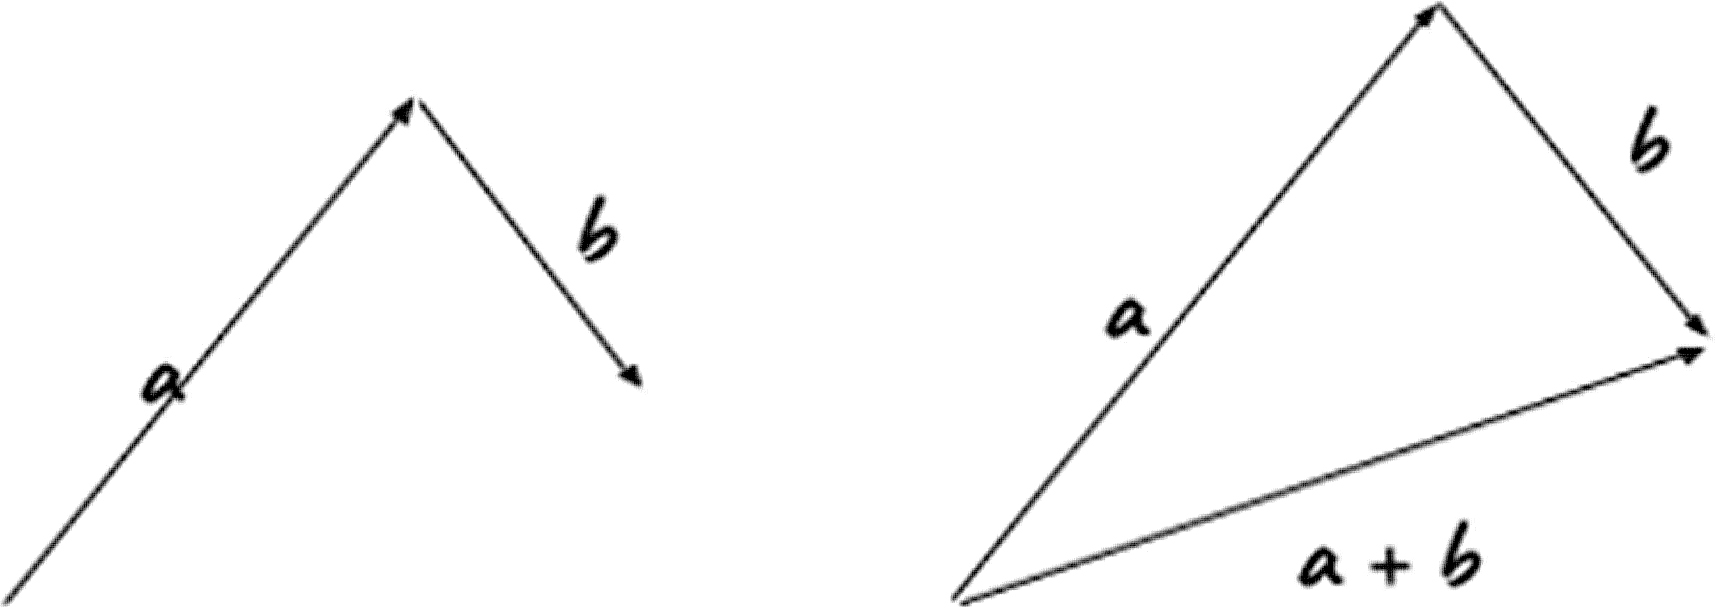
Vectors illustrating the final position of movement impacted by one and two variables.
Explain that the most typical way to perform calculations on vectors is to first describe the vectors in terms of their × (horizontal) and y (vertical) components. For example, if a = (4,12) and b = (18,7), then a + b = (4,12) + (18,7) = (4+18, 12+7) = (22,19). To subtract vectors, we will reverse the vector we want to subtract and then add the vectors. For example, if a = (4,12) and b = (18,7), then a− b = (4,12) + − (18,7) = (4,12) + (−18,−7) = (4+ −18, 12+ −7) = (−14, 5).
Next, transition into a discussion about calculating the magnitude of a vector. Explain that the magnitude of a vector is expressed by either one or two vertical bars on either side of the vector. For example, | a | or || a ||. To calculate the magnitude of a vector, we use the Pythagorean theorem. The formula is: | a | = sqrt {x2 + y2}. For example, the magnitude of vector w = (9,12) would be | w | = sqrt {92 + 122} = sqrt {81+144} = sqrt {225} = 15.
Explain to students that we will now extend what we learned about 2-dimensional vectors in the x-y plane to 3-dimensional vectors using the x-y-z axes. Since we live in a 3-dimensional world, it makes sense to define points using three coordinates (x, y, z). The x, y, and z axes are mutually perpendicular; each one is at right angles to the others.
For this coordinate system, the origin is at the center of Earth. The x-axis points from the center of Earth through the Prime Meridian (by convention chosen as the meridian in Greenwich, London, UK (longitude = 0). The z-axis points towards the north geographic pole (Figure 4). To find the magnitude of a vector in 3-dimensions we will use the following formula: | a | = sqrt {x2 + y2 + z2}. Ask students if they notice the similarity of the formulas for the magnitude of 2-dimensional and 3-dimensional vectors. Next, solidify students’ understanding with an example and visual representation (Figure 5). For example, the magnitude of vector m = (2,3,5) would be | m | = sqrt {22 + 32 + 52} = sqrt {4 + 9 + 25} = sqrt {38} ≈ 6.16.
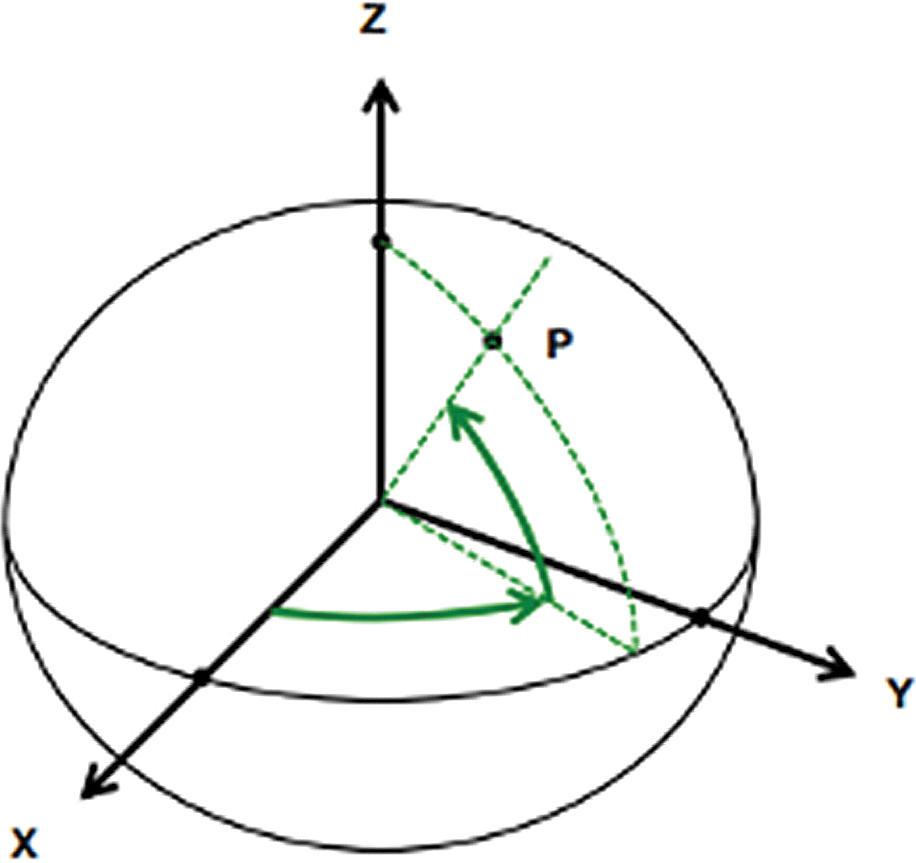
The xyz-coordinate system.
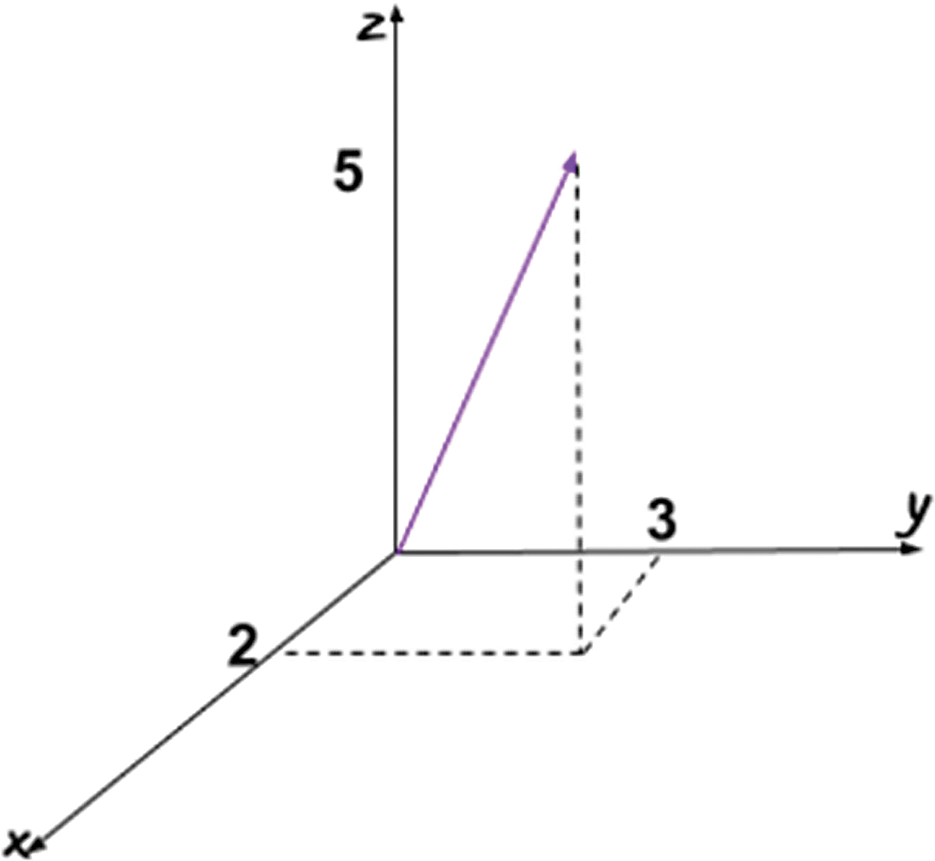
Magnitude of 3-dimensional vector.
Application
In this first Northern Lights application activity, students will be using data from NASA’s DSCOVR spacecraft and the 3-dimensional magnitude formula to calculate the strength of the solar winds’ velocity. The direction and intensity of the magnetic field determines the strength of geomagnetic storms and auroral events, and how disruptive they will be. When the Z-component of the magnetic field is large and negative, the solar storm event will be especially severe.
Provide students with the following example: A scientist measures the three components to the velocity of a solar storm event (x, y, z) in kilometers per second, and finds: (145, 103, 523.7).
a. Use the velocity formula above to calculate the total speed, v, of the solar wind.
b. Determine its transit time, T in hours from the Sun to Earth. Assume that the distance from Earth to the Sun is 150 million kilometers. Round your answer to the nearest hour.
Give students about 5 minutes to work the problem, then go over the correct solution:
a. Velocity
- v2 = (145.0)2 + (103.0)2 + (523.7)2
- v2 = 21,025.0 + 10,609.0 + 274,261.7
- v2 = 305,895.7 v = sqrt {305,895.7}
- v ≈ 533.1 kilometers per second
b.Transit time
- T = 150,000 km / 533 km/sec ≈ 281,425.89 seconds
- T = 281,425.89 sec / 60 = 4,690.43 minutes
- T = 4,690.43 min / 60 = 78.17 hours ≈ 78 hours
Explain that in 2018, the DSCOVR spacecraft measured the three components of the solar wind velocity at a location 1.5 million kilometers from Earth. Table 4 (see Online Connections) includes actual NASA data for a series of DSCOVR spacecraft measurements of the three components of the solar wind velocity. Instruct students to use the 3-dimensional magnitude formula, together with the three magnetic field measurements (x, y, z) in the data table, to:
a. Calculate the total speed, v, of the solar wind on each date. Round answers to the nearest kilometer per second.
b. Determine its transit time, T in hours from the sun to Earth. Assume that the distance from the earth to the sun is 150 million kilometers. Round answer to the nearest hour.
This should take approximately 15 minutes. Circulate around the room, monitoring student progress and aiding struggling students. At the completion of this portion of the lesson ask students to share both the strategies they used to solve the problems and the answers. Solutions can be found in Table 5 (see Online Connections).
What causes a solar storm?
Provide students with the following definitions:
1. Solar flare: A violent explosion of magnetic energy on the sun.
2. Coronal Mass Ejection (CME): A billion-ton cloud of plasma exploding from the solar surface.
3. Aurora: The emission of light by oxygen and nitrogen atoms in Earth’s atmosphere caused by a CME colliding with Earth’s magnetic field.
Explain that statistical data from these events can be used to draw conclusions about cause-and-effect relationships. Explain that astronomers use Venn diagrams to organize statistical information and use them to make predictions about what will happen near Earth.
Provide students with the following example. In 2000, 142 solar flares, and 89 CMEs were spotted on the Sun. Moreover, 34 flares happened at nearly the same time as CMEs.
a. What percent of CMEs are not accompanied by solar flares? Round your answer to the nearest whole number.
b. What are the odds of a CME not being accompanied by solar flares?
Give students about five minutes to work on the problems. Ask students to share both the strategies they used to solve the problems and the answers. Be sure that the Venn diagram and computations are shared during this debrief discussion. Solutions can be found in Figure 6.
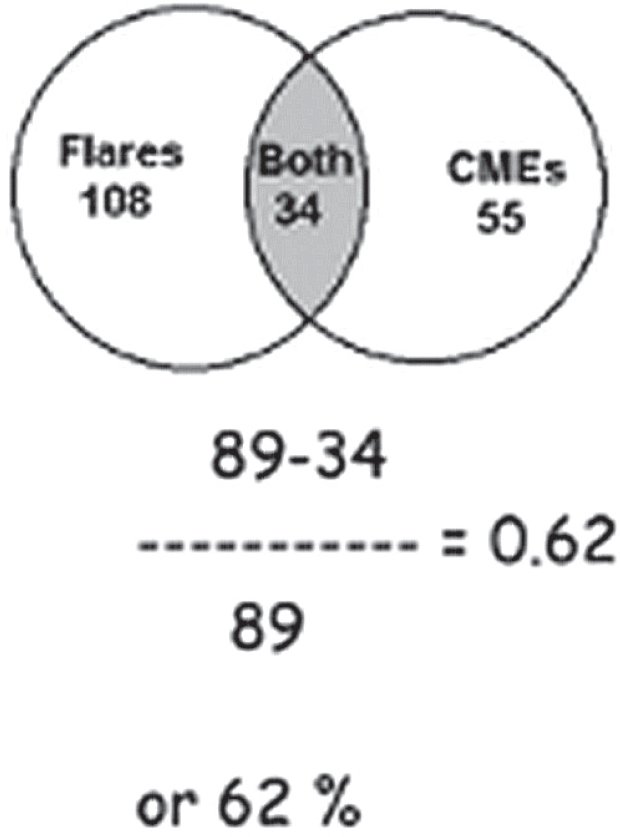
Percent of CMEs that are not accompanied by solar flares.
Students will now attempt to predict when the next Aurora will occur. Engage students in a Think-Pair-Share surrounding the question: Why is it important to predict when the next Aurora will occur? Students should be able to generate responses based on the Carrington Event they read about and discussed previously. During the share portion, provide students with any information that they are unable to generate (Table 6; see Online Connections).
Next, present the example and questions listed below. Provide students with about 20 minutes to complete the problems. Circulate around the room, monitoring student progress and aiding struggling students. Show students Table 6 (see Online Connections) and ask them to check that their tables contain all of the correct data.
Example
A NASA satellite called ACE measures changes in the magnetism of the gas flowing away from the sun. During 2000 it detects 56 severe magnetic changes. Another satellite called SOHO detects 55 CMEs of which 29 happen at the same time as the ACE disturbances. The IMAGE satellite detects aurora in the polar regions of Earth. A total of 63 bright aurora are detected during the 56 ACE magnetic ‘storms’. There are 31 cases where auroras are seen at the same time as the magnetic disturbances.
- Using the data from the example, what percent of solar flares do not happen during CMEs? What are the odds of a solar flare not happening during a CME? Round your answer to the nearest whole number. What do the odds indicate?
- A news reporter says that solar flares produce CMEs. Is this an accurate statement? Explain.
- What percentage of CMEs happen at the same time as a severe magnetic disturbance? What are the odds of a CME happening at the same time as a magnetic disturbance? Round your answer to the nearest whole number. What do the odds indicate?
- What percentage of magnetic disturbances lead to major aurora on Earth? What are the odds of magnetic disturbances lead to major aurora on Earth? Round your answer to the nearest whole number. What do the odds indicate?
- Can CME’s be reliably used to predict when the next aurora will occur? Explain.
Design project
After completing the activities presented in this article we recommend assigning students a follow-up project. Ask students to design something that could be used to prevent magnetic disturbances from interfering with electronics. This activity would engage students in all aspects of STEM and the integration of the three dimensions of the Next Generation Science Standards. Students could prepare presentations of the products they design to share with the class.
Teachers from other disciplines (computer science, technology, engineering, art/design, etc.) and community members with applicable professions (engineers, scientists, etc.) may be interested in mentoring students during this project and attending the final presentations.
Conclusion
The activities described in this article have the potential to have a powerful impact on students’ STEM learning. However, predicting solar activity is difficult and no better than a random toss of a coin (50:50 odds). The missing information that is vital to forecasting solar activity is the strength of the magnetic field in the z-direction. When this value is large and negative, the probability that a CME results in a severe geomagnetic storm is increased to over 90% (90:10 odds).
Online Connections
“Aurora…fabled glowing lights of the Sun-Earth connection” https://pwg.gsfc.nasa.gov/polar/EPO/auroral_poster/aurora_all.pdf
“Adventures in Space Science Mathematics” https://www.nasa.gov/pdf/714673main_Adventures_SS_Math.pdf
“A Super Solar Flare.” https://science.nasa.gov/science-news/science-at-nasa/2008/06may_carringtonflare
Connecting to the Next Generation Science Standards
Solar Wind Velocity data and answer key
Liza Bondurant (lbondurant@deltastate.edu) is Associate Professor, Division of Mathematics and Sciences at Delta State University, Cleveland, Mississippi. Sten Odenwald is Director of STEM Resource Development at the National Aeronautics and Space Administration, Greenbelt, MD.
Aerospace Astronomy Climate Change Crosscutting Concepts Disciplinary Core Ideas Earth & Space Science Environmental Science Inquiry New Science Teachers NGSS High School