
Feature
Data-Driven Science Vlogging for Connected Learning Anywhere
Connected Science Learning March-April 2022 (Volume 4, Issue 2)
By Rundong Jiang, Xiaotong Ding, Shannon Sung, Ashley Bulseco, and Charles Xie
Social media can promote formal and informal science education. Student-generated digital media such as chemistry vlogs (“video blogs”; Lawrie and Bartle 2013) have been used for students to express understanding of science concepts and co-create knowledge. Student-generated digital media shared on social media platforms like YouTube or TikTok (Hayes et al. 2020) can facilitate public participation in scientific research and science learning (Shirk et al. 2012), effectively turning social media into public spaces for inquiry and learning, or even communities of practice for citizen science (Liberatore et al. 2018).
During the COVID-19 pandemic, students and teachers have used existing social media platforms like TikTok to create everything from anthropomorphized chemistry videos (Hight et al. 2021) to a virtual biomechanics camp (Burks et al. 2021). However, in most cases, existing social media platforms were repurposed for science education. In general, these platforms lack technical features to support deep inquiry and active learning. For example, more than half of science-related videos on TikTok involve demonstrations of science in making, such as experiments and DIY projects (Zeng et al. 2021), but there is no easy way for the experimenters (i.e., “science vloggers”) to share their experimental data with the viewers for analyses, which is vital for evidence-based reasoning. These original data are typically archived on the vloggers’ computers and not shared with anyone else for further investigations. For the vlog viewers, their experience is typically limited to watching and listening as they have no access to the experimental data and are unable to use it to do their own analysis. Providing access to such data would give users the opportunity to develop skills such as using mathematical modeling, computational thinking, and constructing explanations from evidence, which are core competencies defined by the Next Generation Science Standards (NGSS).
A New Cyberinfrastructure for Science Vlogging
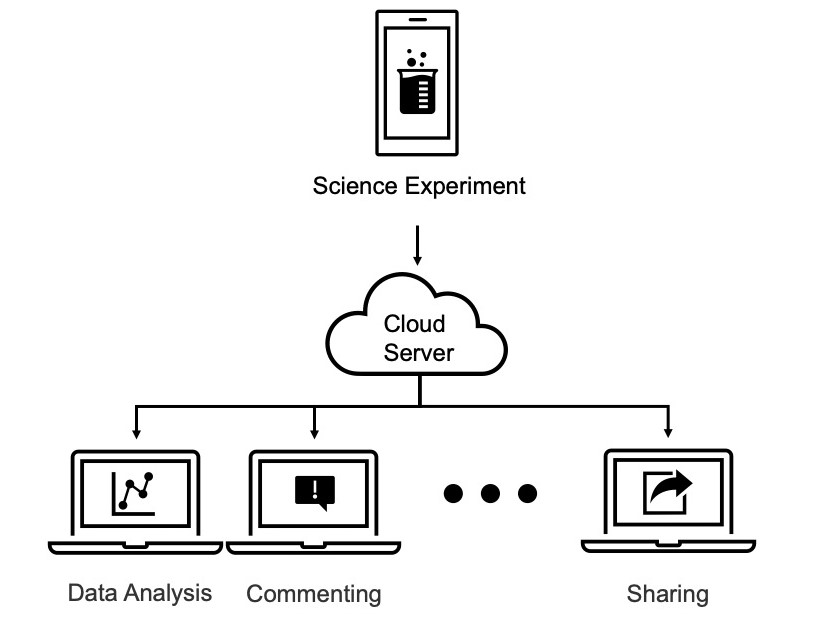
A lesson learned from the COVID-19 pandemic is that we need to build informal science learning environments that are resilient to disruptive events of such scale. This paper describes our preliminary work that transforms social media into a new type of interactive learning environment featuring data-driven capabilities. Based on the Internet of Things (IoT) technology, this new cyberinfrastructure, referred to as Telelab (Xie et al. 2021; Xie et al. 2022), allows users—both vloggers and viewers—to use smartphones and accessory sensors to collect and share experimental data along with videos that choreograph actions and procedures, anytime and anywhere. Vloggers can upload their experimental data alongside videos to the Telelab website to share their experiments with others either by livestreaming their experiments or observations to an audience in real time or creating interactive videos that allow viewers to experience their investigations at a later time. In Telelab, viewers can analyze published data of vlogger experiments with a graphical user interface (GUI) in their own browsers. As in typical social media platforms, viewers can share, rate, or comment on an experiment. A new feature that distinguishes Telelab from other social media platforms—which is enabled by its data-driven and sharing characteristics as an IoT technology—is the ability for a viewer to repurpose uploaded experimental data to conduct their own analyses. Viewers can even conduct meta-analyses by examining data from a combination of uploaded experiments to look for patterns and trends.
Examples
One example of how vloggers can use Telelab is by using a thermal camera attached to a smartphone. Below, we present three activities showing how Telelab can support connected science learning: (1) garden science: students inspect animals around them to learn about thermoregulation; (2) kitchen science: students observe interactions between common food ingredients to learn about physical chemistry; (3) building science: students inspect public buildings in their community to learn about heat transfer and energy efficiency (see Supplemental Resources for alignment with energy literacy concepts).
Example 1: Garden Science
Beginning in September each year, millions of monarch butterflies travel thousands of miles from Canada to Mexico. While their migration is a spectacle to behold, climate change is posing a threat to these creatures (Bladon et al. 2020). In the same way that biologists use infrared thermography to study how butterflies respond to temperature changes (Tsai et al. 2020), students can also use smartphone thermal cameras to observe butterflies in a garden and investigate how they thermoregulate under different conditions.
In this activity, students use the Infrared Explorer, a mobile sensing app as a frontend for Telelab, to control the thermal camera and observe butterflies in the shade (Figure 2a) versus in the sun (Figure 2d). Thermal images of a butterfly show that its temperature is close to ambient temperature when in the shade (Figure 2b), but higher when in the sun (Figure 2e). By connecting the Infrared Explorer app to the Telelab server, students can record both thermal video and temperature data and upload this information to the Telelab cloud servers as an interactive video, thus sharing their experiments with anyone through the internet.
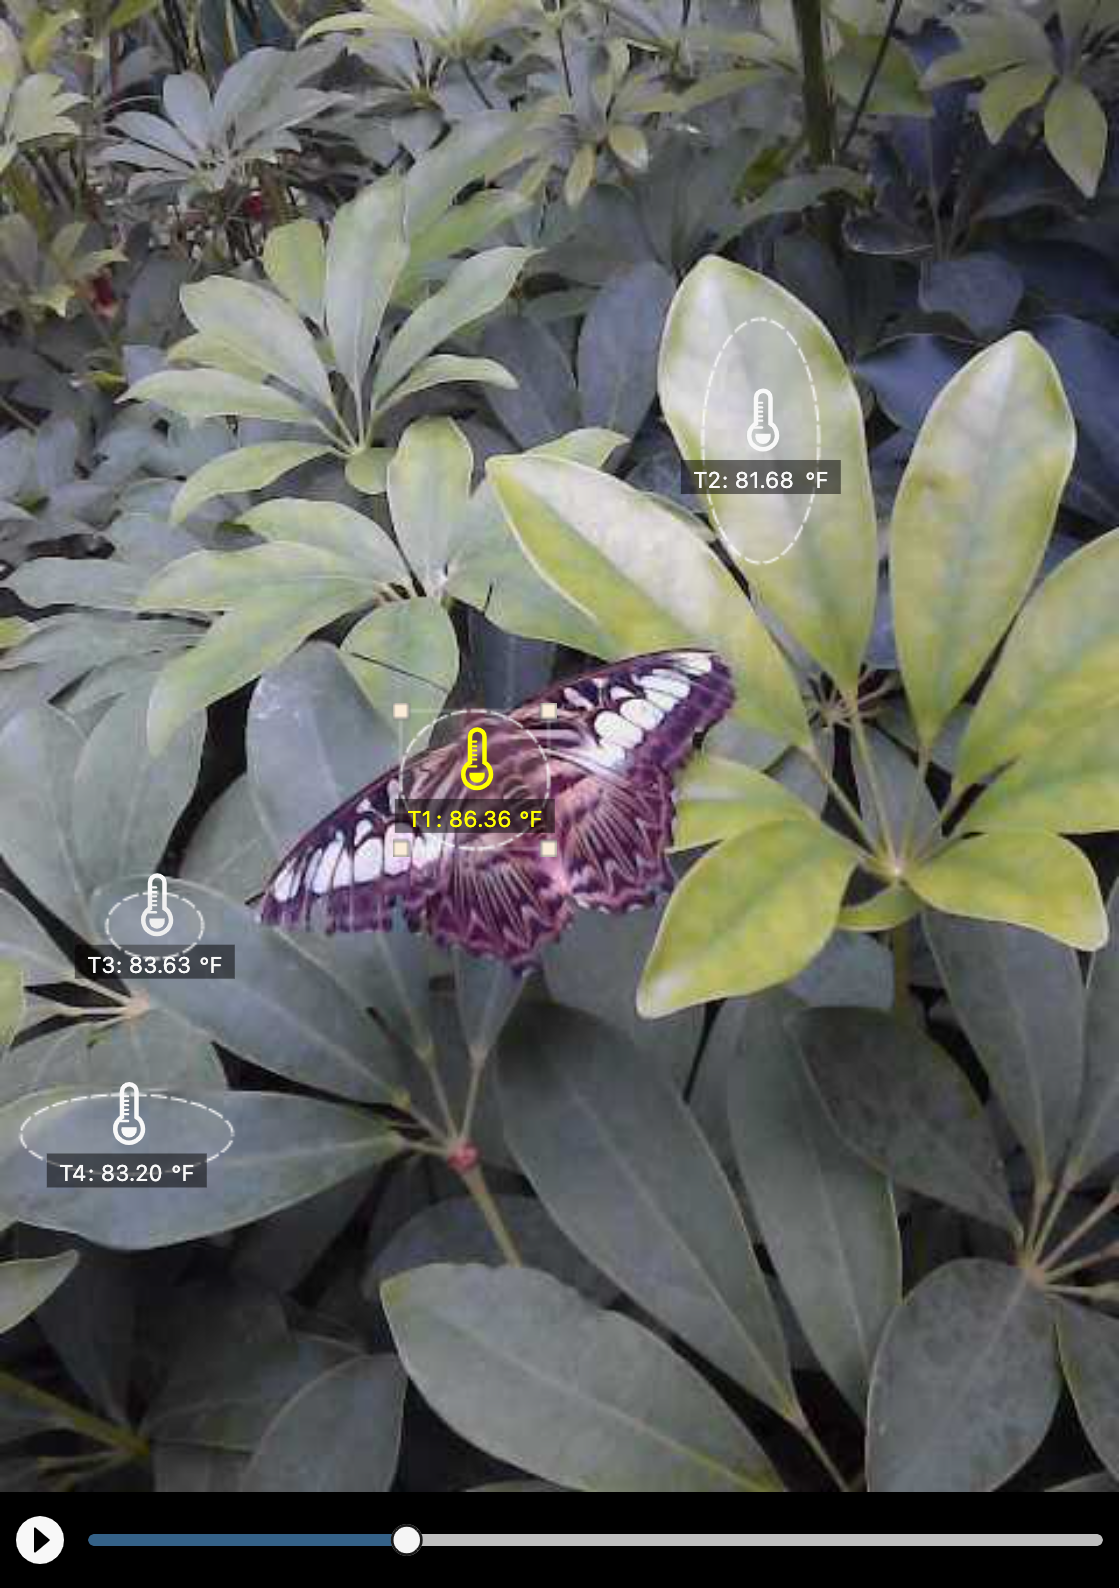
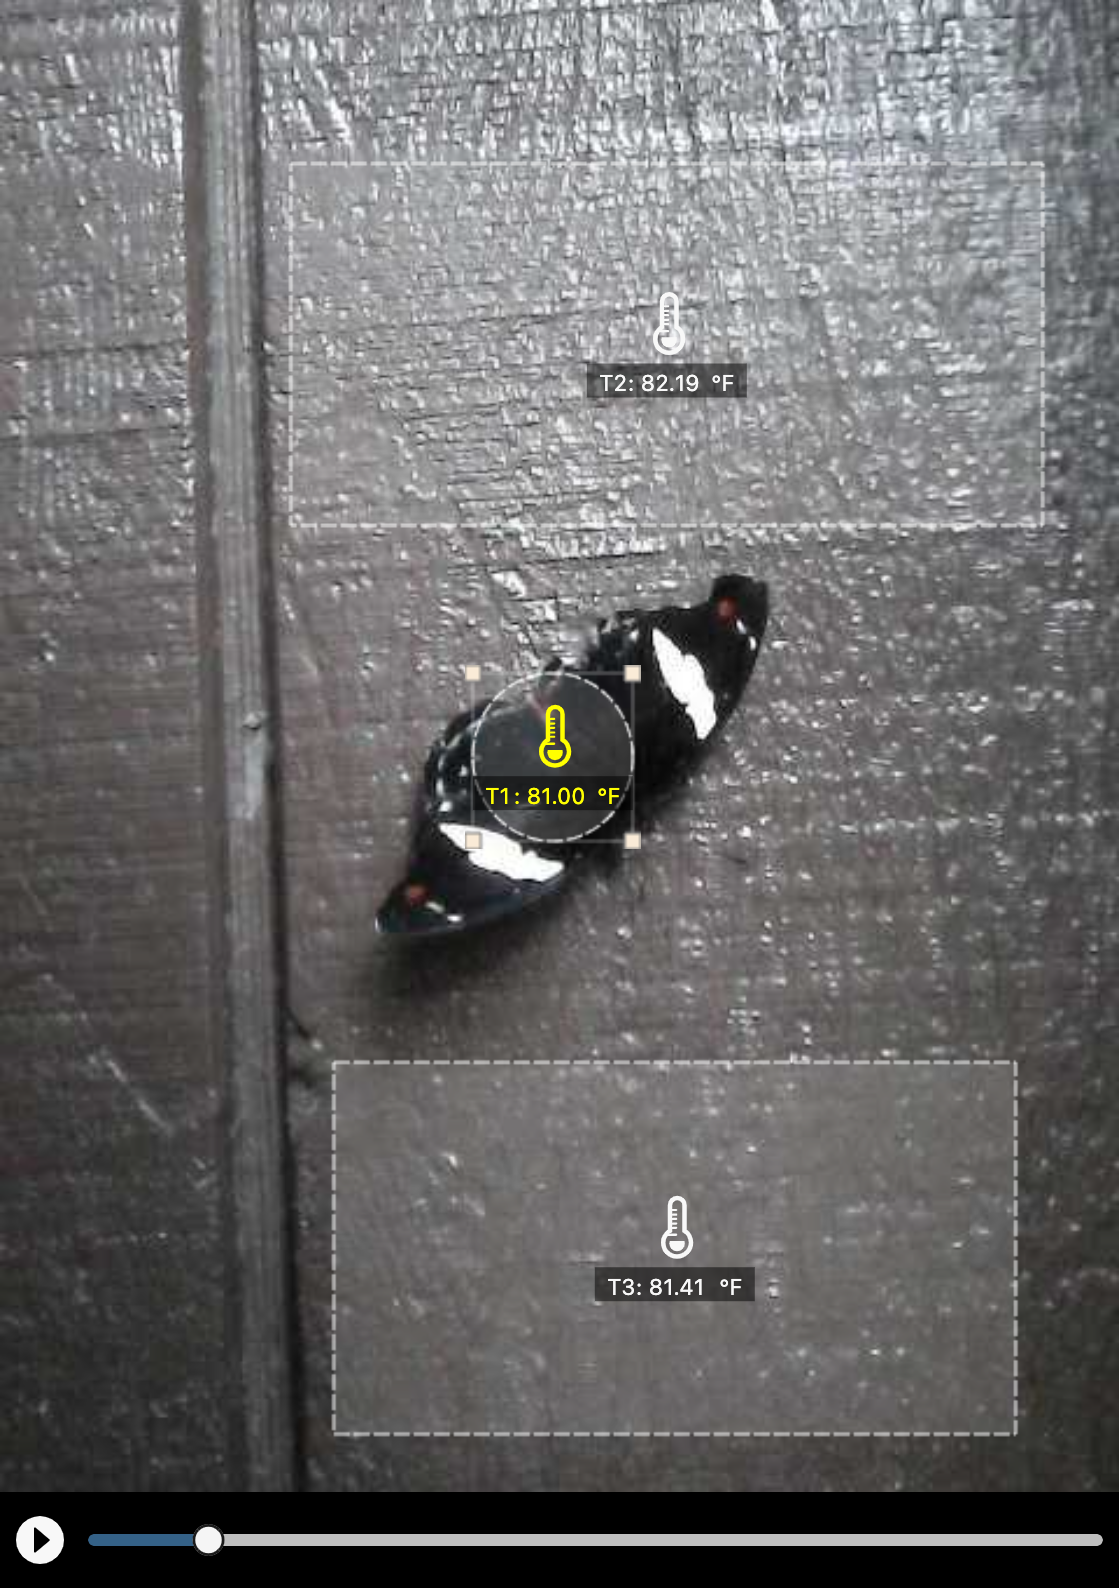
Viewers of such an interactive video can use the shared data to perform their own analyses. For example, one viewer may use the built-in virtual thermometer tool to calculate the exact temperature difference between the butterfly and the surrounding environment. Another viewer may use the area measurement tool instead to obtain smoother temperature readings. Yet another viewer may use the graphing tool to confirm whether the temperature difference persists over time (Figure 2c/f). Viewers then take the data they collected to draw conclusions (e.g., in this case to support the claim that a butterfly is a poikilotherm, an organism whose temperature fluctuates significantly and that thermoregulates through behaviors like basking). Such opportunities for data gathering and analysis, amplified by the Telelab platform, can help viewers investigate what it takes for ectotherms (species like butterflies that regulate body temperature depending on the environment) to survive and why certain temperature-sensitive species are particularly vulnerable to climate and habitat change (Bladon et al. 2020).
Telelab provides the cyberinfrastructure for anyone to contribute such observational data from anywhere. For example, informal science educators like field scientists working in nature reserves can livestream butterfly observation data and give guest lectures to classrooms all over the world. Students from different geographical areas can also share science vlogs of local butterfly species on Telelab. As creators, they are making personally relevant observations in their own localities and contributing experimental data to an open science community. As viewers, students can explore the biology of different places that they otherwise might not have access to, connect phenomena observed out of school with biological principles studied in school, and contextualize global issues such as climate change by interacting with these science vlogs.
Example 2: Kitchen Science
Similar to how coding platforms like Scratch allow novice users to interact with another user’s coding project, examine the source code, and add their own edits (also known as “remixing”), Telelab allows users to be inspired by science vlogs on Telelab to “remix” by tweaking the experimental design, performing their own experiments, and sharing them as new science vlogs. A perfect backdrop for such activities is the kitchen, a familiar place for measurement and experimentation.
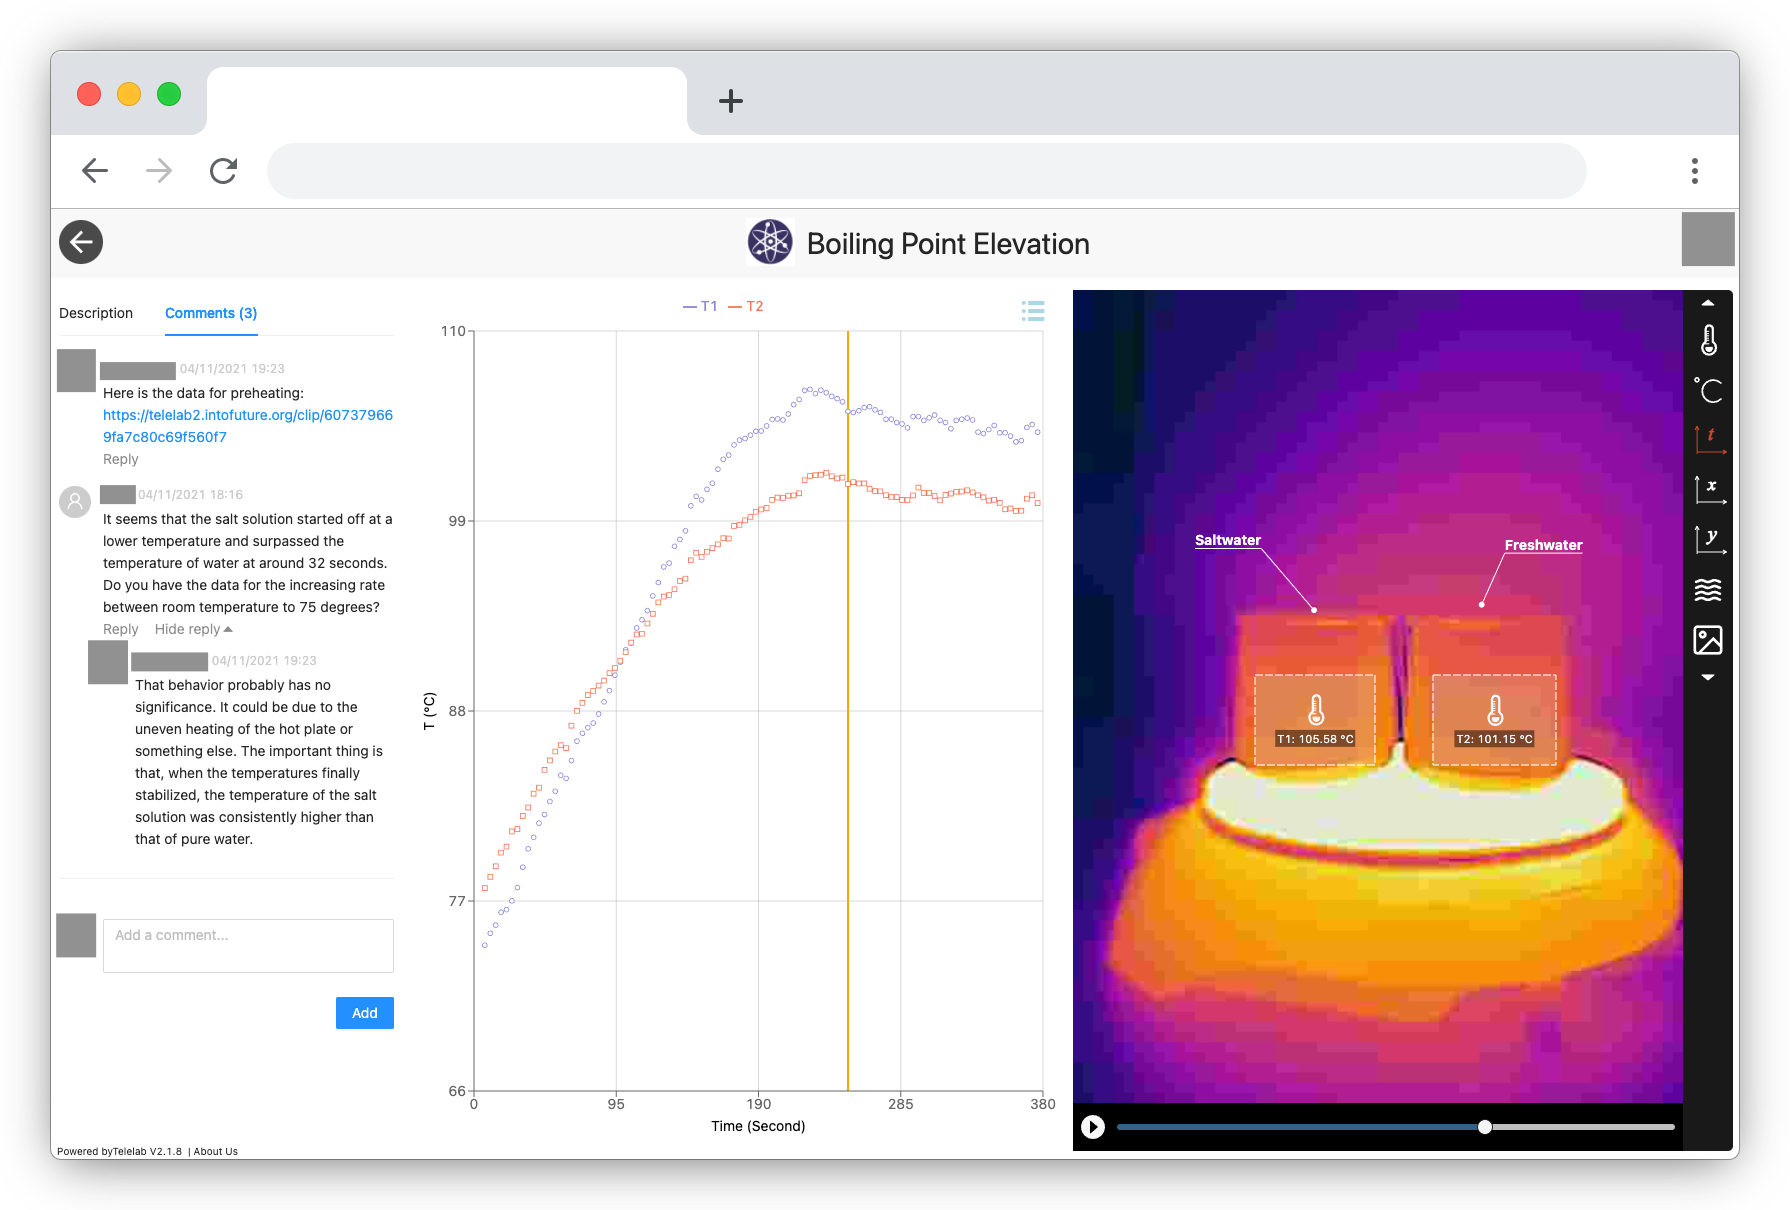
For example, many students know that it is commonplace to add salt to water when boiling pasta, and they may even have hypotheses about what happens when this is done. Before rushing online for existing explanations, students can use Telelab to test their hypotheses by conducting a simple experiment, for example, by investigating heating and boiling of tap water and salted water under the same experimental conditions. When students use a thermal camera and the Infrared Explorer app to stream the boiling processes to Telelab, they create an interactive science vlog with rich temperature data that allows any viewer to participate in the inquiry by constructing their own reasoning. By comparing the temperature changes of salted water and tap water over time using virtual thermometers and the graphing tool on Telelab, viewers can conclude that people add salt to pasta water because doing so raises the boiling temperature, and thus accelerates the cooking process. If viewers have questions about the experiment design or need any supplementary data, they can also communicate with the creator in the comment section (Figure 3).
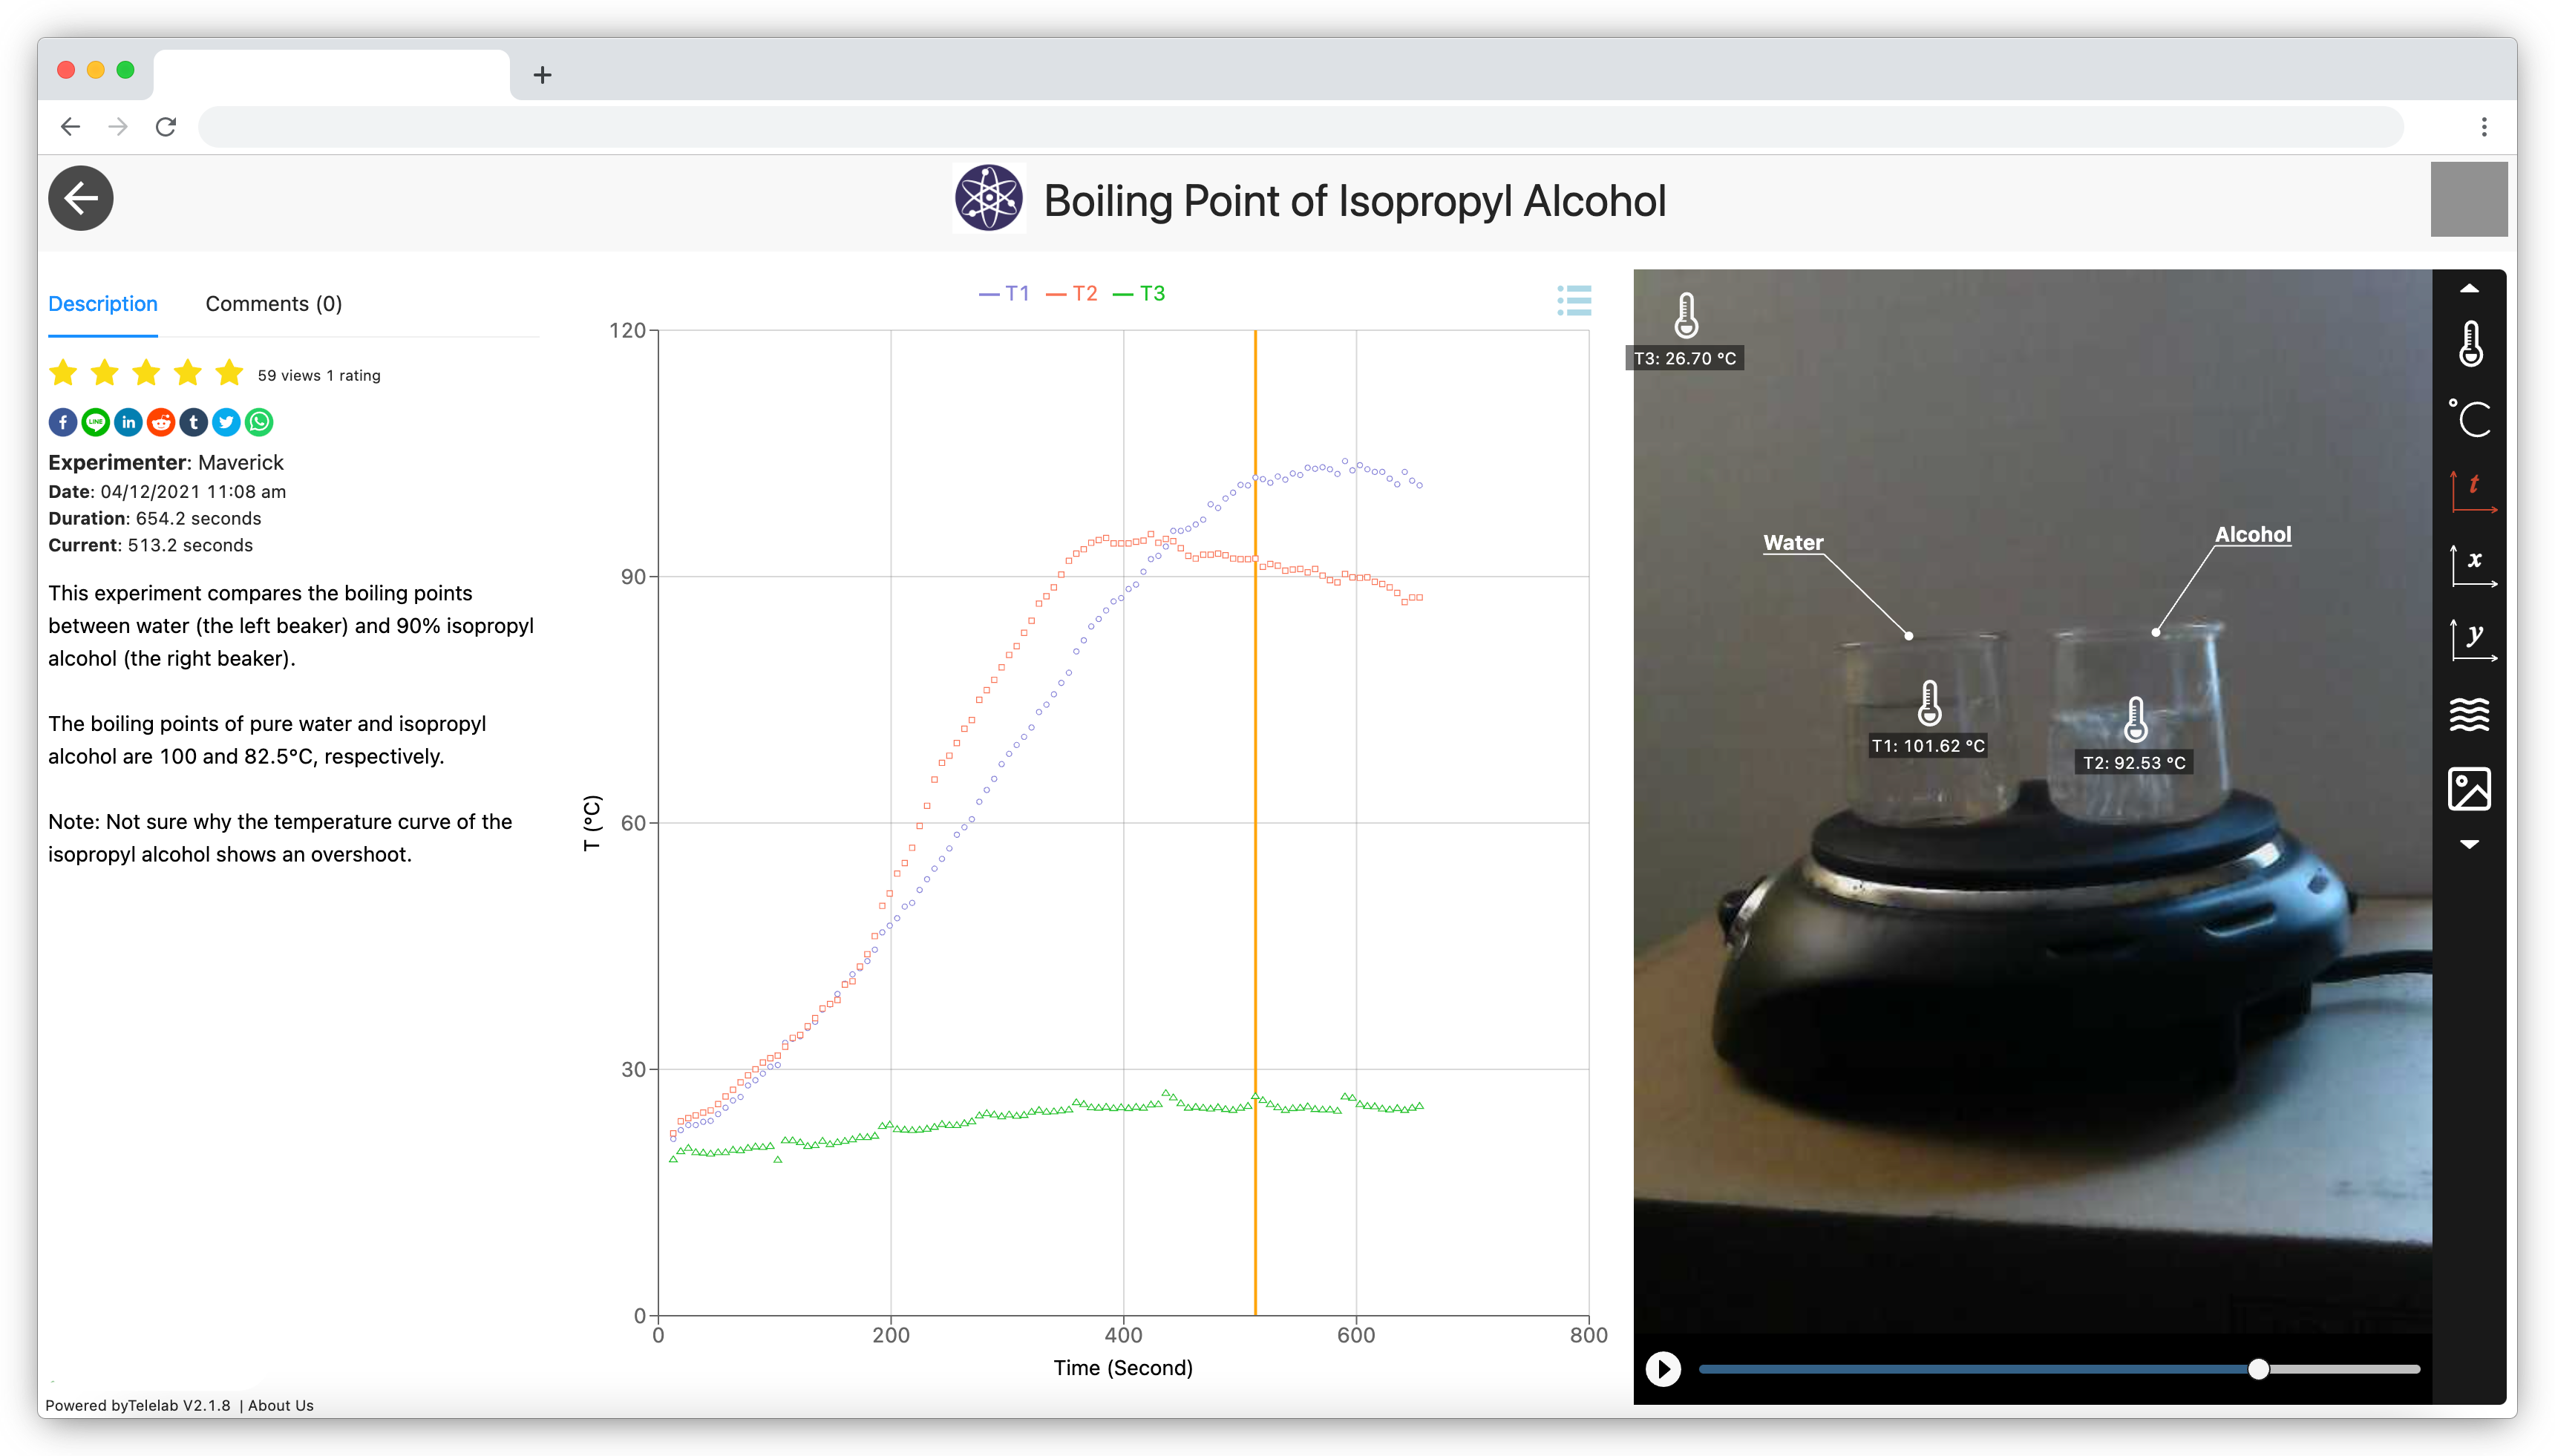
The shared experimental data allow viewers to not only imitate the kitchen experiments described in the vlogs, but also ask new questions to explore. For example, viewers may wonder what will happen to the boiling point if they add even more salt to the water, if they use a different condiment like sugar as the solute, or if they use a different liquid. In this case, viewers can become creators by remixing the experiment design and publishing their own experiments to Telelab (e.g., Figure 4). Their remixed science vlogs will in turn allow additional viewers to perform their own analyses. As more viewers publish their remixes, they explore a much bigger problem space than they would likely do in isolation.
Example 3: Building Science
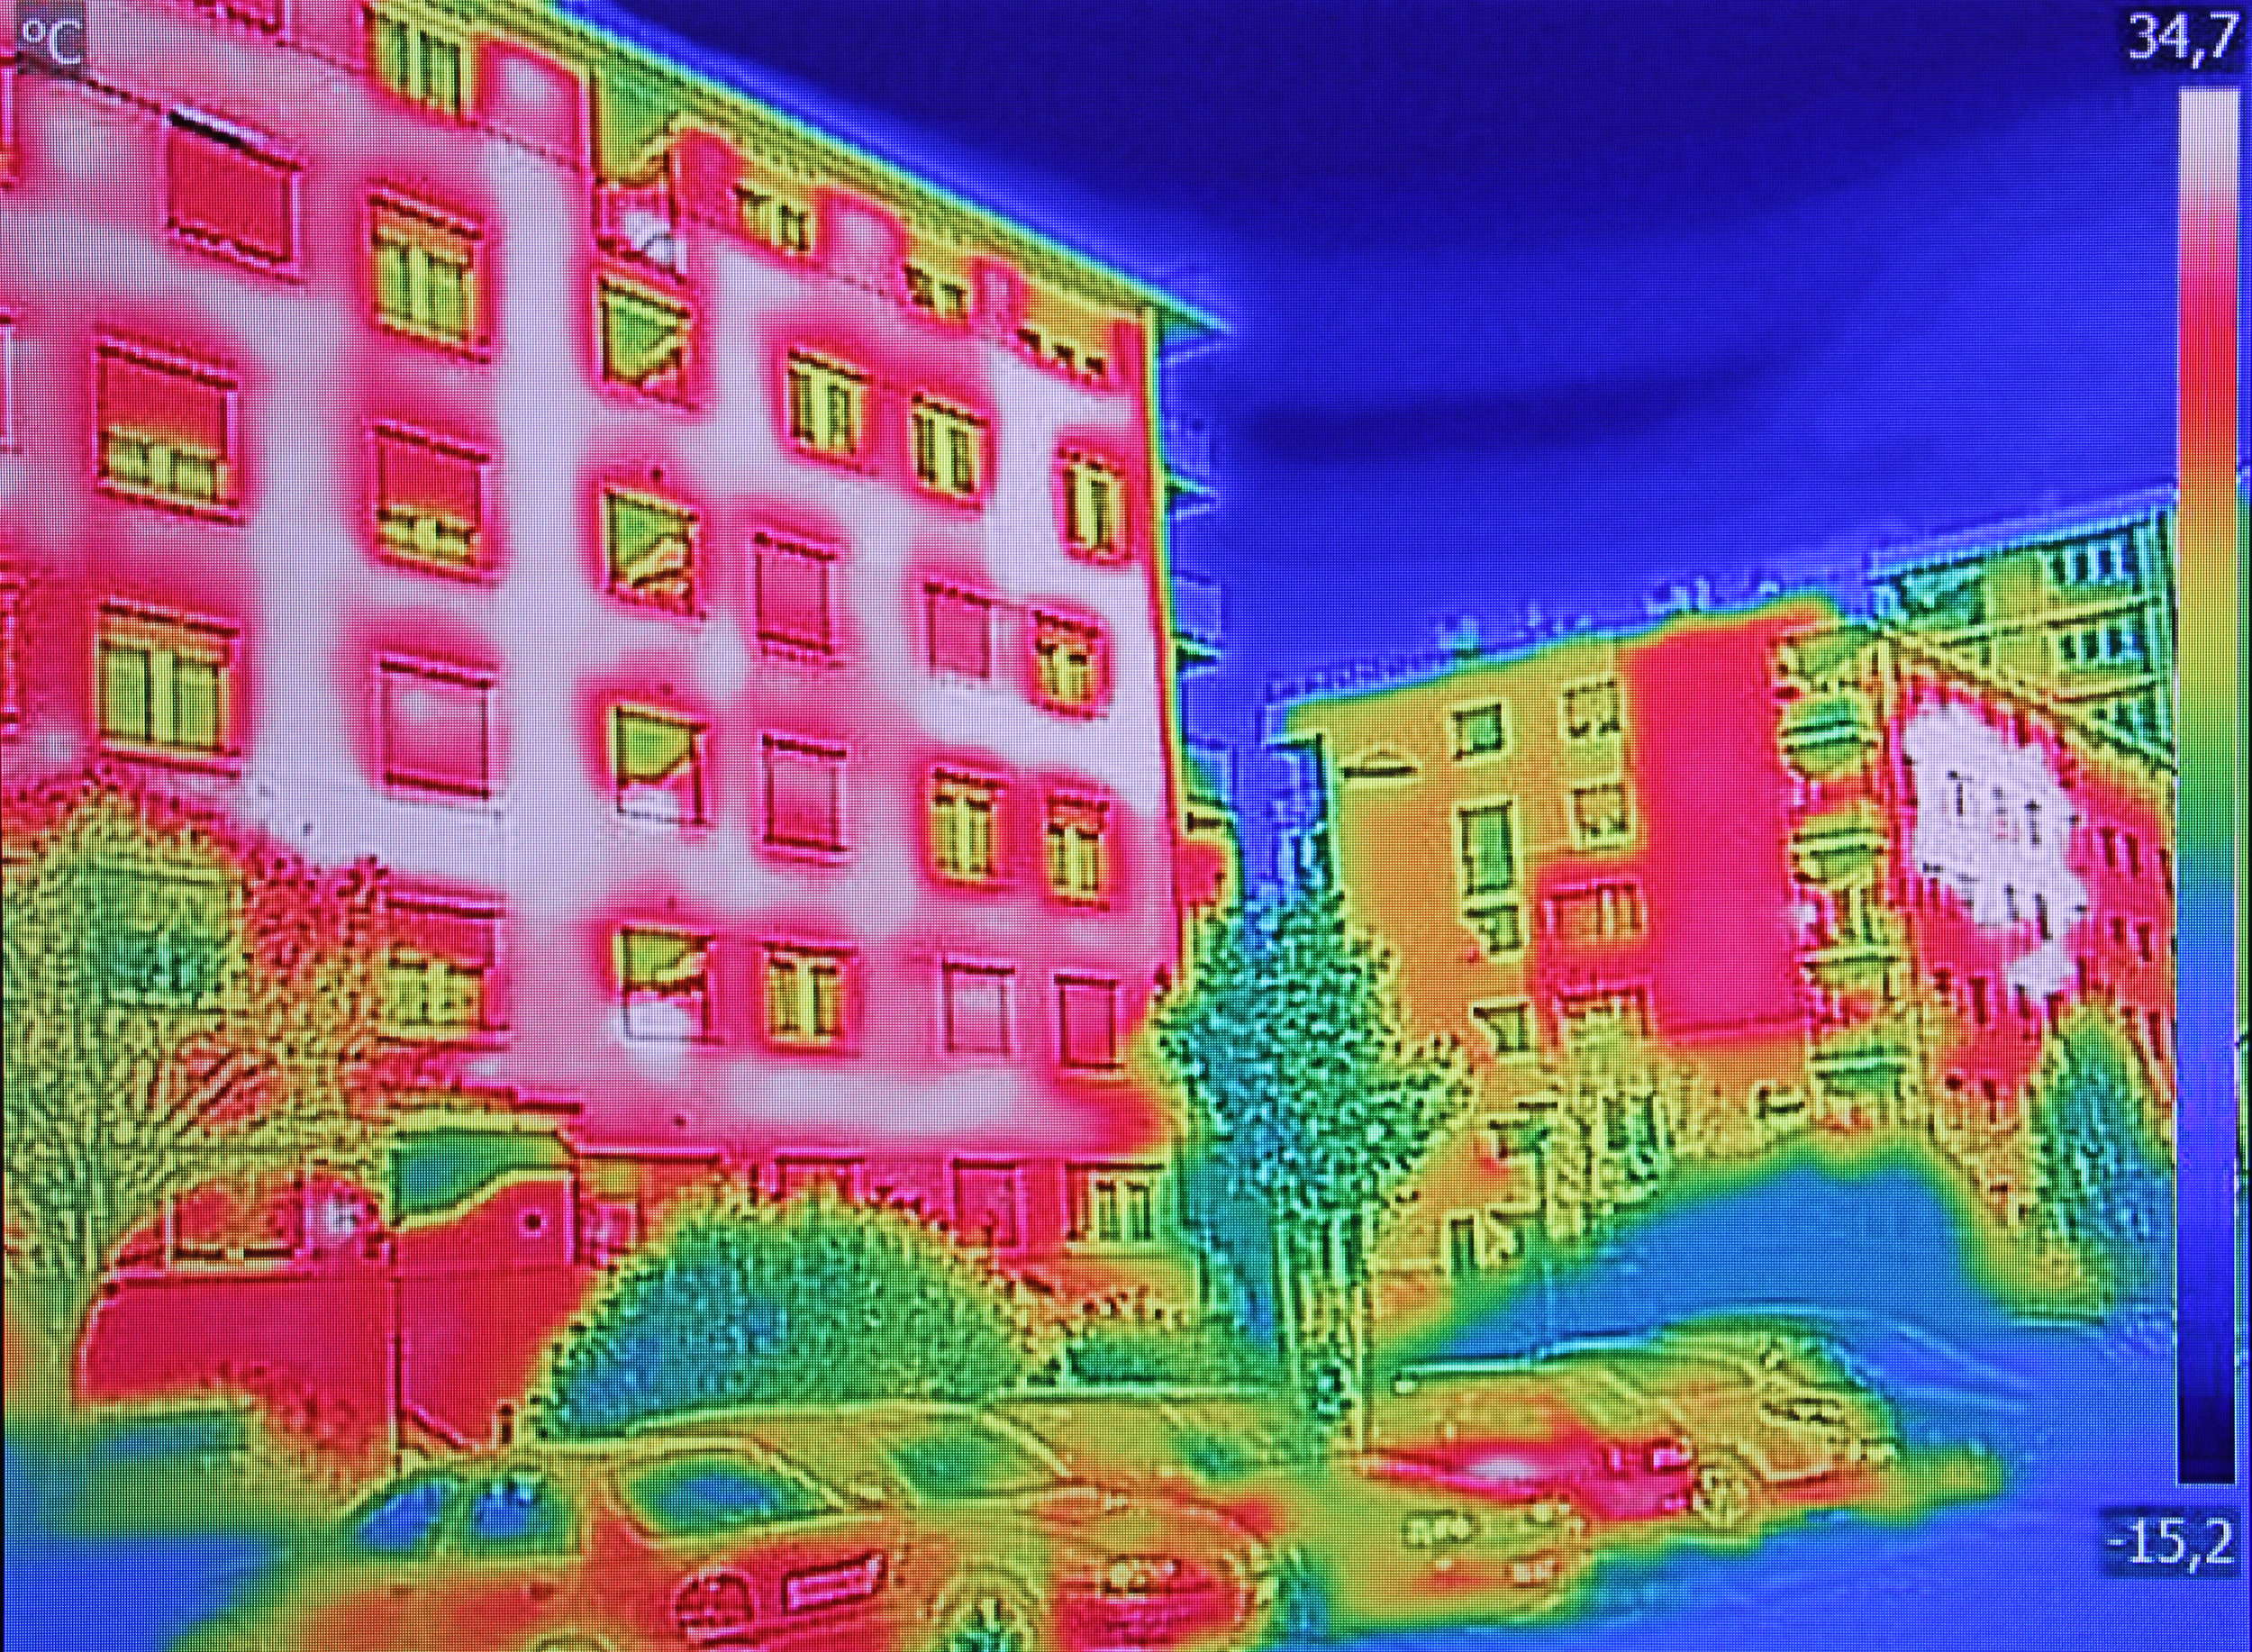
Buildings consume large amounts of energy to provide heating and cooling, but if a building consumes more than is necessary to maintain a comfortable temperature, then it isn’t energy efficient. Energy waste can cause an array of issues from exorbitant electricity bills to urban heat islands, but people are often unaware of its cause—undesirable heat transfer. After students have learned about heat transfer in school, a science vlogging platform like Telelab allows them to apply their knowledge in personally relevant out-of-school contexts by giving them the tools to inspect buildings and streets in their neighborhoods for instances of energy waste, and even possibly engaging in a citizen science effort to optimize building energy efficiency by eliminating energy waste.
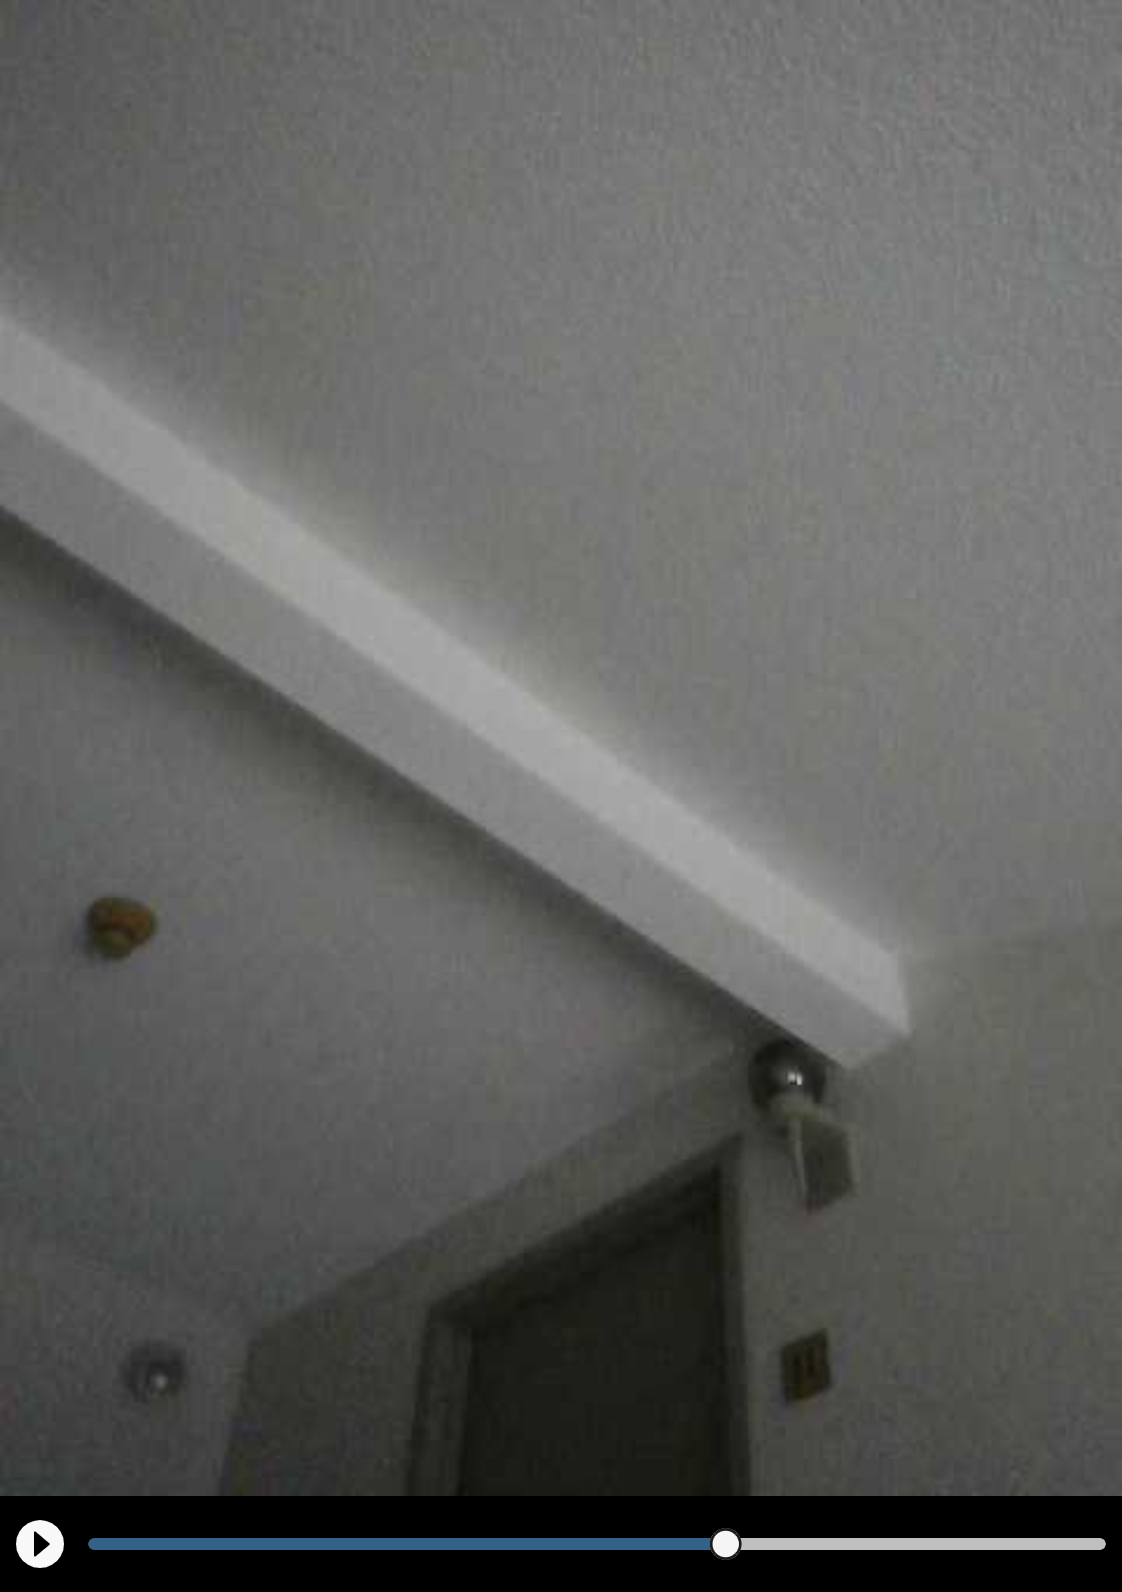
As an example, many wood-framed buildings experience a phenomenon called thermal bridging, where components with higher thermal conductivity create paths for easy heat transfer between the external environment and the inside of the building, thus resulting in energy waste. Students can use a thermal camera to create science vlogs in public buildings by inspecting common locations where thermal bridges are likely to occur, including floor-to-wall junctions and wood members in floors, walls, and ceilings. When they find any temperature differences that indicate thermal bridging, they can use Telelab to share their science vlogs with community stakeholders, who can verify the temperature data themselves and use the thermographic evidence as the basis for retrofitting and remodeling recommendations (Figure 5).
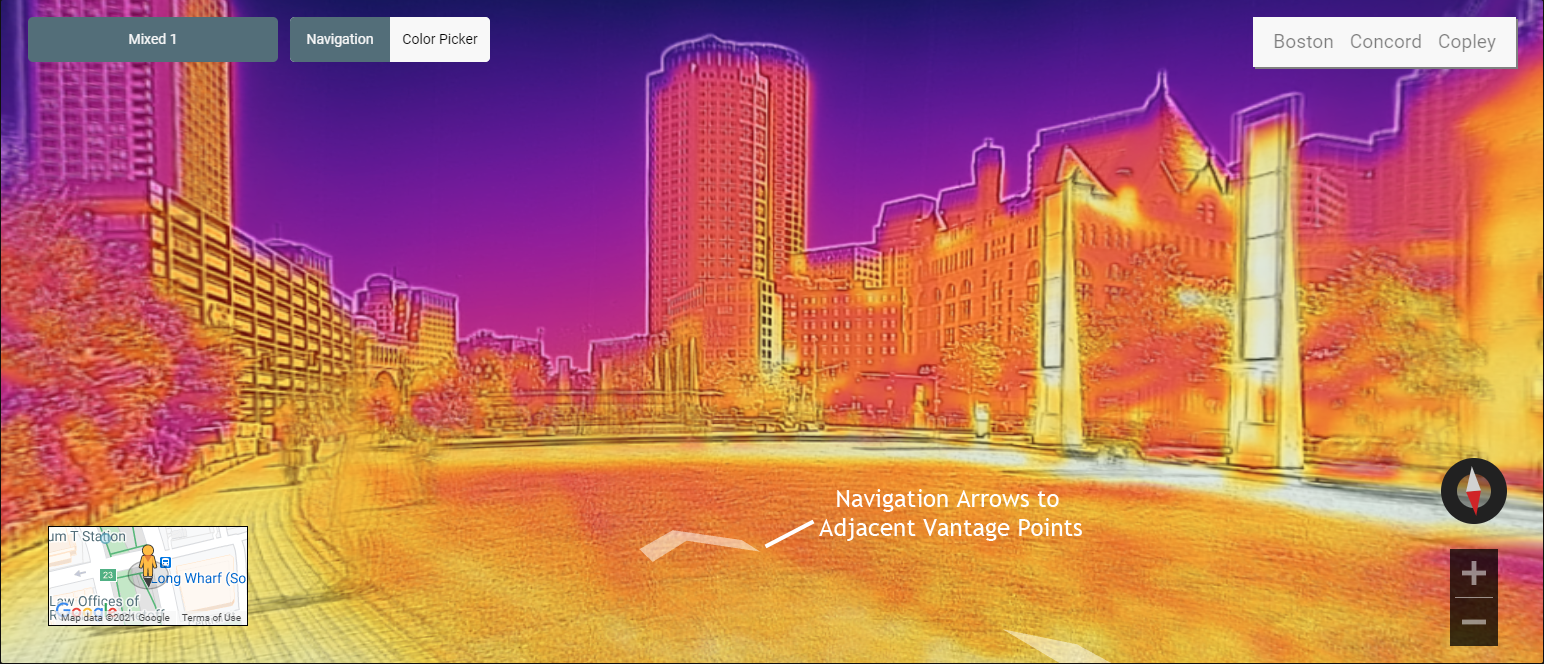
Students everywhere can use thermal cameras to visualize the thermal envelope of buildings and streets in their neighborhood and publish the thermal data as geo-tagged infrared panoramas. The Telelab infrastructure then overlays these panoramas onto Google Maps to create Infrared Street View, a thermal version of Google Street View that allows viewers to identify energy issues around them such as energy leaks and urban heat islands in their living environment. For example, when viewers navigate the energy landscape of their neighborhood or a nearby city (Figure 6a), they will notice that pavement (Figure 6b) and certain building facades (Figure 6c) have a higher surface temperature that contribute to the urban heat island effect, while trees and water features provide patches of cool areas within urban heat islands. These crowdsourced infrared panoramas provide scientific evidence of energy issues that may convince homeowners and building managers to improve the energy efficiency of their properties.
These building inspection activities extend in-school learning about heat transfer and situate the application of students’ knowledge in real-life scenarios that concern the students’ personal living conditions. In this case, the Telelab infrastructure integrates three technologies for connected science learning: (1) IoT-enabled scientific instruments such as thermal cameras for observing and documenting hidden processes in everyday life; (2) The integration of a geographic information system (GIS) such as Google Maps that provides a relevant context for students’ geographically distributed experiments; and (3) A social media platform for students to communicate their findings in a visual and interactive way that may generate social impact.
Teacher and Student Feedback
During the development of Telelab, several rounds of professional development workshops were conducted to solicit teacher feedback (Xie et al. 2022). Most teachers liked its ability to support learning everywhere. As one teacher put it, “with this technology, science learning will involve diverse voices from students, about their houses, gardens, and rivers in their community, to name a few. It’s more than extended access through online platforms.”
In a pilot study during summer 2020, 44 students investigated the concept of reaction rate through a series of kitchen science experiments using baking soda and vinegar and exchanged ideas about different experiment designs (Xie et al. 2022). Analysis of student lab reports showed improved evidence-based reasoning skills. 22 out of 31 students who submitted an exit survey enjoyed using Telelab to visualize hidden processes. One student shared, “I enjoyed seeing the video of what was happening in the reaction and being able to see the graphs of the reaction at the same time.”
Conclusion
The COVID-19 pandemic has shifted a significant part of science learning from physical facilities into virtual spaces by force majeure, but a social media platform like Telelab can become a bona fide informal science learning environment that transcends physical boundaries to enable remote scientific inquiry. As an IoT platform, it can also support observations and experiments beyond any physical confinement. When student-generated data are shared through a social media platform, it can be transformed into a peer-based learning community where students recreate and remix the shared content through self-teaching and discussing with other students (Zeng et al. 2021). While the future is still uncertain, the addition of a social media platform for data-rich science vlogging can be an important step toward more resilient, equitable, and accessible science education.
Web Link
Telelab and its curriculum materials are freely available at http://intofuture.org/telelab.html.
Acknowledgments
The authors would like to thank Dr. Dylan Bulseco and Joy Massicotte for their valuable feedback. This work was supported by the National Science Foundation (NSF) under Grants 2054079 and 2131097. Any opinions, findings, and conclusions or recommendations expressed in this paper, however, are those of the authors and do not necessarily reflect the views of NSF.
Rundong Jiang (rundong@intofuture.org) is the Director of Curriculum and Instruction, Xiaotong Ding is a Software Engineer, Shannon Sung is a Learning Scientist and the Director of Assessment and Evaluation, Ashley Bulseco is an Environmental Scientist, and Charles Xie is the Chief Scientist, all at the Institute for Future Intelligence in Natick, Massachusetts.
citation: Jiang, R., X. Ding, S. Sung, A. Bulseco, and C. Xie. 2022. Data-driven science vlogging for connected learning anywhere. Connected Science Learning 4 (2). https://www.nsta.org/connected-science-learning/connected-science-learning-march-april-2022/data-driven-science-vlogging
Citizen Science Inquiry Phenomena Physical Science Technology Informal Education