
Research & Teaching
Fostering Reflective Teaching
Using the Student Participation Observation Tool (SPOT) to Promote Active Instructional Approaches in STEM
Journal of College Science Teaching—March/April 2022 (Volume 51, Issue 4)
By Cara H. Theisen, Cassandra A. Paul, and Katrina Roseler
The Student Participation Observation Tool (SPOT) is a web-based classroom observation protocol developed for higher education STEM courses and based on research on evidence-based practices. The low-inference and objective nature of the SPOT and visual outputs make it an optimal tool for teaching professional development. The SPOT allows novice users to use data from their own classes to reflect on, and make data-driven changes to, their teaching practices. In particular, the SPOT was designed to present faculty with objective data related to their use of active instructional approaches, be easy for practitioners to use, and provide data outputs that are illustrative and non-evaluative. Use of the SPOT in a workshop series revealed that these design features allow faculty to collect reliable observation data with minimal training. Furthermore, SPOT data promoted faculty reflection on teaching practice and motivated faculty to make changes to their teaching that aligned with more learner-centered practices. Beyond teaching professional development, we suggest how the SPOT may be used to increase the usefulness of peer observation for teaching evaluation.
Science education researchers have consistently shown that active learning approaches are superior to traditional lecture because they are correlated with positive student learning outcomes (Freeman et al., 2014; Connell et al., 2016). Despite this evidence and recommendations for teaching with active learning approaches (e.g., American Association for the Advancement of Science, 2011; National Academies of Science, Engineering, and Medicine, 2016), these practices are not widely implemented in higher education science, technology, engineering, and mathematics (STEM) courses. While recent studies have found that many instructors use some active learning techniques, lecture-based teaching persists as the most prevalent instructional approach (e.g., Henderson et al., 2011; Henderson et al., 2012; Patrick et al., 2016; Smith et al., 2014; Stains et al., 2018) and more faculty are aware of the benefits of active instructional approaches than those who implement them (Henderson et al., 2012; Miller & Metz, 2014).
Increasing the use of active instructional practices requires addressing the underlying barriers that prevent their adoption. Even when faculty are aware that active learning results in greater student learning, changing instructional approaches is challenging due to barriers such as comfort with teacher-centered instruction, insufficient training, little incentive, and limited time (e.g., Henderson et al., 2011; Brownell & Tanner, 2012). Two additional barriers may be addressed through faculty development approaches. First, if faculty perceive their classes to be more engaging than they actually are, they will not be motivated to make additional changes. Findings from previous research reveal that STEM faculty do not use active learning as often as they perceive they do when compared to classroom observation data (Ebert-May et al., 2011) and student perception (Patrick et al., 2016). Second, faculty may be resistant to changing their teaching practice because they do not consider pedagogical reform to be an important part of their job or to align with their unique teaching context or personal values. Brownell and Tanner (2012) proposed that to transform STEM teaching, scientists need to broaden their professional identities to value developing their teaching. Thus, to be motivated to make changes, STEM faculty may benefit from professional development that provides opportunities to align their current teaching practices with evidence-based approaches in the context of their own professional identity and values.
Classroom observation is one approach to faculty development that can motivate faculty to improve their teaching by providing detailed feedback about their practice (e.g., Fletcher, 2017; Hammersley-Fletcher & Orsmond, 2005; Martin & Double, 1998). However, traditional peer observation practices can limit the usefulness of this approach and prevent faculty from valuing the information they receive (Henderson et al., 2014). Some challenges include observer bias toward similar teaching styles, lack of observer expertise in providing instructional feedback, association with summative evaluation of teaching, and a focus on content accuracy rather than use of instructional practices (Gormally et al., 2014). Peer observation may be more useful if it provides instructors with objective feedback about their use of evidence-based practices and affords them the opportunity to articulate changes that align with what they value and are appropriate for their teaching context. While a number of classroom observation protocols exist (e.g., West et al., 2013; Frey et al., 2016; Paul & West, 2018; Sawada et al., 2002; Smith et al., 2013), none were developed to be used directly by STEM faculty to promote reflection and teaching improvement in a wide variety of STEM teaching contexts. (For a detailed comparison of classroom protocols, including the one presented here, we direct the reader to Madsen et al., 2019.)
In this article, we present an observation protocol designed to be used by STEM faculty for the purpose of reflection on their use of active teaching approaches in order to make evidence-based decisions about their practice. The Student Participation Observation Tool (SPOT) is a web-based observation protocol that allows an observer to objectively capture and categorize classroom activities in real time. Originally based on its predecessor, the Real-time Instructor Observing Tool (RIOT; West et al., 2013; Paul & West, 2018), the SPOT creates visual outputs from classroom observation data that are aligned with evidence-based STEM practices. Using these visual outputs, faculty are able to analyze the data and articulate desired changes to their teaching. Thus, using the SPOT for classroom observation, accompanied by faculty reflection on classroom activities, can serve as a catalyst for instructors to adopt more active teaching approaches that align with their personal teaching values. Here, we present the design goals that guided the SPOT development, describe an example of how the SPOT has been used to promote faculty reflection on teaching and motivation to change, and introduce the SPOT for use in multiple professional development contexts.
The Student Participation Observation Tool (SPOT)
The SPOT was developed based on a need for an observation protocol that (1) presents faculty with objective data related to evidence-based practices from their own classroom, (2) is easy for practitioners to use, and (3) provides illustrative and non-evaluative data. These three characteristics make the SPOT an ideal observation protocol for promoting faculty reflection on teaching.
The SPOT allows an observer using a laptop or tablet to collect classroom data in real time, resulting in time-stamped information about the progression of classroom activities. Building from the design of its sister tool (West et al., 2013; Paul & West, 2018), the SPOT provides information on the types of activities in which students and instructors engage, the duration and diversity of activities, and the distribution of student participation in the classroom. STEM instructors can use data collected by the SPOT to reflect on and make decisions about classroom practices. To achieve these capabilities and ensure validity of the tool, the SPOT was iteratively refined based on feedback from the project advisory board, observations made by expert observers (SPOT development team), and observations made by novice observers (faculty and graduate students). This section provides an overview of the key characteristics of the SPOT that make it optimal for teaching professional development. (Additional information about and resources for using the SPOT are provided at the SPOT website: https://sites.google.com/wisc.edu/spot-protocol.)
The SPOT is grounded in evidence-based, active learning techniques.
The SPOT was designed to document observable classroom actions that are correlated with enhanced student outcomes from STEM education research; thus, it provides instructors with feedback about their use of evidence-based, active teaching practices. The SPOT developers conducted a review of STEM education research to identify evidence-based teaching practices and identified 17 effective STEM teaching practices (Roseler et al., 2018). From these practices, we selected the features that were observable based on the implementation described. We categorized these features into student and instructor actions occurring within three modes of engagement: whole class, individual, and small group (Roseler et al., 2018). These features were programmed into the SPOT interface as actions an observer can select, with nuanced actions added to capture common instructor and student interactions (e.g., the observable action “student speaking” was programmed into buttons such as “student answering question” and “shout out”; see Figure 1). The research-based observable features were vetted by the research team and an advisory board, thus establishing face validity (Drost, 2011) for the SPOT.
The SPOT is intuitive and low-inference.
Designing a tool for use in real-time necessitates minimal real-time analysis by the observer. When we say an action is observable, we mean that it should be immediately recognizable and not require interpretation. The limited number of class modes and actions also makes the actions quickly distinguishable. In this way, the SPOT was designed to be intuitive and low inference for the observer, minimizing subjective interpretation. During an observation, an observer selects buttons on the interface that represent the actions they see (Figure 1). This allows observers to gather data using SPOT without prerequisite knowledge of evidence-based teaching practices.
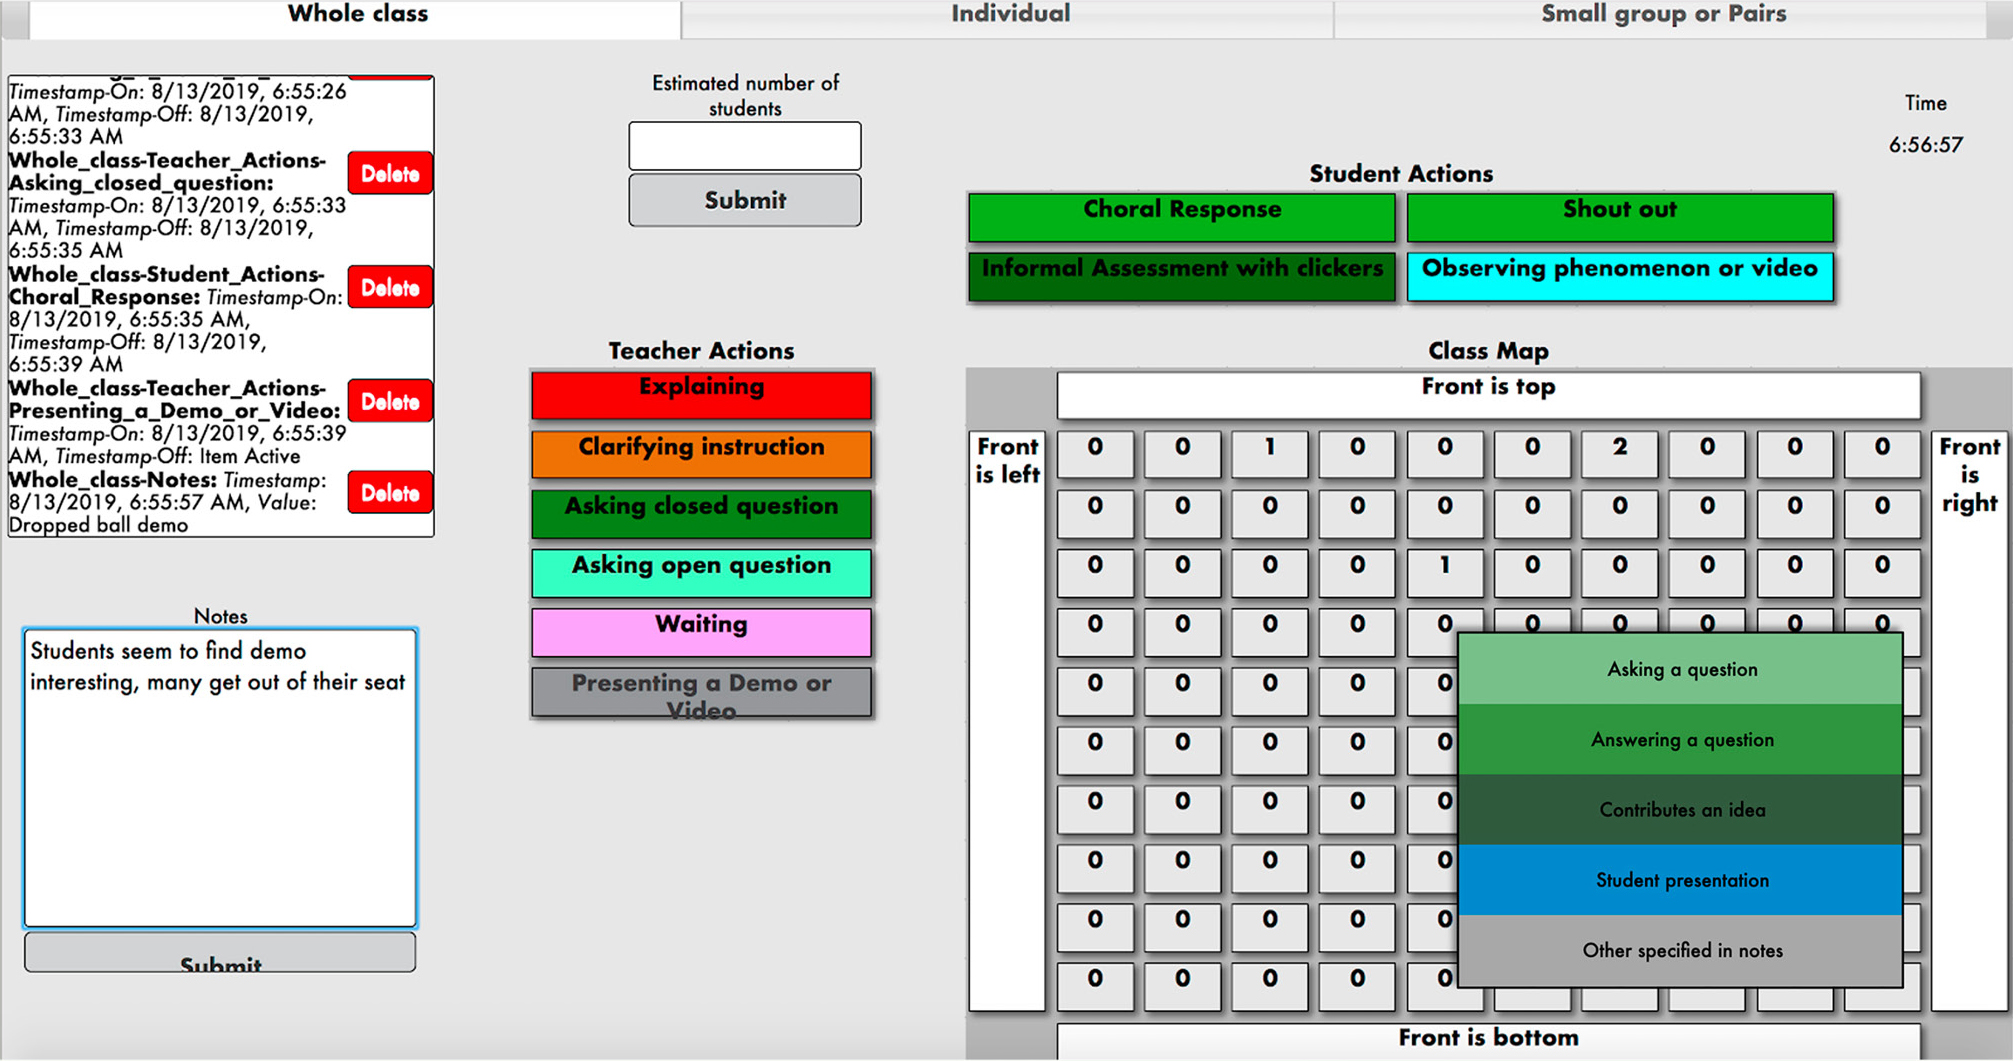
Screenshot of the SPOT observation interface.
Note. This screenshot of the SPOT observation interface shows what a SPOT user sees when making a classroom observation. The top three tabs represent the different class modes (i.e., Whole class, Individual, Small group or Pairs), which can be switched at any time during an observation. This view shows the “whole class” mode, which includes buttons for both instructor actions and student actions. The grid at the bottom right represents students in the classroom. When an observer clicks on a box in the grid (which roughly represents where a given student is sitting), a drop-down menu appears with different student actions. The values shown on each student box represent the total number of times a student has performed actions during the observation. On the lower-left side, observers can enter time-stamped notes. In the upper-left corner, a log box displays the last few recorded actions. In “individual” mode, the available student actions are writing, reading, problem solving, informal assessment with clickers, observing phenomenon or video, or other specified in notes, with actions attributed to all students collectively; available teacher actions are the same as in “whole class” model. In “small group or pairs” mode, the only available action is “students are working in small groups or pairs.”
Following an observation, the SPOT instantly and automatically creates visual data outputs that can be used for analysis and reflection. The outputs provide instructors with information about the timing and types of actions that took place, as well as the diversity and distribution of participation in their classroom (Figures 2 through 4). Because all actions included are observable and data are recorded in continuous time, the SPOT is designed to allow instructors to easily connect their experience teaching with the data provided. Users can also download a .csv file to conduct their own analysis.
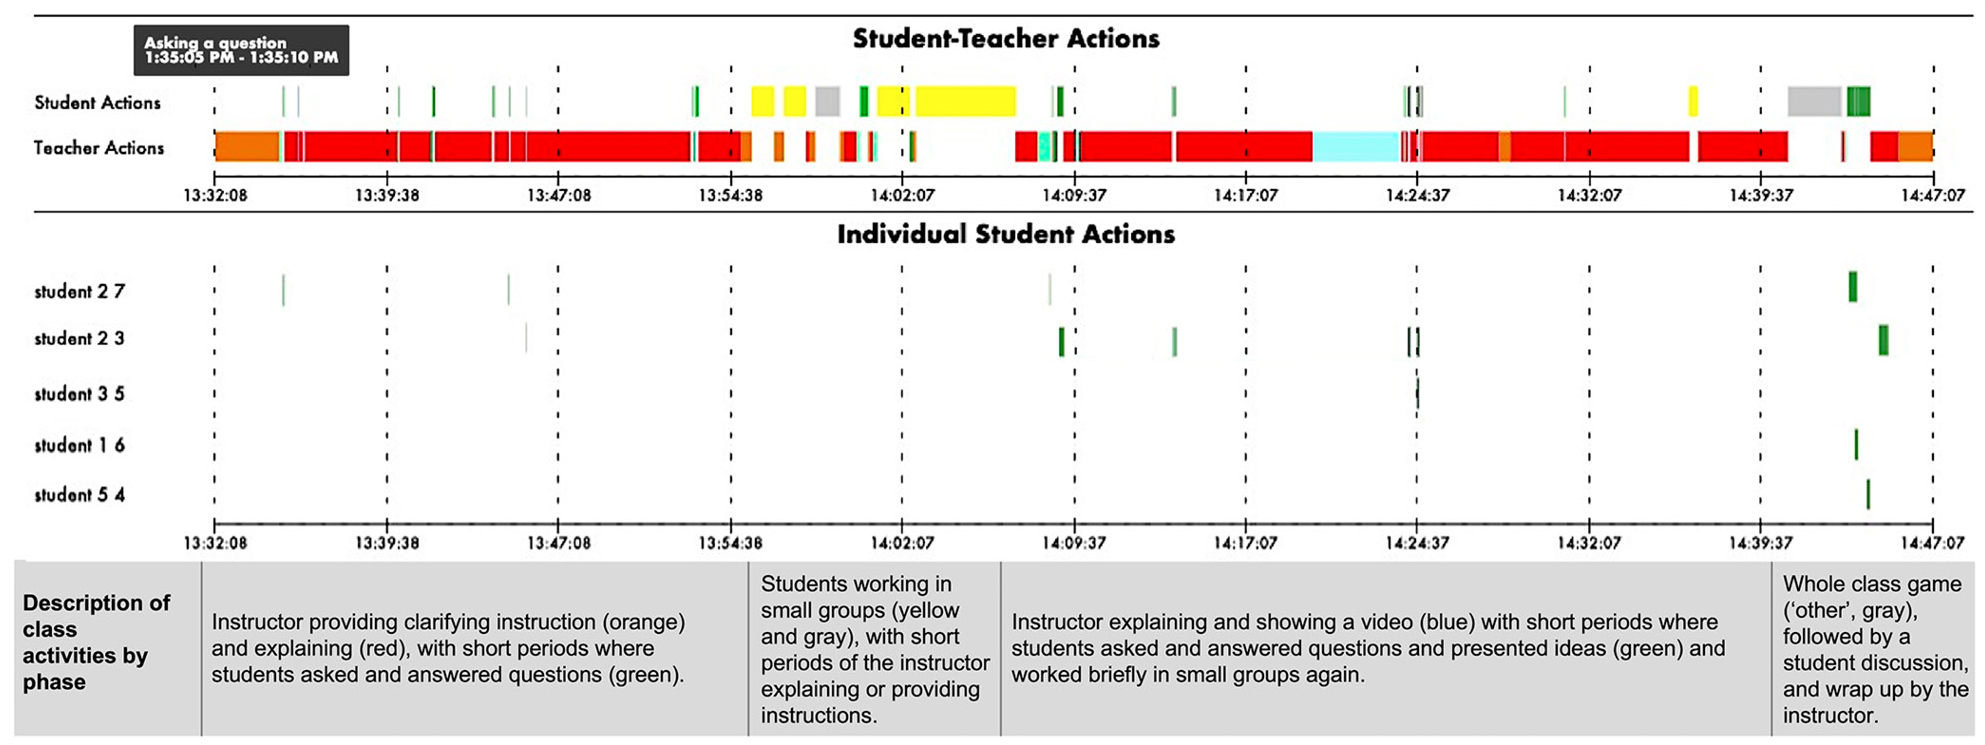
Example SPOT timeline with description of class activities.
Note. This timeline was automatically generated by the SPOT immediately following an observation in a first-year biology course. The timeline includes a summary of all student and instructor actions, as well as individual student actions, with different-color bars representing the duration of different actions. By hovering over a bar in the web interface, the user will see an annotation that indicates the action name and duration. In this example, hovering over the first green bar indicates that a student was “asking a question” for 5 seconds; hovering over the red bars indicates that the instructor was “explaining” concepts. The plot is intentionally color-coded so instructors can see at a glance how class time is being spent. This information is intended to assist them in reflecting on the sequence and duration of activities, opportunities for student engagement, and patterns in student participation.
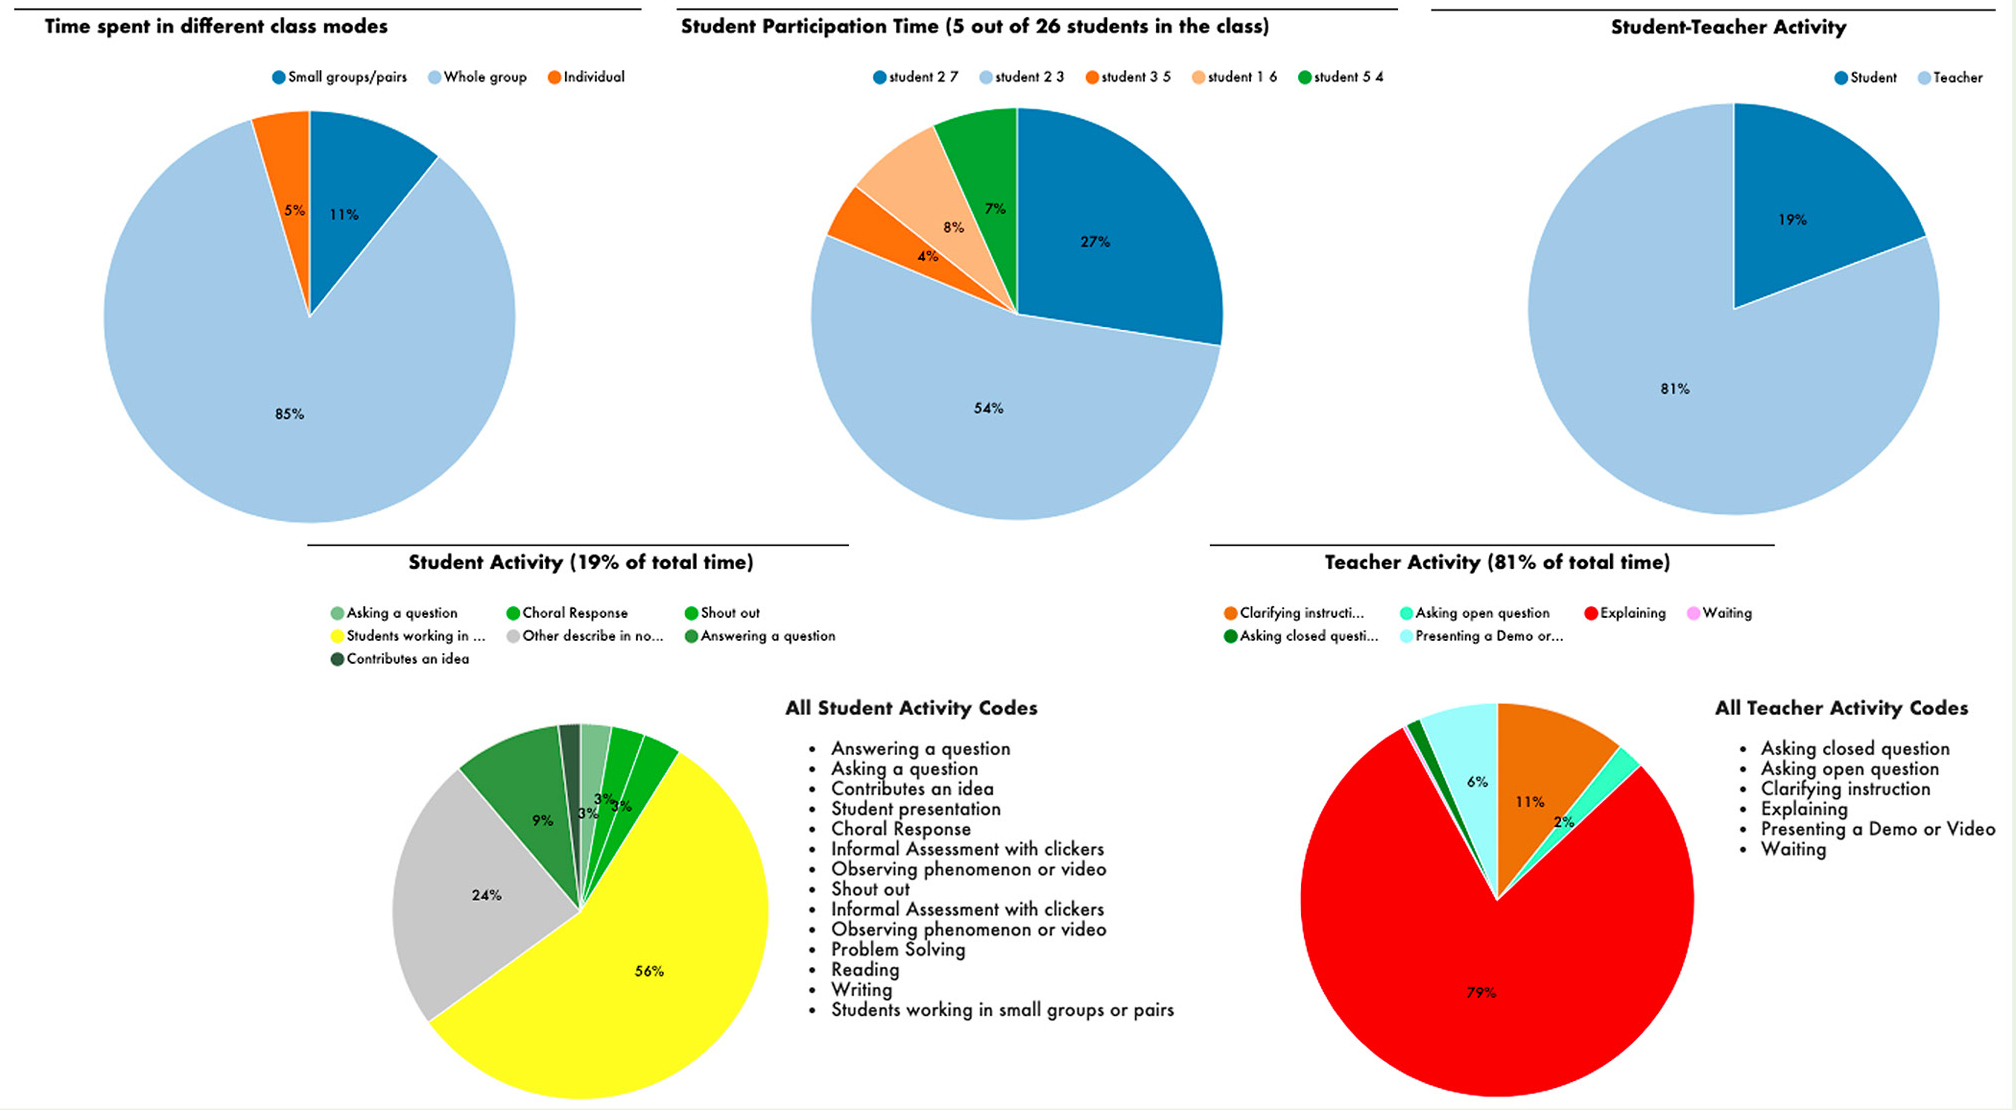
Example SPOT pie charts with data from an observation in a first-year biology course.
Note. These pie charts illustrate data from an observation in a first-year biology course (same observation as Figure 2), including the percentage of time spent in different class modes, the percentage of time that individual students participated during “whole class” mode, the relative time of instructor and student actions, and the specific actions observed. These auto-generated SPOT pie charts are intended to prompt instructors to reflect on opportunities that students have to engage in different ways, the overall time that is dominated by instructor versus student activities, and the activities used compared to the other activities that are part of evidence-based STEM practices.
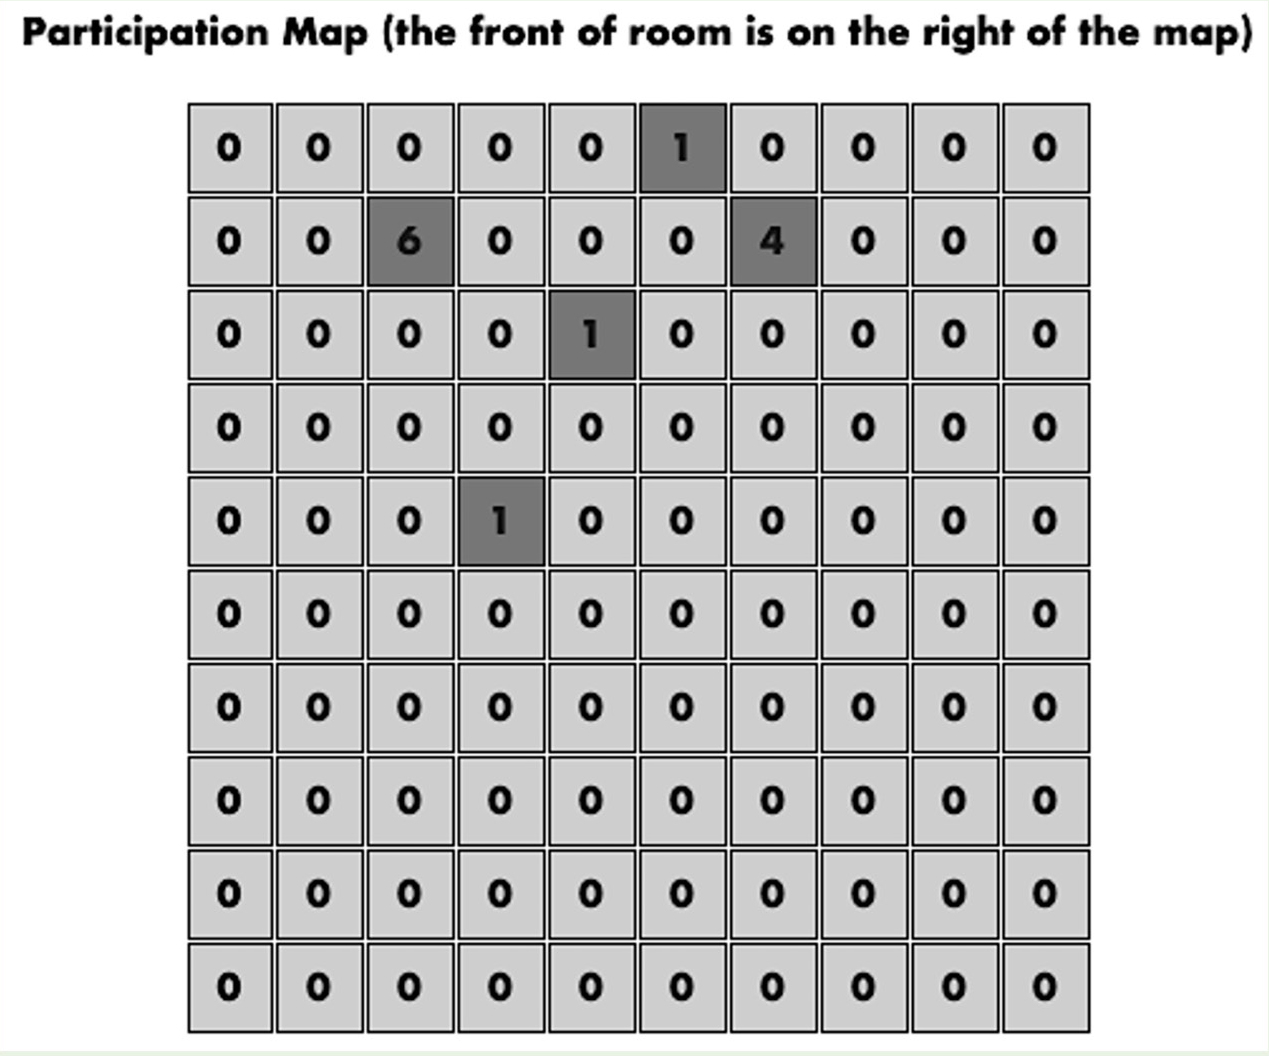
Example SPOT student participation map.
Note. This SPOT student participation map shows the number of times each student participated in the discussion; each box with a number other than zero represents a participating student. When students participated more than once, the number indicated on the box represents the number of contributions made by that student. Note that this map does not necessarily show all students; it is meant to represent those who participated and their approximate location within the classroom. During an observation, the observer is able to map the layout of the classroom onto the map how it makes sense to them and will not necessarily use each box. Depending on the class size, the observer might also decide to designate individual boxes as classroom zones or tables, rather than individual students, thus reducing the granularity of data but still collecting data that are more detailed than what most students are doing at a given time. The participation map is intended to promote instructor awareness of the spatial distribution of students participating and if they are preferentially engaging with any part of the classroom.
The SPOT provides illustrative and non-evaluative data to promote reflection on teaching practice.
In addition to focusing on evidence-based practices, we also considered what types of data faculty would find compelling. One common request from faculty is that they wish students would participate more. Therefore, the visual outputs intentionally separate instructor and student actions so instructors can see patterns in the distribution and duration of student participation, as well as opportunities they are providing for participation (Figures 2 through 4). The SPOT also presents the time spent in each learning context, as well as the time allocated between different instructor and student actions (Figure 3). Furthermore, a participation map provides users with the distribution of participation throughout the room, the number of students contributing, and how many times each student contributes (Figure 4). Data collected at the individual student level allow instructors to determine whether the same students are participating repeatedly or if participation is more diverse. While other protocols also provide visual outputs, this representation of the diversity of classroom participation is novel to the SPOT (Madsen et al., 2019). These outputs are designed to provide information that instructors can use to become more aware of their teaching practices and reflect on how to promote participation and engagement among students.
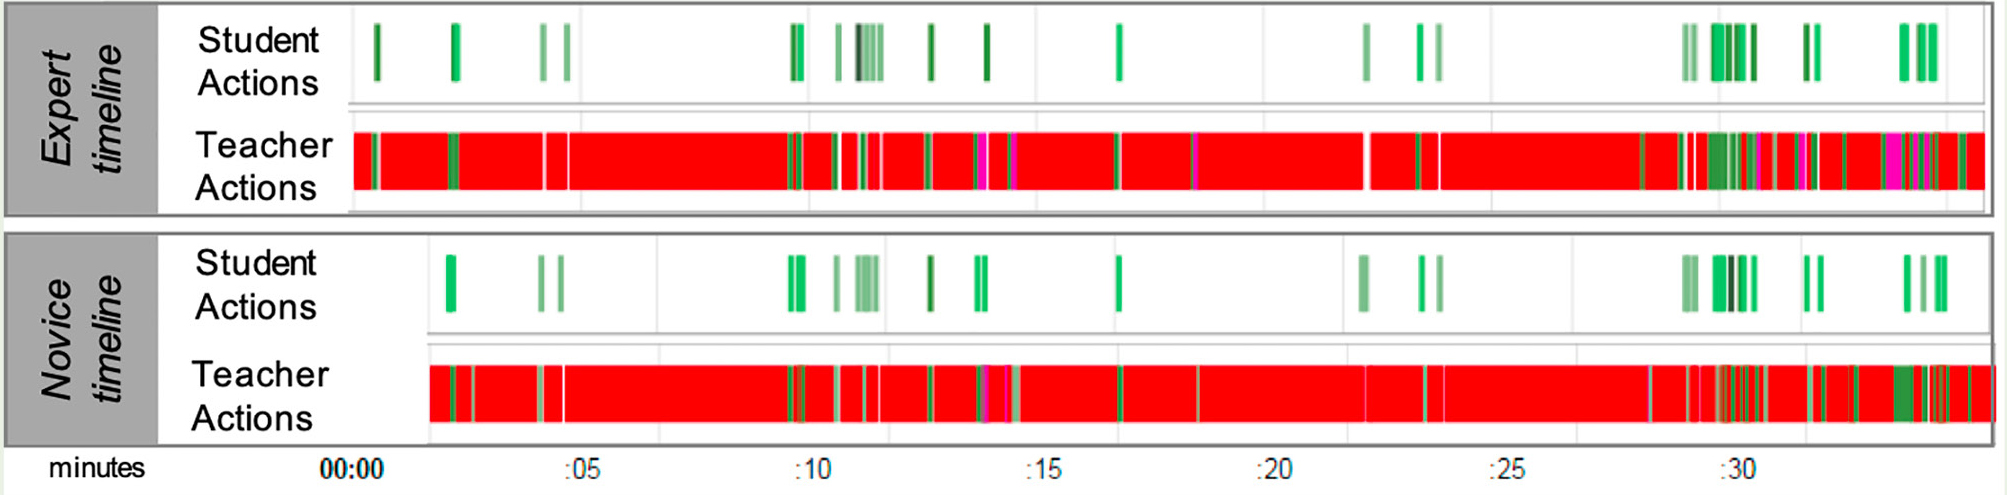
SPOT timelines of class activities.
Note. These SPOT timelines of class activities use data collected by an expert user (SPOT developer) and novice user (STEM faculty member) in the same live classroom session. The timelines show close agreement in actions and durations between both users (in this example, the expert starts taking data ahead of the novice, so there is no data at the first part of the novice timeline). Overall, these data reveal a consistent pattern of a lecture-based class, with short exchanges where the instructor broke up the lecture by having students ask questions and then answering those questions.
A final design consideration for the SPOT was that the data should be objective and non-evaluative. Because observers only indicate what they see and do not judge the quality of the action, the data are primarily objective. The SPOT intentionally does not indicate an ideal distribution of activities or what percentage of class time should be devoted to active strategies. Prior research does not support an ideal way to incorporate active learning approaches; varied practices have demonstrated positive effects on student outcomes. Furthermore, because it is our intent for faculty to use SPOT data to make positive changes in their classroom, the plots do not imply judgment.
Use of the SPOT in a faculty workshop series
Workshop approach
We conducted a workshop series with five university STEM faculty (biology, chemistry, and physics/astronomy faculty) with the SPOT as the focus. The SPOT workshop series was developed to teach STEM faculty how to use the SPOT as well as pilot the tool for teaching professional development. The workshops were delivered over three 90-minute, face-to-face sessions facilitated by the authors. Participants learned to use the SPOT, observed another participant’s teaching on two occasions, and discussed SPOT data collected from their classroom. The SPOT workshop series approach combines two change strategies. The change strategy “developing reflective teachers” (Henderson et al., 2010; Henderson et al., 2011) promotes emergent reflection by individual faculty members in a learning community. This strategy positions faculty members as experts and gives them the agency to choose what practices will work best for students in their classrooms. The SPOT workshop series also incorporates the “unfreezing-cognitive restructuring-refreezing” model of change (Paulsen & Feldman, 1995; Connolly & Millar, 2006). Faculty members draw on SPOT data to examine assumptions about their behavior (“unfreezing”), after which they are able to explore alternative behaviors that may better serve their ideals (“cognitive restructuring”), and finally refine their behaviors (“refreezing”; Connolly & Millar, 2006).
The first workshop included a brief overview of the tool, which comprised a discussion of the layout, modes, and buttons on the observation interface. After this overview, participants immediately practiced using the SPOT by observing a video of an individual teaching science. Participants then debriefed about their experience and discussed the output plots created by the tool. Only 30 minutes of the first workshop were allocated for training on the SPOT. After the first workshop, participants worked in pairs to use the SPOT to observe each other’s class sessions, resulting in a SPOT data output for each participant. Members of the research team observed the same class sessions to determine reliability. The second and third workshops focused on discussing SPOT data in groups. In the final workshop, participants drew their ideal SPOT data output.
Qualitative analysis—including a priori and emergent coding (Creswell & Poth, 2016) and triangulation of data (Carter et al., 2014; i.e., workshop transcripts, survey responses, classroom observation data outputs, ideal data drawings created by the participants)—was used to evaluate if and how the SPOT design goals were achieved, as well as determine the reliability and validity of the tool.
Workshop outcomes
Outcome 1: Faculty found the SPOT to be intuitive and easy to use.
Faculty participants were able to use the SPOT to collect observation data after 30 minutes of training, indicating that it is intuitive to use by non-experts. While participants easily identified the observed actions, several participants indicated that it was challenging to “keep up” with data collection in real time and that there was a lag in observing the activity and selecting the appropriate button. However, during the workshop discussion, participants described that neither the lag in data collection nor missing a couple of actions mattered in their interpretation of the data because the observed pattern of activity was still largely the same. One participant stated, “I don’t think the delays really matter, and I think that even if you hit the wrong button that you correct right afterwards, [it] would mostly be coded correctly, so I don’t think in the end with me interpreting the data that would make much of a difference.”
The intuitive nature of the SPOT was also revealed when workshop participants reviewed the data outputs created from their classroom observations. All participants easily identified activities from their timeline and connected those to their teaching experience, supporting the content validity of the tool (Drost, 2011). For example, a participant stated, “I suspect what I did here is I said, ‘ok,’ you know, ‘who can show me that,’ you know, ‘work in your groups to show me that,’ you know, and I waited 2 minutes until people started chiming in.” In this example, the participant was using examples from their teaching practice to interpret the patterns in their SPOT data—specifically, the sequence of the teacher asking a question, the student problem-solving, and the teacher waiting.
Outcome 2: Faculty were able to reliably collect classroom data using the SPOT.
After only the initial training, faculty were able to produce data outputs that closely resembled data outputs of expert observers in actions and patterns of interaction when the same class was observed (Figure 5). To quantify the reliability of the SPOT, we calculated the percentage of time that the faculty member and expert observer were in agreement with how long they spent observing each action. We found that the expert-novice reliability ranged from 86% to 96%, with lecture-based teaching resulting in higher agreement than classrooms with increased student interactions. Thus, the reliability of the SPOT is strong between novice and expert users, despite challenges that participants reported with real-time data collection (as discussed with regard to Outcome 1). Participant discussions also revealed a focus on patterns of classroom interactions, rather than particular actions observed at a specific time. An exchange among two participants unfolded as follows: One participant said, “But in the end, does it really matter if I recorded five back and forths or six? Probably not, right? Just overall knowing that there was a very good interaction.” The other participant responded, “I would say the same things. I think the overall patterns are pretty clear, and the nitty-gritty, you know, hitting the wrong thing here and there, doesn’t seem to make too much of a difference.” Thus, while we have found a high percentage of agreement between raters, we found that traditional metrics of reliability are less important in the use of the SPOT for teaching professional development than they might be for someone using the SPOT for research.
Outcome 3: The SPOT supports reflection about teaching.
Workshop participants were prompted to discuss their SPOT data and what the data made them realize about their teaching. They articulated their thoughts relative to their pedagogy in various ways. One participant expressed that they were not aware of “the full range of interactions that can/do occur in a classroom setting.” Other participants indicated how the outputs were useful for showing evidence of classroom practice and how they increased their awareness of their own use of active instructional approaches. One participant described how SPOT data helped them recognize “when I had long stretches of lecturing without interaction with the students.” Another participant expressed their lack of awareness of time passing, stating, “I did not realize how little time I was actually giving them to work on a problem. When I intended to give a few, maybe 5 minutes, it was more like 1 minute.” This observation supports the usefulness of collecting data in continuous time, as opposed to recording whether or not an action occurred during a particular unit of time—a common observation protocol practice (Madsen et al., 2019).
The SPOT also facilitated collective reflection, where faculty referenced their own SPOT data to discuss and share practices with their colleagues, but in the context of their individual teaching. For example, when two participants were discussing their classrooms (a small discussion-based course and a large lecture course), they engaged in an unprompted discussion about different kinds of questions one can ask during instruction and the value of each. This discussion emerged in part from challenges they faced in differentiating between open and closed questions during the observation. However, when discussing their teaching in the context of SPOT data, this challenge led faculty to engage in a rich discussion about how different types of questions might be integrated into discussions.
Outcome 4: The SPOT facilitates change in practice.
After reflecting on their SPOT data outputs, participants were prompted to articulate changes they would like to make to their teaching practice. One participant suggested that they would be more intentional about soliciting participation from more students. Another participant stated, “The SPOT gave me a little better picture of how I need to work on spreading around participation more between my students.” These desired changes were articulated even though faculty observers noted that depending on the class size and the observer position in the classroom, collecting data on individual students can be challenging. These examples illustrate the reflective emergent outcomes of the “developing reflective teachers” strategy (Henderson et al., 2010; Henderson et al., 2011) and further exhibit the “unfreezing” and “cognitive restructuring” aspects of change (Connolly & Millar, 2006). We infer that obtaining data at the granular level of individual students—rather than generalizing activities of all students—allowed for reflection about the diversity of student participation.
We also identified evidence of actual changes to faculty classroom practices (“refreezing”; Connolly & Millar, 2006). For example, in the third workshop, one participant stated, “[I increased] the opportunity for student engagement by preparing ahead of time multiple slides within a lecture where questions can be posed.” Another indicated that they “added [sic] many more short questions to the students” and “also tried to add more group problem-solving sessions.” These reported changes reflect shifts toward an increase in active teaching practices.
Outcome 5: Faculty found using the SPOT useful.
Post-workshop survey responses indicated that participants found the SPOT useful for faculty development. Specifically, all participants responded that the SPOT was useful or very useful for “participating in a facilitated workshop series about teaching,” “helping my colleague analyze their teaching,” and “discussing my teaching with a colleague.”
Discussion
Evidence from the faculty workshop series indicates that participants were able to reliably use the SPOT to observe classroom teaching and interpret the data outputs, as well as reflect on and modify their classroom practice. In particular, our analysis indicates that the SPOT allows faculty to reflect on their pedagogy and student activities, rather than course content or organization. These outcomes also provide evidence that the faculty benefitted from receiving concrete data about their teaching. These data increased participants’ awareness of their teaching practices and led them to articulate and implement changes in line with student-centered practices. Faculty were not prompted to make their instruction more interactive or to dedicate more time to active learning activities, yet their reflections about the data indicated a desire to make changes that overwhelmingly shifted in this direction. Because faculty made these realizations based on SPOT data, without external judgment about their teaching practices, faculty with varied classroom settings could consider changes without the restrictions of a single standard. In this way, the SPOT meets faculty where they are and provides agency to make changes aligned with their individual values and unique context. Overall, the SPOT increased faculty members’ awareness of their teaching and helped them make informed, evidence-based decisions about how to better engage their students during instruction.
In addition to workshops, the SPOT is designed for use in faculty learning communities, teaching consultations, and peer observations. (An example three-part workshop series outline, consultation protocol, and instructor review and reflection guide are available on the SPOT website: https://sites.google.com/wisc.edu/spot-protocol.) The central elements for all professional development contexts are an observer collecting data by observing at least 30 minutes of a class, and an instructor reviewing and reflecting on SPOT data with a peer or consultant, then articulating desired changes to practice. While reflecting on their SPOT data, an instructor would recall what they were doing during the observed class and connect the visual outputs with their experience. Then, they would be encouraged to describe things they noticed in their data, including surprises or questions that came to mind. For example, they might be encouraged to reflect on how they were spending class time or who was participating. Finally, they would articulate ideal patterns they would like to see in future SPOT data and what it would take to implement these changes. This progression promotes faculty identifying patterns that are already meaningful to them and articulating conceivable changes given their classroom context and constraints.
While the overall process, observation interface, and visual outputs are equivalent between different professional development contexts, each approach may align with different faculty and institutional needs. Workshops and learning communities (e.g., Cox & Richlin, 2004; Eison & Stevens, 1995) are particularly well suited to use the SPOT because faculty are able to compare their SPOT data with one another, with a facilitator prompting discussions about evidence-based strategies. Some faculty may seek out peer observation if their institution does not provide these kinds of teaching development resources, and others may engage in peer observation because it is required for the retention, tenure, and promotion (RTP) process (Fletcher, 2017).
Incorporating the SPOT within existing structures for higher education teaching evaluation may be especially effective for encouraging widespread adoption of active strategies among STEM faculty. Using the SPOT for the RTP peer observation process could provide an institutional incentive, along with formative feedback, toward adopting more active teaching techniques, given that the SPOT focuses on classroom activities rather than content and organization. In fact, faculty members in our workshop series stated, “I think [the SPOT] would be a valuable tool for the RTP process. . . . It’s easier to convince someone of what they are doing when they have the data in front of them” and “SPOT removes the subjective aspect of peer observations.” However, SPOT data should not be the only measure to evaluate teaching practice, as the SPOT does not measure “good” or “bad” teaching. Rather, we suggest that SPOT data be integrated into a cyclical process including classroom observation, reflection on SPOT data, and changes to teaching practice. Used repeatedly in this way, SPOT data could show longitudinal shifts in instructor teaching practice. Beyond evaluation for RTP, SPOT data may be valuable in other contexts in which evaluators need to examine trends in teaching practices, including changes through time, variations between instructors and courses, and the extent to which faculty incorporate active teaching techniques that promote student learning.
Conclusion
The SPOT is a classroom observation protocol optimized for use in teaching professional development with higher education STEM faculty. The SPOT provides faculty with illustrative, research-based information about their classroom activities, including their use of active instructional approaches. This information allows faculty to reflect on their current practices and articulate desired changes that align with personal teaching values and the constraints of their academic environment. Outcomes from a faculty workshop series demonstrate that use of the SPOT is a promising approach to promoting faculty reflection on their use of active strategies and that this reflection motivates faculty to change their teaching, increasing opportunities for active student engagement.
Acknowledgments
The SPOT was developed with funds from NSF DRL award #1337069. The authors appreciate contributions from Andrew Reid, who did the original coding for the SPOT; Matt Steinwachs and the Tools for Evidence-based Action (TEA) group at the University of California-Davis (UCD), who added the SPOT to the Generalized Observation and Reflection Platform (GORP); the instructors at San Jose State University, University of Wisconsin–Madison, and UCD who participated in the SPOT workshops and allowed the SPOT observations in their classrooms; the UCD Center for Educational Effectiveness for supporting Cara Theisen’s work on this project; and Professor Mark Felton and the SPOT advisory board for their feedback and guidance on the development of the SPOT. The SPOT is available at gorp.ucdavis.edu, with additional materials and guides available at the SPOT website (https://sites.google.com/wisc.edu/spot-protocol).
Cara H. Theisen (chtheisen@wisc.edu) is director of professional development in teaching and learning and teaching faculty in WISCIENCE at the University of Wisconsin–Madison. Cassandra A. Paul is an associate professor at San José State University and has a joint appointment in the Department of Physics & Astronomy and the Science Education Program. Katrina Roseler is an associate professor and director of teacher education programs in the School of Education and Behavioral Sciences at Chaminade University of Honolulu, Hawaii.
Leadership Preservice Science Education Professional Learning Teacher Preparation Teaching Strategies Postsecondary