
Research & Teaching
Influence of Environmental Factors on the Success of At-Risk Hispanic Students in First-Semester General Chemistry
Journal of College Science Teaching—March/April 2022 (Volume 51, Issue 4)
By Blain Mamiya, Cynthia B. Powell, G. Robert Shelton, Anton Dubrovskiy, Adrian Villalta-Cerdas, Susan Broadway, Rebecca Weber, and Diana Mason
This article looks at the effects of environmental factors such as classification, residence location, and employment status of Hispanic students who unsuccessfully completed first-semester general chemistry (Chem I) at a Hispanic-Serving or emerging Hispanic-Serving Institution. Students’ automaticity skills in arithmetic and quantitative reasoning (QR) were evaluated as a way to identify at-risk students. Arithmetic skills, measured by the Math-Up Skills Test (MUST), had a higher effect size than the QR assessment. Using both diagnostics identified more than 90% of at-risk Hispanic students. Results indicate positive correlations with course performance at both types of institutions; thus the diagnostics were considered appropriate for early identification of at-risk students. Evaluation of environmental factors revealed few differences between at-risk Hispanic students who attended either type of institution. The most marked result identified a group of typical students who worked at least 31 hours per week and entered with QR scores within the average range but completed Chem I with class averages of less than 50%. Correcting for this observation is possible when students have additional financial support.
Demographic factors can be separated into personal characteristics (Villalta-Cerdas et al., in press) and environmental factors. In this article, we evaluate how environmental factors (e.g., type of university attended, classification, residence location, and employment status) affect whether Hispanic students in a first-semester general chemistry class (Chem I) succeeded in the course or failed to qualify for the second semester after receiving a letter grade of D or F (i.e., unsuccessful). Earlier research has shown that it is possible to identify Chem I students in the first week of class who are at risk for not succeeding by administering simple diagnostic assessments (based on students’ automaticity skills) that determine which selected arithmetic calculations can be solved without using a calculator (Williamson et al., 2020). Identification of at-risk students can provide instructors with time to offer scaffolds for students’ success early in the semester. Data for this Chem I evaluation were collected at six universities that were either Hispanic-Serving or emerging Hispanic-Serving Institutions (subsequently referred to as HSIs and eHSIs, respectively). In this paper, we call attention to data only from students who were unsuccessful in Chem I and thereby discouraged from continuing to second-semester chemistry (Chem II) or prohibited due to mandated prerequisites. If a student decides to remain a STEM major, most will have to retake the course (financial penalty) and will fall out of sequence with courses on their degree plans (graduation delayed, as retaking a course or courses usually leads to compounding effects on other courses); as a consequence, some will change to majors that do not require general chemistry (an example of a STEM-retention issue). These key retention and persistence metrics negatively affect the number of students graduating with STEM majors.
According to the latest estimates by the Kaiser Family Foundation (2020), the percentage of Hispanic individuals living in poverty in Texas was 21.0% (significantly higher than the national average of 17.1%). This report is consistent with data from 10 years prior, when the U.S. Census report stated that the percentage of Hispanic people living in poverty (22.0%) nearly doubled the national average (12.6%; Wilkerson, 2008). The science workforce remains predominately White, non-Hispanic, and male, with less than 10% of careers occupied by females from minority backgrounds (National Science Foundation and National Center for Science and Engineering Statistics, 2017). While the number of Hispanic students attending HSIs (around 60% of enrollment) needs to increase, more concerning is the misbalance between the percentage of Hispanic individuals constituting the U.S. workforce (17%) and the percentage (about 8%) present in STEM fields (Fry et al., 2021). The number of published research articles that address students’ success in lower-level chemistry courses and include Hispanic ethnicity as a factor is small (Báez-Galib et al., 2005; Fernandez & Middlecamp, 1999; Garcia et al., 1993; Mason & Mittag, 2001; Villalta-Cerdas et al., in press). According to Zeldin et al. (2008), more studies are needed that demonstrate an ongoing need to retain female students and students from racial and ethnic minority backgrounds in STEM fields.
A decrease in grade point average (GPA) of about 0.75 is observed when students are only enrolled in school part time during their first year (Habley et al., 2012; Laursen & Weston, 2014). When a student takes only one course in a semester and receives a grade of D or F, this has a significant impact on the student’s GPA; additionally, part-time students typically spend less time on campus, which can make the situation even worse because they cannot take advantage of available academic support services (Kuh et al., 2007). Students who live on campus (or at home) have higher probability of being retained (Wilkerson, 2008). When a student gets help with study skills and works no more than 21 hours per week, the student’s GPA performance tends to improve by 0.12 points (Habley et al., 2012). Habley et al. (2012) also suggested that co-curricular activities should not take up more than 5 hours of a student’s time per week. Data on Chem I students collected by the Networking for Science Advancement (NSA) team showed that on-campus employment of less than 10 hours per week may be beneficial to students’ success (Williamson et al., 2020). This study looks at students’ choice of institution, academic classification (i.e., freshman, sophomore, junior, or senior), living accommodations, and employment status as environmental factors that affect success.
Purpose of study
Texas joins Hawaii, California, Nevada, and Maryland as states with the highest Diversity Index, which is a measure of “the chance that two people chosen at random will be from different racial and ethnic groups” (Jensen et al., 2021). These same states are also identified as majority-minority states. Between 2013 and 2018, the percentage of Texas students who met college-readiness standards upon graduation from high school fell from near 60% to slightly above 40%. According to the Texas Higher Education Coordinating Board (THECB, 2018), “42.6% of first-time [Texas] students [who enter] higher education are NOT college ready.” One reason given for this decline is that the graduation requirement of passing all 16 Texas Assessment of Knowledge and Skills (TAKS) tests is no longer available as a measure of college-readiness. The “4 × 4” TAKS was replaced by the State of Texas Assessments of Academic Readiness (STAAR), which only consider secondary students’ understanding of five courses—English I and II, U.S. History, Algebra I, and Biology—rather than assessing four courses over 4 years in the disciplines: English, science, social studies, and mathematics. Among 2011 high school graduates, 63.0% of students enrolled in higher education (HE) completed a certificate or degree after they had been deemed college-ready, and only 28.1% completed a degree when they were considered not college-ready (THECB, 2018). THECB (2018) reported that Hispanic enrollment in Texas universities is about 37%, with an overall 6-year graduation rate of 61%. Though more graduating seniors are considered underprepared for college, the “college-going” culture in Texas has gained momentum, as indicated by the increased number of applications, though this has only resulted in small increases in college-enrollment rates, with college-completion rates remaining constant (Cunha et al., 2018). The first step in improving the enrollment and completing rates is to identify students who are at risk for not continuing their education so interventions can be offered.
Institutions
The first seven authors in this study are part of a larger group that forms the NSA collaborative team composed of chemical education researchers who represent a region of about 45,000 square miles. The last author organized the team in 2016 in an attempt to understand the declining mathematics fluency of students attending postsecondary institutions in Texas, a majority-minority state. Due to the unique nature of the Texas HE community, the NSA team is well positioned to investigate whether Hispanic students attending HSIs have numerical automaticity and quantitative reasoning (QR) abilities that differ from those of similar students attending eHSIs. Only one public HE institution in Texas (a university located near the Texas-Arkansas border) cannot be classified as belonging to one of these two categories or a Historically Black College or University.
The HSI designation is assigned when Hispanic students make up at least 25% of the undergraduate population. Three universities that participated in this investigation are considered to be eHSIs that have at least 16% Hispanic enrollment, with the other three institutions recognized as HSIs (see Table 1). One of the HSIs is considered to be large (enrollment > 34,000 students), and the other two are medium-size schools with enrollments of approximately 5,000 students (Tai et al., 2005). Small schools are those that accept fewer than 5,000 undergraduates, like the private school identified in Table 1. Given the diversity in the types of institutions evaluated, the Hispanic student population considered provides a realistic view of the HE student population in a large majority-minority state, providing for better generalizability of the results.
Population
The Chem I courses in this study are intended for science majors, yet about a quarter of the students self-reported that they were not STEM majors. More than 94% of the students (n = 564) who agreed to participate in this Institutional Review Board (IRB)–approved study attended Texas public high schools prior to being admitted to one of the universities. This study focused on a subset of Hispanic students who voluntarily reported their ethnicity and participated in classroom administration of both diagnostic assessments. Having experienced an isomorphic high school curriculum as mandated by the Texas Education Agency, the students are mostly assumed to have completed equivalent secondary school experiences when enrolled in similar courses. Tertiary curriculum standards required of all Chem I classes are prescribed by the THECB and strengthened by American Chemical Society recommendations.
The subset of Hispanic students pulled from the larger population in this study have at least one more characteristic in common: These students failed to qualify to move from Chem I to Chem II because they had not met the requirement of earning a grade of C or better (average ≥ 69.5%) in Chem I. This specific group of course completers attended class, paid attention to required class activities, and completed the course, but they did not earn the grade necessary to progress to Chem II. Additional students who were excluded from the analysis include post-baccalaureates, those who did not sign the IRB release form, those who failed to be present at one or both diagnostic test days, those who failed to complete the demographic survey about their ethnicity and gender, and those who accumulated a course average of less than 10%. Successful students (72.7% of the Hispanic students at HSIs and 63.2% of the Hispanic students at eHSIs) were not evaluated. Our focus is on characterizing the nonpersonal factors that may present obstacles (e.g., classification, residence location, and employment status) to Chem I students deemed “college-ready” who did not progress to Chem II compared to those who did. The studied population is small (n = 69, 12.5% of the population), but it represents 41.8% of students who did not proceed to Chem II.
Methods
Prior knowledge is a known predictor of learning success in most disciplines (Shell et al., 2010). From research published by the NSA team, the Math-Up Skills Test (MUST) scores are predictive of Chem I success about 80% of the time (Williamson et al., 2020). In this study, environmental factors (those external to students’ personal characteristics) such as the type of institution attended (HSI or eHSI), classification, residence location, and employment status were considered.
Our research question was as follows: How do automaticity abilities of unsuccessful (grade of D or F) Hispanic students who attend HSIs (n = 39) or eHSIs (n = 30) correlate to students’ success in first-semester general chemistry (as assessed by the MUST and QR diagnostic instruments) when taking selected environmental factors into consideration?
Instruments
Demographic data were collected on the following indicators: ethnicity, classification, where students lived during high school based on the first two digits of their reported ZIP code, current living accommodations (i.e., living in university-supported housing or not), and employment status (i.e., on- or off-campus employment and number of hours worked). All approved Chem I students completed two calculator-free assessments as diagnostic measures to determine students’ automaticity ability: MUST (20 free-response items, 15 minutes) and QR (20 multiple-choice questions, 30 minutes). Each assessment has two versions; no statistical differences (p < 0.05) were found between versions of either assessment. Average diagnostic score data from the MUST and QR instruments for all students (n = 564), arranged by type of institution and self-reported ethnicity, can be found in Table 2.
The MUST requires students to respond to items by multiplying, interpreting numbers in scientific notation, using simple exponents, writing fractions in decimal notation, using logarithms, and determining square roots of numbers in scientific notation; one item requires the student to rearrange an algebraic equation (ideal gas law) and another two require students to balance simple chemical equations. The QR has three distinct parts that are routinely used in general chemistry: simple arithmetic (e.g., fraction and decimal ordering and conversions, estimates, and averaging), algebra (e.g., typical algebra-based word problems, one-step dimensional analysis-type conversions, and rearrangement of an equation with complex fractions), and problems focused on the use of images (e.g., diagrams, graphs, and charts) to answer questions and interpret the data presented.
Hartman and Nelson (2016) published the initial version of the automaticity quiz, which became the open-ended MUST used in this study. MUST answers are right or wrong, so the KR-20 (equivalent to Cronbach’s alpha) is appropriate for the data (n = 564) in this study: rkr20 = 0.87 (good internal consistency, very high reliability). The National Numeracy Network database (National Science Foundation, 2012) was used to select QR questions that could be considered solvable without the use of a calculator. The QR quiz was scored as right or wrong: rkr20 = 0.73 (acceptable internal consistency, high reliability). There are no repeated questions on the MUST and QR assessments.
Hispanic students’ MUST and QR scores in this study showed a strong correlation (r = 0.67). The Cohen’s d (effect size) for the MUST is 1.40 (large), and the Cohen’s d for the QR is 0.784 (medium). According to these statistics, a student’s MUST score has a large effect on final course grade. QR scores had varied impact on Hispanic students enrolled at HSIs and eHSIs. For Hispanic students who attended HSIs, there was a large effect, while there was only a medium effect for Hispanic students attending eHSIs. Overall, the Cohen’s d results support the QR having a large effect on Hispanic students’ averages (1.03). (Copies of the two versions of the MUST instruments are available in Williamson et al., 2020. The QR quiz is part of NSF DUE 1140562 project.) The use of the QR assessment is included because similar skills are important for success in Chem I, which has strong algorithmic and conceptual aspects, such as the interpretation of reading graphs and charts and making judgments on whether an answer is acceptable, which introduces a quantitative literacy (QL) component.
No restrictions were placed on how instructors’ classes were conducted, making this study as broadly applicable as possible. Some instructors teach large group lectures (n ≥ 200) and some teach small groups (n < 35); some give online homework and others do not; and some are lecture-only, while others conduct a more active classroom. The researchers were interested in the influence of calculator-free arithmetic and the QR abilities on the final course averages for Hispanic students who did not progress to Chem II, as well as the possible effects of environmental factors on success. At the end of the semester, final numerical course grades (determined as a percentage of points earned out of the total points possible) were collected from each instructor as an output measure of course completion. Data were deidentified and compiled by the last author, external to the teaching faculty, into one Excel file before analysis.
Results
Both diagnostic assessments were scored out of a maximum of 20 points. Table 2 shows that the scores on the MUST and QR quizzes, when arranged by the category (leftmost column), align from low to high (i.e., 4.0 to 8.2 for the MUST and 10.0 to 12.9 for the QR). The average-score ranges (one standard deviation around the mean) for the MUST and QR are 10–14 and 12–16 questions correct, respectively. It is useful to divide students into three categories based on their diagnostic quizzes—above average (I), average (II) and below average (III)—and compare these averages to final course grades. In Figure 1A (MUST) and 1B (QR), the alluvial diagrams indicate that no Category I student (periwinkle-colored “river”) on the MUST and only two Category I students (2.9%) on the QR earned a D and no one in Category I received a grade of F. Comparing Category IIIs (salmon-colored “river”) on these diagrams, a larger percentage (i.e., wider “river”) of the 69 unsuccessful students scored below average on the MUST than on the QR.
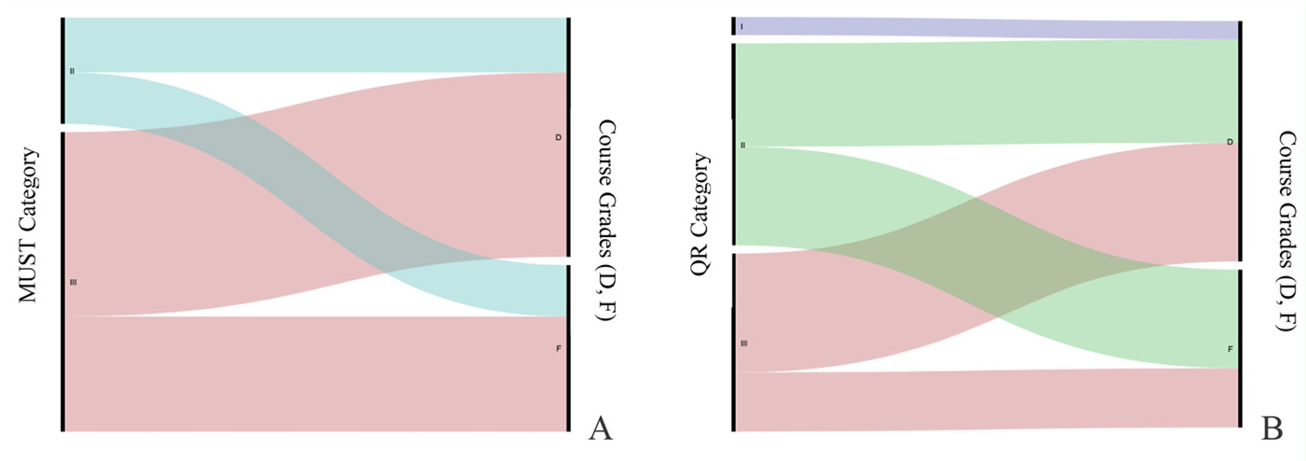
Alluvial diagrams for MUST and QR assessments.
Note. Alluvial diagrams for MUST (1A) and QR assessment (1B). MUST and QR score categories: I = above average, II = average, III = below average. MUST average range: 10–14 correct answers; below average < 10; above average > 14. QR average range: 12–16 correct answers; below average < 12; above average > 16. MUST = Math-Up Skills Test; QR = quantitative reasoning.
Group averages on items evaluated in Table 3 display no significant differences. At eHSIs, Hispanic students supposedly entered with more prior knowledge than Hispanic students at HSIs, as measured by the diagnostic quizzes, but students at the eHSIs had a slightly lower course average. Hispanic students who did not progress to Chem II (Table 3) averaged lower on the MUST and QR with 5.3 (3.4) and 11.2 (3.1), respectively, than did their Hispanic classmates who did go on to Chem II (n = 399) and who entered with average MUST and QR scores of 5.9 (4.9) and 11.6 (3.5), respectively. Overall, these scores were significantly lower (p < 0.05) than for their Hispanic classmates who did succeed in Chem I (MUST = 8.3 [5.0] and QR = 13.2 [3.4]) and finished the class with an average (SD) of 84.1% (8.8).
Different students at different universities struggle with the same problems on the MUST and QR diagnostics, indicating that they entered with similar understandings and misconceptions at the beginning of the semester. Figures 2 and 3 graphically illustrate that all students in this study come with similar levels of prior knowledge, regardless of whether they attended an HSI (Figure 2) or eHSI (Figure 3). Note similar up-and-down flow of the lines on these diagrams. Non-Hispanic students attending HSIs (blue lines) may, for the most part, represent the higher averages on both diagnostics, but when the scores go up on a particular question, the same is true for each group. Note that the gaps between student groups on the MUST (Part A) are larger than the gaps between the two groups on the QR (Part B) at these HSIs. Non-Hispanic students attending eHSIs (blue lines) may, for the most part, represent the higher averages on both diagnostics, but when the scores go up for a particular question, the same is true for the other group.
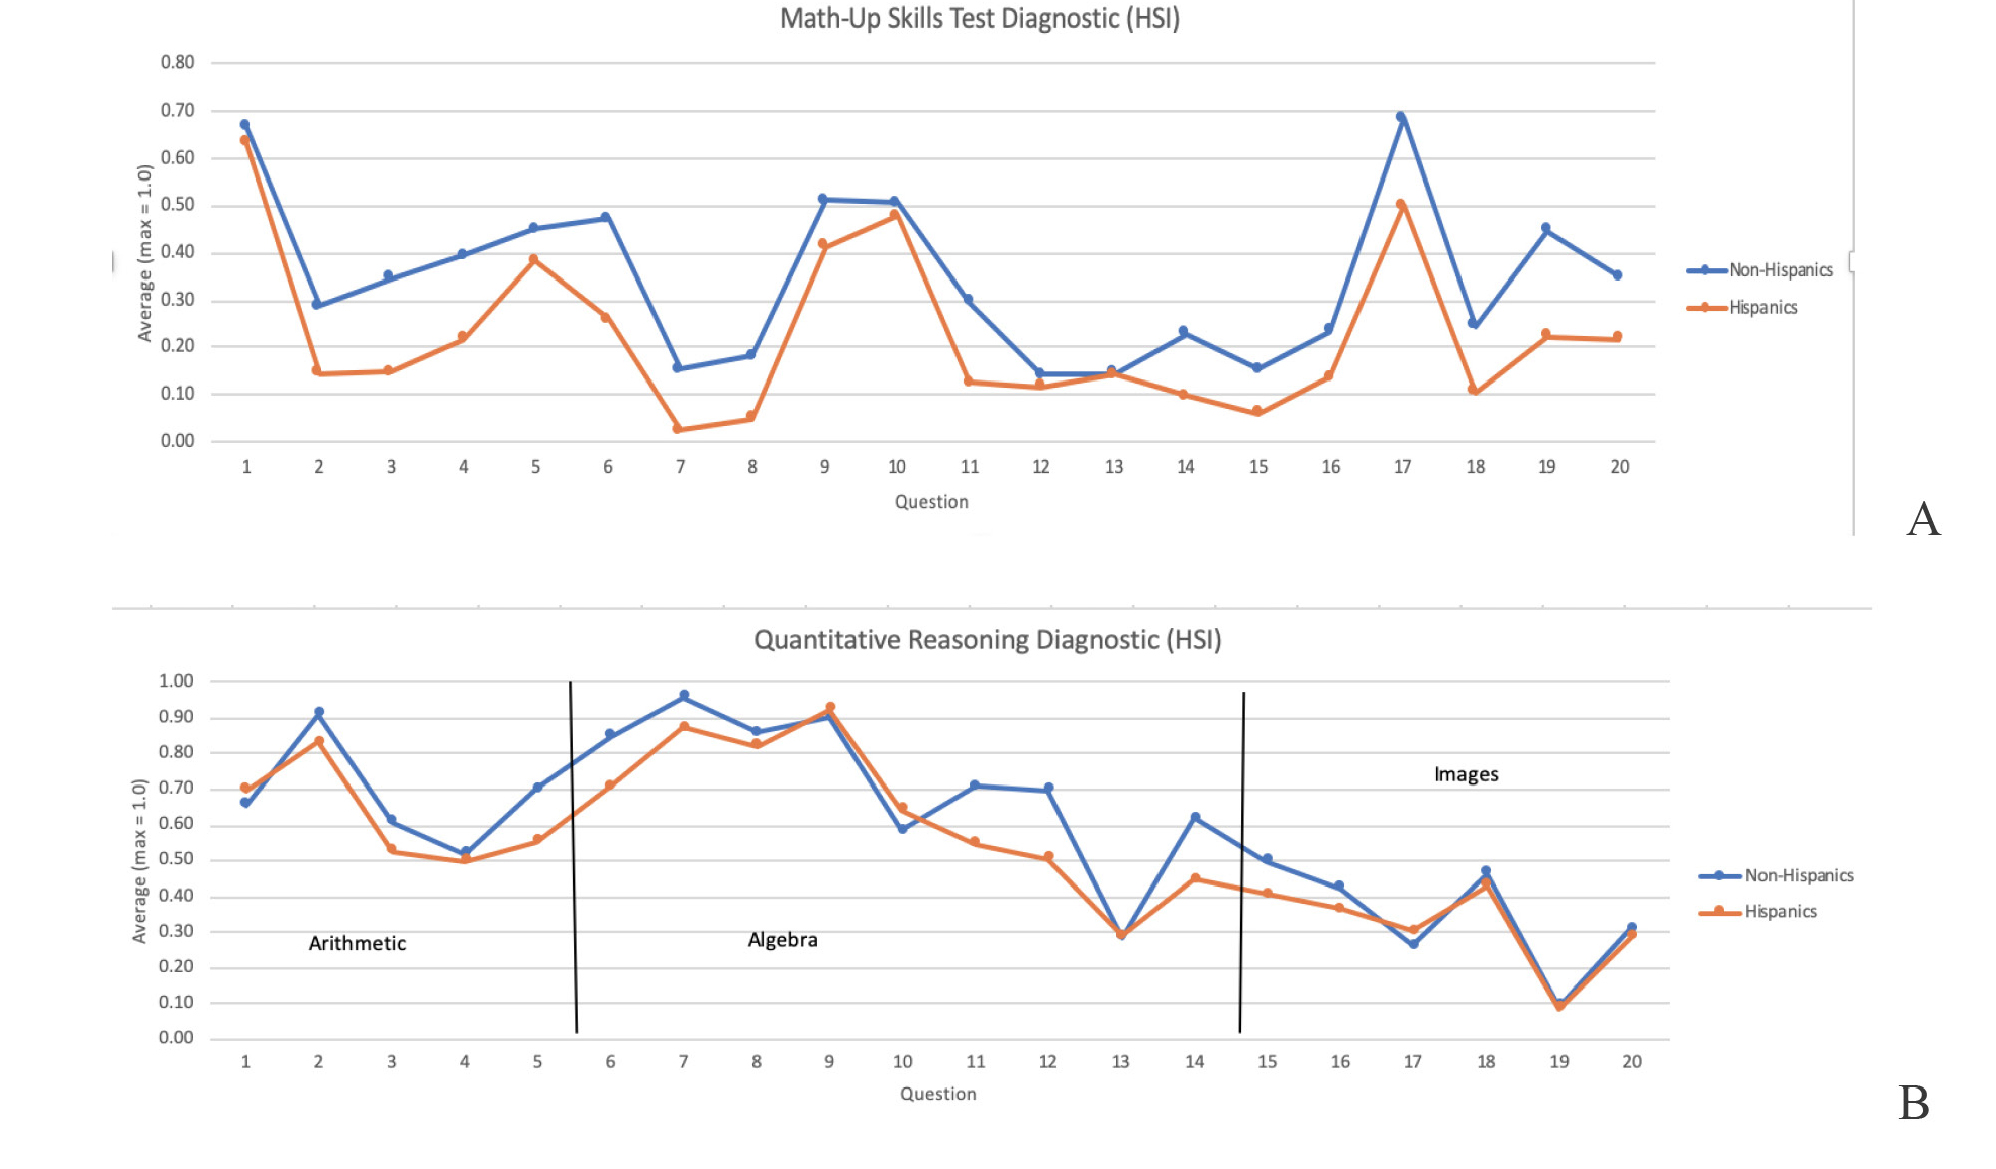
Graphic results of MUST and QR for students enrolled at the three HSIs.
Note. MUST score averages by question (2A) and QR score averages by question (2B). HSIs = Hispanic-Serving Institutions; MUST = Math-Up Skills Test; QR = quantitative reasoning.
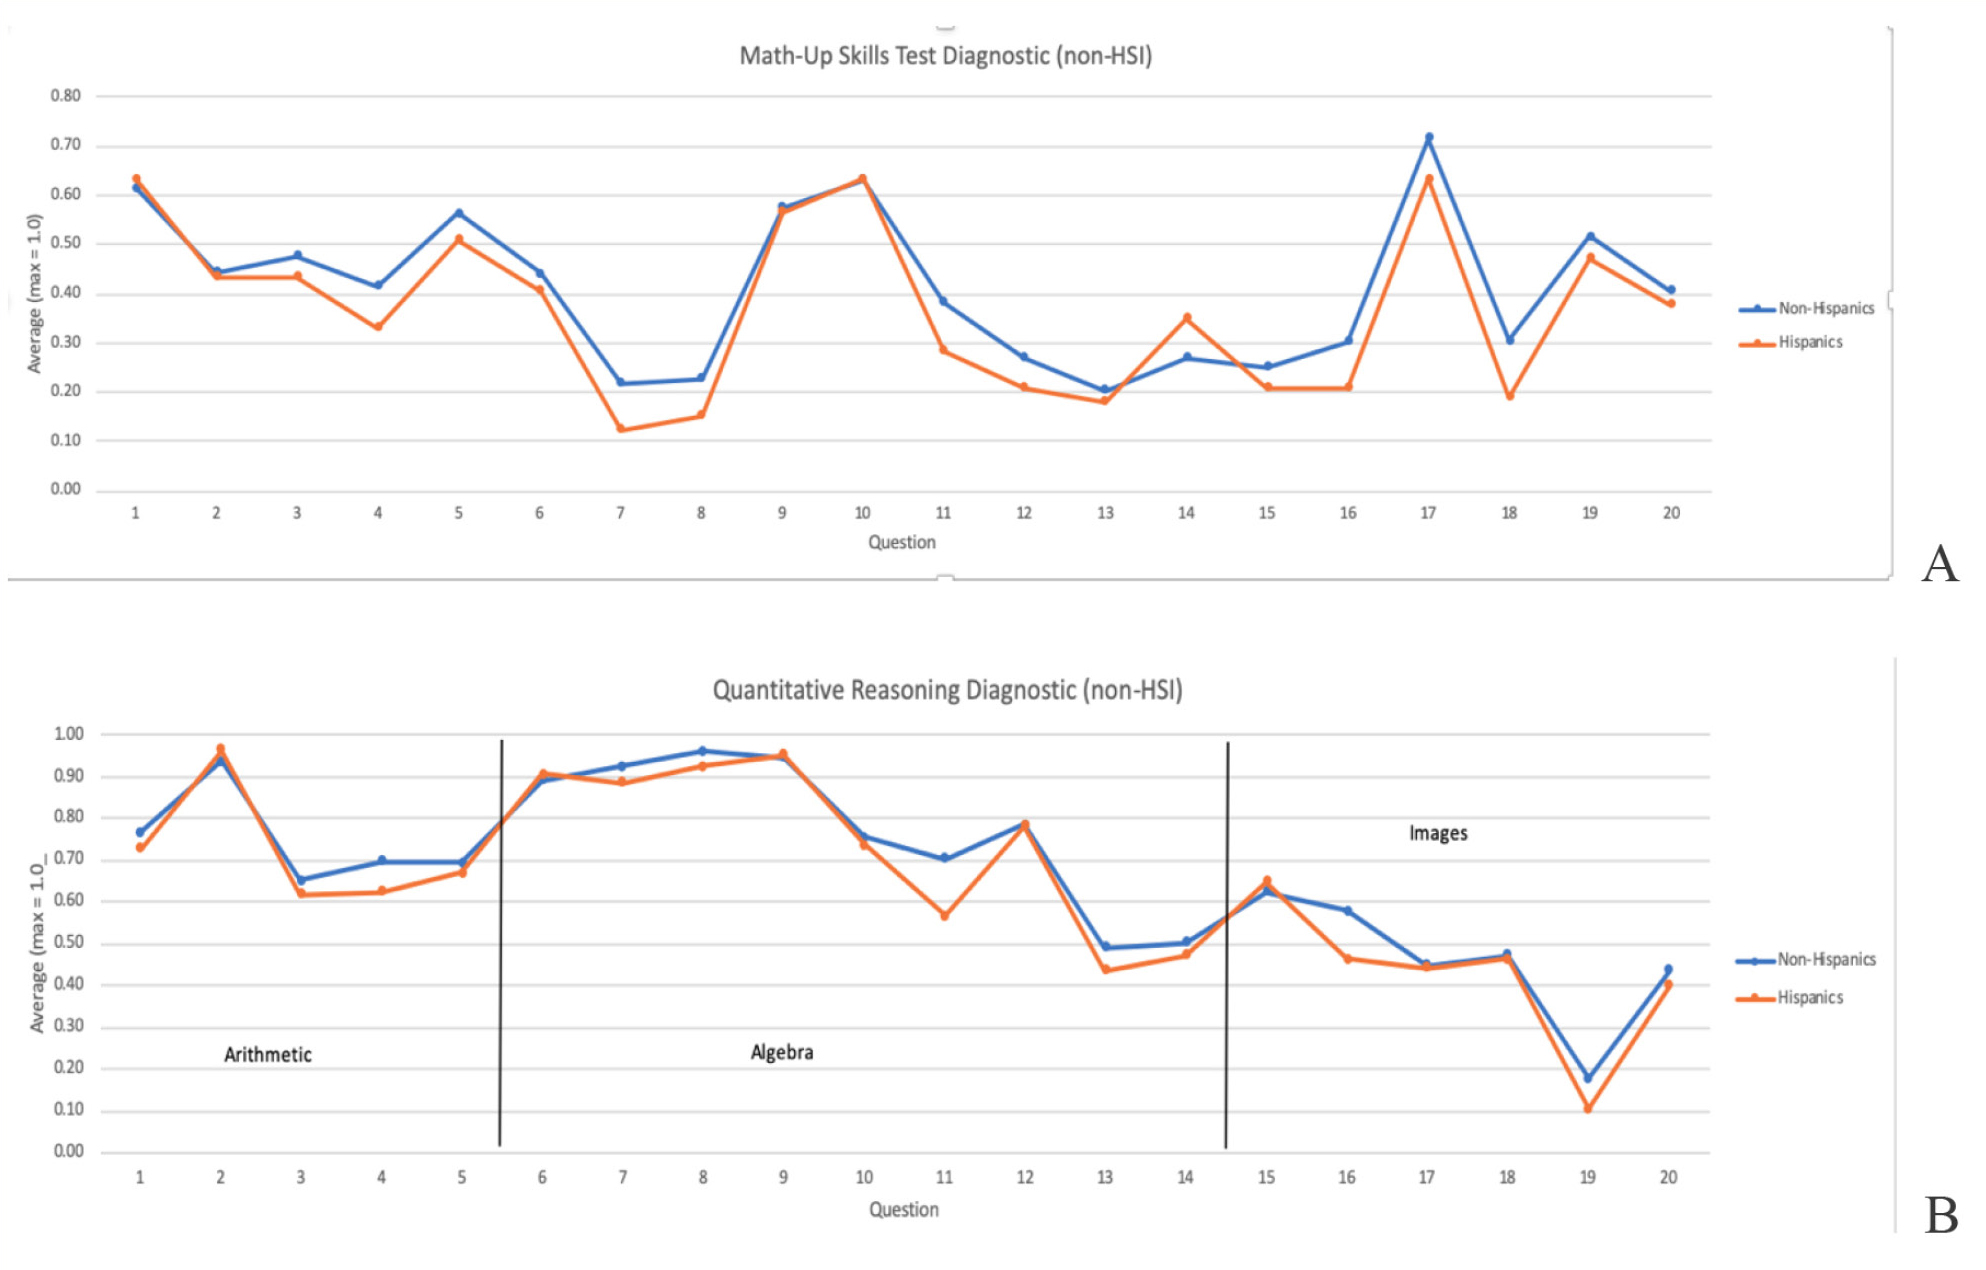
Graphic results of MUST and QR for students enrolled at the three eHSIs.
Note. MUST score averages by question (A) and QR score averages by question (B). HSIs = Hispanic-Serving Institutions; non-HSI/eHSI = emerging Hispanic-Serving Institutions; MUST = Math-Up Skills Test; QR = quantitative reasoning.
Environmental/nonpersonal factors
The following descriptors address nonpersonal factors that affected the success of the 69 Hispanic students (divided between HSIs [n = 30] and eHSIs [n = 39]) who did not succeed in Chem I.
Classification
Chem I is a freshman-level course, but some students delay taking this course until a later time for a variety of reasons. Some are intimidated by its reputation of being a “killer” course (Rowe, 1983), others may not have met stated prerequisites, and some may start college pursuing a major that does not require Chem I and then change to a major that does. Classification levels are influenced by how a university accepts or denies credit (e.g., dual enrollment, Advanced Placement credit, or different readings of descriptions) and therefore is not a reflection of students’ personal characteristics. As shown in Table 4, 32 students (46.4%) had accumulated enough course hours to no longer be considered a freshman. The only statistical differences (p < 0.05) found were between sophomores and freshmen on both diagnostic assessments where Hispanic students at eHSIs performed higher. At HSIs, sophomores (typically older students who have more life experiences) significantly outperformed freshmen on the QR assessment.
Residence location
No statistical differences were seen between the diagnostic quiz scores or class averages depending on where students reside (Table 5). Students who lived off campus (n = 24; 35.3%) entered with lower MUST and QR averages at eHSIs and completed Chem I with a lower class average (52.6%) compared to those who lived in a dorm (60.7%). At the HSIs, students completed the course at a slightly higher average (60.5%) than at the eHSIs (58.2%), but the diagnostic scores were mixed (i.e., off-campus students scored lower on the MUST and higher on the QR than their classmates who lived in a dorm), but the class average of those living in a dorm was lower (59.0%) than those who lived off campus. It is possible that a substantial number of the 24 students who did not live in an on-campus dorm might have remained at home, but this information was not obtained on the demographic survey. Habley et al. (2012) reported that living on campus provided academic benefits, but in this study it is unclear because it was only true at the HSIs.
Employment
The majority of the students who did not succeed in Chem I (n = 45; 65.2%) did not work (Table 6). Of the 23 students who reported to work (one HSI student’s work status was unknown), the largest group (11 students, 5 at eHSIs and 6 at HSIs) reported that they worked between 11 and 20 hours per week. Two of the six HSI students worked on campus and the remaining four HSI and five eHSI students worked off campus. Students at eHSIs who worked between 1 and 10 hours per week produced the highest course average of 67.0%, which was consistent with previously observed NSA results. The lowest course average (38.7%) was earned by students at eHSIs who worked off-campus for 31 to 40 or more hours per week; what is concerning is that they entered the course with the highest MUST average other than the one student outlier who did not attend high school in Texas. Results when grouped by hours worked (0, 1–20, and 21–40+; Table 6 shading) showed that students who worked more than 20 hours per week had higher QR scores than those who did not work or who worked 1 to 20 hours per week. However, even though these students entered the classes with below-average MUST scores and average QR scores, their final course average (49.7%) was significantly affected, adding support for the importance of basic arithmetic automaticity for success in Chem I. The outlier mentioned above entered with MUST = 14 and QR = 18 and is one of the four students who did not attend high school in Texas, worked full time, and attended an HSI, which skewed the overall MUST and QR scores for the group of students who worked 21–30 hours per week.
Limitations
Not everyone in the group of students who succeeded in Chem I (accumulated average ≥ 69.5%), whether of Hispanic descent or not, performed above average on the MUST and/or QR quizzes. These two instruments are useful for identifying not only potentially at-risk students but also those who did not perform well by choice or as a result of extenuating circumstance(s) unrelated to academic ability. Instructors should always err on the side of caution and offer appropriate interventions to all students who will accept additional support and advising, while being alert to the potential needs of students who scored low on MUST and QR assessments.
Discussion
Implications
The majority of the evaluated population attended high school in Texas, were classified as freshmen, and did not work. Overall, Hispanic students at eHSIs who did not succeed in Chem I completed the course with a lower average than their counterparts at HSIs, though not by a statistically significantly higher amount. Knowing students’ MUST and QR scores will be helpful when trying to identify at-risk students. The most impressive finding is that no Hispanic student who did not succeed in Chem I scored in the above-average range on the MUST, and only two individuals (2.9%) from the group that did not successfully complete the course scored above average on the QR diagnostic; 37 (53.6%) students scored below average on both the MUST (< 10 correct questions) and QR (< 12 correct questions), with another 26 (37.7%) scoring below average on at least one diagnostic. Giving students both assessments may identify more than 90% (53.6% + 37.7%) of the students who are unlikely to succeed in Chem I early in the semester, allowing time for instructors to intervene and reinforce dormant automaticity skills.
A few differences between unsuccessful Chem I Hispanic students who attend HSIs versus eHSIs are worthy of note. The demographics addressed in this study disclosed that unsuccessful Hispanic students at HSIs entered Chem I with less arithmetic-automaticity ability and lower QR ability than those who were enrolled at eHSIs (Table 3). On average, the weakest unsuccessful student’s characteristics is one of junior classification (whether attending an HSI or eHSI) and, if attending an HSI, living in university-supported housing while working between 21 and 30 hours per week. The average lowest-performing eHSI student was a junior who lived off campus and worked more than 30 hours per week. The most prominent characteristic of a struggling student was that the student worked more than 20 hours per week (or full time). An apparent potential correction for this factor is to provide more opportunities to reduce financial constraints and therefore reduce the need for a student to work full time. In general, students who do not work showed higher prior automaticity knowledge, as documented by their MUST score of 5.7 with average QR ability. The students with more working hours and therefore more real-world experiences have greater QR ability, as would be expected. Consistent with the literature (Habley et al., 2012) students who work part time tend to outperform other groups of students. According to Habley et al. (2012), when this employment was on campus, the outcome improved.
Recommendations
One of the study’s authors has implemented an intervention to improve students’ engagement and motivation by creating “freshman-only” Chem I classes. The design of the Chem I sections aims to increase students’ metacognitive skills using an evening study session to help students understand how to learn. New lessons were designed to help students become aware of their personal learning habits using topics presented in lecture. Preliminary data indicate changes to the course structure and use of formative assessments have helped guide learning and provided a positive effect on exam scores. For comparison purposes, using the Chem I classes in fall 2018 (one course) and spring 2019 (two courses), where the average percentage correct was between 53% and 56%, current indicators from the supplemented Chem I classes in fall 2019 (two courses) are favorable. The average on the exams was between 63% and 68%. Another point of interest is that the lowest score for the fall 2018 and spring 2019 classes ranged between 16% and 21%, while for the fall 2019 classes, the lowest score improved to between 30% and 37%.
Conclusion
Knowing students’ MUST scores gives a reasonable approach to identifying students at risk of failure; knowing students’ QR scores adds value and might also be indicative of a literacy component important in multiple fields. The value of this study is that it evaluated a sizable number of students at six universities in a large majority-minority state who did not succeed in Chem I. By comparing the MUST and QR means for the average student, we found that Hispanic students in this study who did not succeed in Chem I averaged 5.3 on the MUST and 11.2 on the QR compared to the Hispanic students who did succeed in the course and entered with averages of 7.4 and 12.6 on the MUST and QR, respectively. The MUST had a greater effect size than the QR assessment, supporting the idea that basic arithmetic skills are more predictive than QR skills, but improving QL skills may have an influence on what students will need in their careers.
This study adds data to a lacking knowledge base regarding struggling students from Hispanic backgrounds, the largest ethnic minority in the United States (Jensen et al., 2021). Before at-risk Chem I students can be helped, they need to be identified. When these students are identified and necessary skills are restored to a level needed for success in general chemistry, the potential for students’ improved persistence and retention toward obtaining a STEM degree will help increase minority participation in the STEM workforce. Improving postsecondary education needs to be a priority because it helps students develop valuable new skills, enhances their critical problem-solving abilities, and finds opportunities for successful students to gain experience as leaders, which will make them more competitive job applicants and improve their likelihood of having a successful career after graduation.
Acknowledgments
The authors extend our appreciation to Judy Hartman and Rick Nelson, who provided insights into the importance of investigating calculator-free assessments and the impacts of automaticity.
Online Connections
Blain Mamiya (bmm172@txstate.edu) is a lecturer in the Department of Chemistry at Texas State University in San Marcos, Texas. Cynthia B. Powell is a professor in the Department of Chemistry and Biochemistry and executive director for the Center for Pre-Health Professions at Abilene Christian University in Abilene, Texas. G. Robert Shelton is an instructional assistant professor in the Department of Physical, Mathematical, and Engineering Sciences at Texas A&M University San Antonio in San Antonio, Texas. Anton Dubrovskiy is an associate professor in the Department of Physical & Applied Sciences at University of Houston-Clear Lake in Houston, Texas. Adrian Villalta-Cerdas is an assistant professor in the Department of Chemistry at Sam Houston State University in Huntsville, Texas. Susan Broadway is a lecturer and inventory supervisor, Rebecca Weber is a senior lecturer and undergraduate advisor, and Diana Mason is a professor emeritus, all in the Department of Chemistry at University of North Texas in Denton, Texas.
Chemistry Environmental Science Equity Multilingual Learners Teacher Preparation Teaching Strategies Postsecondary