
Research & Teaching
Teaching in Tandem
Using Graphs in an Active-Learning Classroom to Shape Students’ Understanding of Biology Concepts
Journal of College Science Teaching—March/April 2023 (Volume 52, Issue 4)
By Emily G. Weigel and Aakanksha Angra
In the information age, the acquisition of data literacy skills has become increasingly important for undergraduate student success, yet these skills are not emphasized in the lecture setting. Here we present a study to inspire educators to scaffold graph knowledge and interpretation into their classrooms. Specifically, we sought to understand how frequent use of published graphing materials (Angra & Gardner 2016, 2018) and freely available primary literature and data repositories, complemented by active-learning instructional approaches, in an upper-level animal behavior lecture course affect student graph knowledge and interpretation skills. The effectiveness of graphing materials and students’ graphing abilities were evaluated by three exams over the course of the semester. Findings revealed overall improvement with graph choice and interpretation abilities, particularly in interpreting the purpose of the graph, the nature of the data, and the relationships between independent and dependent variables and take-home messages. These findings support and extend the utility of the graphing materials to undergraduate lecture courses and illustrate the progression of student learning with graph choice and interpretation.
Data are an inevitable part of modern-day society. Much like being literate (i.e., reading, writing, and arguing with words), there is an ever-present need to be data literate. National documents in undergraduate education have repeatedly emphasized the importance of providing ample opportunities for students to collect, interpret, and critique data (American Association for the Advancement of Science, 2011; College Board, 2015; Gormally et al., 2012). As educators, it is our duty to train students in data literacy and prepare them for careers that demand these skills (Co, 2019; Strauss, 2017).
Although data literacy is regarded as an important skill by faculty (Gormally et al., 2012), it is not readily taught and assessed. Personal conversations with faculty at conferences and at our institutions, as well as with high school teachers, revealed that although there is an interest in teaching and assessing data literacy, graphing is rarely explicitly taught and assessed in the lecture classroom, often due to time constraints, lack of knowledge on existing graphing instructional resources, challenges in scaffolding, or the expectation that graphing is best suited for laboratory sciences (National Research Council, 2003). The often-disjointed nature of labs from lecture, combined with unclear objectives and variation in graph skills and emphasis between instructors (e.g., lecturers, lab coordinators, graduate and undergraduate teaching assistants) leading these courses, further derails the opportunity to develop students’ graphing skills (Angra & Gardner, 2017; Harsh et al., 2019; Matz et al., 2012). Students in lecture often do not conduct their own experiments but are analyzing experiments and data from others’ work, which is how students generally encounter data in their day-to-day lives (Bray-Speth et al., 2010; Harsh & Schmitt-Harsh, 2016; Kirby et al., 2019). Additionally, student training in a typical lecture setting is guided by an expert scientist, as compared to a graduate student staffing a laboratory section, where undergraduates at many institutions often receive the most practice with data. As graduate students have not reached the expert level of data handling possessed by experienced professors, a graduate student’s own lack of experience with graphing poses a problem that may manifest in undergraduate instruction and student thinking (Angra & Gardner, 2017; Harsh et al., 2019).
Therefore, as experts, lecture instructors must be deliberate with developing students’ statistical and experimental skills that will be required by graphs (Åberg-Bengtsson & Ottosson, 2006; Garfield et al., 2007; Pelaez et al., 2017; Shah et al., 1999). Alongside information extraction and graphical inferences (Friel & Bright, 1996; Shah et al., 1999), selection criteria used for creating communicative graphs (diSessa, 2004; diSessa & Sherin, 2000; Grawemeyer & Cox, 2004; Novick, 2004; Tufte & Graves-Morris, 1983) must be explicitly taught. As suggested by Roth et al. (1999) and diSessa (2004), graphing must be presented as repeated opportunities to practice the skills necessary, which increase both graphing competency (McFarland, 2010; Roth & Bowen, 2001) and critical reflection (diSessa, 2004; diSessa & Sherin, 2000).
Recent work has focused on making the process of graph choice and construction more apparent to students (Angra & Gardner, 2016, 2018). The tools published in Angra and Gardner (2016) focus on scaffolding the implicit practices of expert biologists to guide students new to data and graphing through concrete steps for graph planning, execution, and reflection. Online data repositories such as Dryad and free online resources such as HHMI BioInteractive and Data Nuggets (Schultheis & Kjelvik, 2015) allow instructors to easily download, modify, and implement activities centered around experimental design and data in class. To give students timely and targeted feedback on mechanics, communication, and graph choice, instructors can use a detailed and validated graph rubric (e.g., Angra & Gardner, 2018); offering such explicit instruction can help increase classroom inclusivity (Kyburg et al., 2007).
In this study, we sought to understand how active-learning approaches, coupled with the frequent use of published graphing materials (Angra & Gardner, 2016, 2018) and freely available data repositories (e.g., Data Nuggets), affect student graph knowledge and interpretation skills across the semester in an upper-level animal behavior lecture course.
Methods
Setting
Under an approved Institutional Review Board protocol (H17231), data were collected over the summer 2017 and 2018 semesters in an upper-division animal behavior course at a large southeastern R1 institution. The subjects were 41 undergraduate students enrolled in the course during summer 2017 and 2018 (pooled; Table 1).
Course layout
The published graphing materials were introduced and implemented in a 10-week animal behavior lecture course (see online appendix), which met three times a week for 1 hour. Each lecture was taught by Emily Weigel and began with a short lecture that reinforced the concepts learned in the previous lecture and addressed any difficulties students experienced in prelecture homework. After the instructor introduced the learning objectives, students were shown a behavioral scenario and asked to identify a research question and hypothesis, sketch their prediction in a graph, compare their sketch with the graph from primary literature, and reflect on the findings and how they contribute to studying animal behavior (see Appendix Figure S1 in Angra & Gardner, 2016, for an activity). These individual and think-pair-share activities were discussed at each step to give students real-time feedback. Occasionally, students were asked to make observations of zoo animals or their own pets, then propose research questions, hypotheses, and graphs to test and display their own observations. In-class activities were designed to be student centered, with class time divided up approximately as follows: 30% for independent graph construction and figure interpretation, 50% for figure discussion, and 20% for informal peer and instructor feedback.
Data collection and study design
Pre- and postsurveys
Students were given a 12-question pre- and postsurvey to evaluate their quantitative and experimental design knowledge. The presurvey was administered at the beginning of the semester and the postsurvey at the end of the last lecture in Week 10. The scenario in the pre- and postgraphing surveys and prompts were used from a previous study with experts and novices (Angra, 2016; Angra & Gardner, 2017). The only modification made was to ask students to describe how they would organize and label the axes and explain their graph choice rather than construct a graph (omitted due to time constraints of administering the survey in a single class period). Also included in the pre- and postsurveys were the quantitative reasoning questions from the Test of Scientific Literacy Skills (Gormally et al., 2012) and course-specific, behavior-related, exam-comparable graphing questions from common graph types in the field of animal behavior that were covered in the prerequisite introductory biology course. (Copies of materials and assessments are in active use but may be obtained by contacting Emily Weigel.)
Lecture exams
To measure students’ skill progression over the semester, we used data from three timed online exams. Each exam consisted of 10 multiple choice and five short-answer questions, derived from textbook content knowledge, and eight critical-thinking graphing questions from primary literature, which consisted of similar thought processes as the activities practiced in lecture.
Statistical model selection
To examine improvement across the pre- and postsurveys and exams, we used a series of mixed models fit by REML within R and used Satterthwaite’s degrees of freedom method for t-test approximation and linear model fitting (where appropriate; R Core Team, 2017). The base model for each test included the graphing skill variable of interest (e.g., correctly describes relationship of independent and dependent variables), as predicted by which assessment (either survey or exam, with respective values of pre- and post- for the survey or Exams 1, 2, or 3) and semester (to control for semester-to-semester variation). Although models in a few cases were better fit by Akaike Information Criterion by dropping the semester variable, we opted to remain conservative in our estimates and retain the semester in each model, as semester-to-semester variation would account for class-level demographic and instructional variation and remains an important consideration in validating an approach in the classroom. Thus, we retained the semester in each model, but for statistical power and fit, we did not retain gender, grade point average (GPA), race, and class level based on credit hours taken prior to that semester (e.g., sophomore, junior) as predictors. We subsequently separately assessed these factors to determine student-level factors of importance.
Results
Exam findings
When examining the improvements from Exam 1 to 3, we categorized the areas of potential improvements into five subcategories: (i) research question, (ii) hypothesis, (iii) graphed variables, (iv) graph purpose, and (v) conclusions reached from the graph (see the online appendix). We also examined an overall improvement score that consisted of a weighted overall score from the subcategories listed; this score captures graphing skill increases across students that are otherwise not attributable to any one subcategory alone.
When asked to extract the research question’s independent and dependent variables from a graph on Exam 1, students performed well and maintained that momentum on the succeeding exams (REML; all p > 0.05). By contrast, students consistently performed poorly on correctly noting the directionality of both the question and the hypothesis—that is, the independent affects the dependent variable (REML; all p > 0.05). Whereas the overall model for research question (Subcategory 1) and hypothesis (Subcategory 2) did not show significant improvement over the course, the model term for semester was consistently significant, meaning that the students in the 2017 semester class increased significantly more than those in 2018 in all categories except for directionality of question and hypothesis (REML; all t > -2.247, p < 0.0301).
When explicitly asked to name the independent and dependent variables, students performed well and experienced intense ceiling effects (and showed no improvements; REML with all p > 0.05), including in the overall variable subcategory (3) model. Interestingly, the 2017 class was significantly more skilled in naming variables compared with the 2018 class (REML; df = 78.94498, t = 2.847, p = 0.00562).
When addressing graph purpose (Subcategory 4), neither class showed gains in recognizing the nature of data displayed and how the data align with the research question (all p > 0.05), although the 2017 semester class was stronger (REML; df = 70.069, t = -2.183, p = 0.0324). Where students did show large gains on exams in skill, however, was in understanding the purpose of the graph (REML; df = 117.99951, t = 4.649, p = 8.75e-06), with the gains being potentially larger for the 2018 class (REML; df = 117.44567, t = 1.901, p = 0.0598). Students showed even stronger improvements when considering the entire Subcategory 4 (REML; df = 47.8572, t = 2.924, p = 0.00527), suggesting individual-dependent improvements in subsets of Subcategory 4.
Finally, when considering conclusions (Subcategory 5), students showed strong increases in the ability to draw a conclusion from the relationship of variables in a graph (REML; df = 49.09832, t = 5.182, p = 4.11e-06), particularly between Exams 2 and 3. Students also improved in their ability to identify trends in the data useful to making conclusions (REML; df = 52.32957, t = 3.215, p = 0.00224), with those effects strongest in the 2017 class (REML; df = 46.20080, t = -2.745, p = 0.00860). However, students generally showed little improvement in their conclusions, both in the statistical information used to draw the conclusion and situating the conclusions within a broader biological context (REML, all p > 0.05). When addressing the conclusions subcategory as a whole, students saw large skill gains (REML; df = 49.3598, t = 3.030, p = 0.00389), again suggesting individual-dependent improvements across the subcategory.
Overall improvement was investigated to capture increases in graphing skill not attributable to any one subcategory alone. We found that the students improved overall in their abilities (Figure 1; REML; df = 83.6559, t = 2.999, p = 0.00357), with students in the 2017 semester experiencing the most gains (REML; df = 47.7119, t = -3.224, p = 0.00228).
| Table 1. Disclosed demographic information of study subjects. | |||||||||||||||||||||
|---|---|---|---|---|---|---|---|---|---|---|---|---|---|---|---|---|---|---|---|---|---|
|
|||||||||||||||||||||
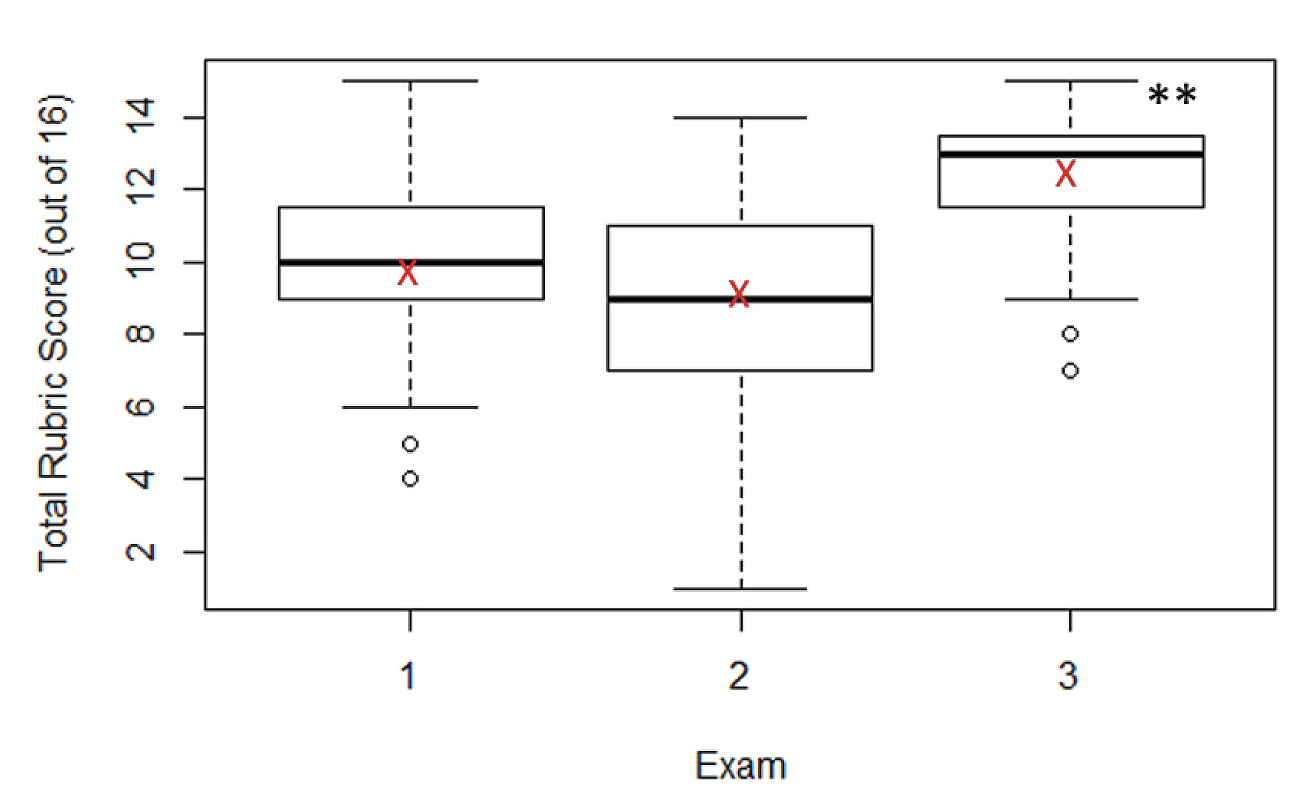
Student graphing performance improvement across the three semester exams.
Note. Box plots represent quartiles and sample medians (heavy bars); the open circles (if present) are outlying data points, and red Xs denote sample means. Significance level of < 0.01 denoted by **. Mixed effects model with semester and exam as predictors, df = 83.6559, t = 2.999, **p = 0.00357, N = 41.
Additional findings from pre- and postsurveys
When addressing the pre-and post-surveys, we found the same general results as discussed earlier—that is, students were well aware of which variables were independent and dependent and where they might be plotted, but they were less skilled in articulating the take-home messages from graphs. One additional improvement not captured by the exams was in student abilities to name graph elements (Figure 2; linear model; estimate = -0.19032, SE = 0.03702, t = -5.141 p=3.25e-06).
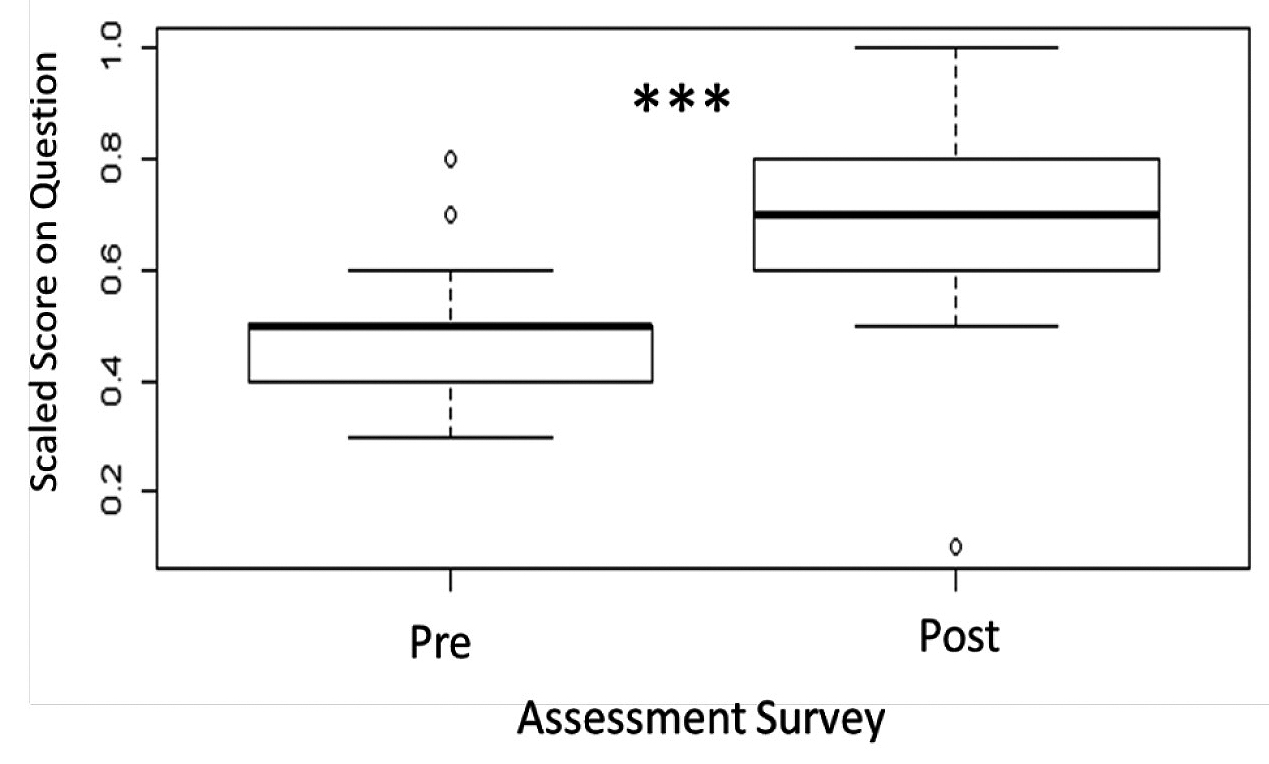
Students’ increase on pre- and postcourse assessment surveys in describing the parts of a graph.
Note. For this question, students were asked to correctly provide as many parts of a graph as they could from memory. These scores were scaled out of a possible 10 elements (all equally weighted) to arrive at a score between 0 and 1 that could be used in subsequent analyses. Box plots represent quartiles and sample medians (heavy bars). Open circles (if present) are outlying data points. Significance level of < 0.0001 denoted by ***. Mixed effects model with semester and survey as predictors, df = 0.03702, t = -5.141, ***p = 3.25e-06, N = 31.
Survey and exam findings: Demographic dependence?
Given the robustness of the findings from two forms of assessment, we decided to investigate demographic factors that may predict the most gains. For clarity and statistical power, we chose to examine whether demographic groups significantly differed in overall score on the pre-assessment and then whether that difference disappeared by the postassessment. We did not find significant differences in student performance based on gender, GPA, and credit hours taken prior to that semester (all t < 1.661, p > 0.107) but did find significant differences based on race. Students from minority backgrounds performed significantly worse at the start of the semester (Figure 3, left; linear model; t = -2.076, p = 0.0472) but made significant gains to perform equivalently to their white peers by the end of the semester (Figure 3, right; linear model; t = -0.804, p = 0.428).
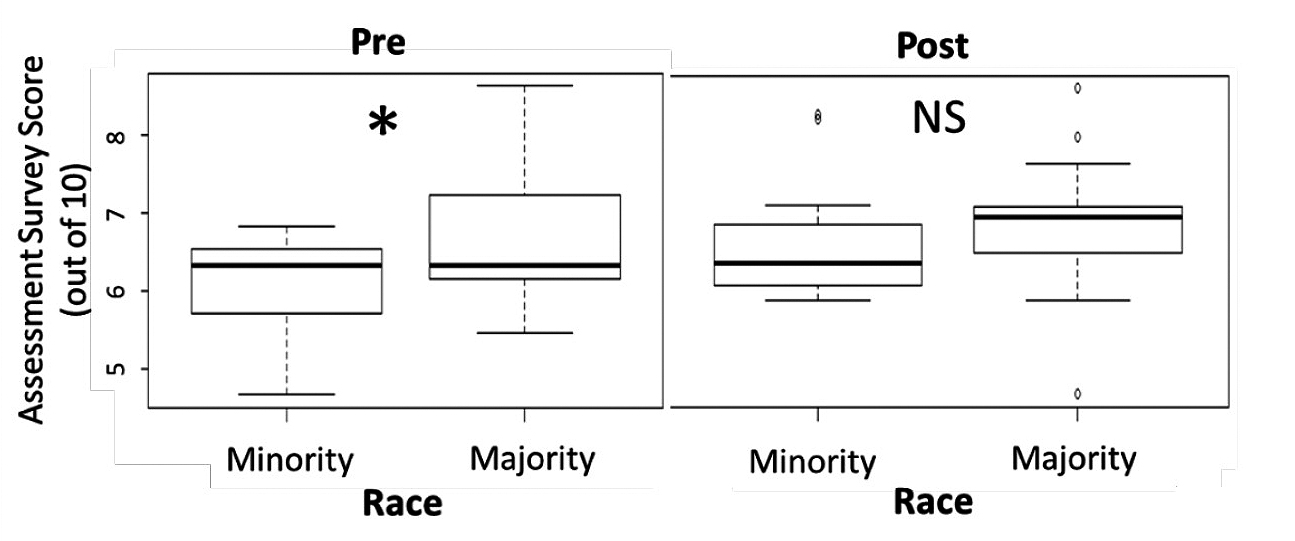
Comparison of student scores based on racial and ethnic minority background.
Note. Students from racial and ethnic minority backgrounds scored significantly lower on the presurvey (left; LM model, F = 4.309, df = 1, 28, p = 0.04721, N = 31). However, the difference (performance gap) between students from minority backgrounds and white students disappears by the postsurvey (right; LM model, F = 0.647, df = 1, 28, p = 0.4279, N = 31). Box plots represent quartiles and sample medians (heavy bars), and the open circles (if present) are outlying data points. Significance levels of < 0.05 denoted by * (left) and NS (not significant; right).
Patterns from in-class activities
To build competency with graphs in the context of biology, students were asked to complete in-class graphing assignments with the aid of graphing tools (Angra & Gardner, 2016, 2018). When graphing their own data, in both semesters, after two class sessions, approximately 35% of the students improved at choosing an appropriate graphical representation for the variables present. This is a substantial improvement from the beginning of the semester, when students incorrectly chose line graphs to imply continuity for discrete variables. Earlier in the semester, students graphed raw data on bar graphs to show individual-level changes, which were misaligned with their research question, which typically concerned data summaries (e.g., averages with standard deviation) and group-level differences.
Mechanical errors, such as omitting a descriptive title and key, were inconsistently missed among students and took multiple class sessions to correct. By the end of the semester, less than 20% of the students lost points for the aforementioned categories. Improvement in graph choice and providing conclusions from data appear to be more easily corrected than expected through exposure to multiple graph types and the development of a schema for which graph is appropriate for which variables and data types. (See Guide to Data Displays in Angra & Gardner, 2016.)
Discussion and conclusions
We sought to understand how frequent use of published graphing materials alongside active-learning instructional approaches affected students’ graph knowledge and interpretation skills over the course of the semester for a lecture course. Despite having a modest sample size, we were able to demonstrate how incorporating the graphing materials and activities into a lecture course significantly improved the way students interact with graphs. Even though we saw particularly notable improvements by students from racial and ethnic minority backgrounds and those who did not usually perform well, all students had some areas of continued difficulty.
Areas of improvement
Across the semester, we saw overall improvements in student exam scores. However, at the class level, some improvements appeared only at the end of the semester (e.g., drawing conclusions), and others showed nonsignificant but steady increases between each exam (e.g., identifying trends). Although we attribute improvements to the accumulation of practice and feedback across the semester, it is possible that more engaging topics could have increased students’ motivation to learn. The biological context for Exam 3’s graph concerned mating behavior, which may be inherently more interesting for students than opsin types influencing behavior (Exam 1) or sociality in bees (Exam 2). Practice assuredly increased student skills, but the degree of improvement was perhaps tempered midsemester, or boosted at the end of the semester, due to the examples chosen. Based on these observations, we suggest that instructors pick content that is more approachable (either through increased student interest or ease of topic) when introducing new graph types (e.g., box-and-whisker plots) in which representations of the data may be inherently challenging, independent of the graph’s underlying (biological) message.
The pre- and postsurvey assessments corroborated the exam findings, with an additional improvement not captured by the exams with regard to students’ abilities to name parts of a graph (see discussion of graph mechanics in Angra & Gardner, 2018). Explicit effort by the instructor to mention each graph element every time a new graph was presented and then align it with the graph rubric likely increased students’ awareness of the graph elements. Furthermore, when students constructed graphs, they were given the graph rubric to use to assess their own graphs and provide feedback to peers. These combined experiences likely helped students recall more parts of the graph by the end of the semester. Nonetheless, when using the graph rubric, we noticed that students gave more directed feedback on graph mechanics and communication, straying away from graph choice elements. Instructors should therefore directly stress the higher-order cognitive skills related to graph choice, data type, and alignment.
As this course emphasized higher-order cognitive skills, we acknowledge that students may need more than one semester of explicit graphing practice to achieve mastery. One suggestion is to vertically scaffold graphing throughout curricula, emphasizing basic graph mechanics skills in the lower-level courses and focusing on the higher-order cognitive skills in upper-level courses.
Connections between experimental design, statistics, and graphing
Students in our study tended to lack a basic background in inferential and descriptive statistics, which raised some cognitive discomfort because their lack of statistical understanding fundamentally affected the way they interpreted graphs. We recommend courses that are heavy in experimental design or that frequently use primary literature, require a prerequisite of basic statistics, or offer additional primers to adjust for knowledge gaps. Although this was an upper-level biology course, instructors of other levels should be encouraged to focus on and practice building students’ basic statistical skills, starting in the introductory biology courses and repeating this information throughout the curriculum to lessen these gaps.
Students found it challenging to cite specific statistical information in graphs that informed their conclusions and situate them within a broader biological context. This reveals that despite discussing experiments from primary literature, students either did not read or did not understand the application of statistics to the experiments presented and how the findings from these graphs could be generalized. In our context of a course primarily taken by upper-division students, it was assumed that students should have had practice reading and discussing primary literature and connecting basic statistics to the experiments reported. However, it appears instructors need to offer repeated practice in forming explicit connections between experimental design and graph choice. At least initially, graph choice for students appears to arise from the data type and preconceptions of how those data are typically displayed, instead of related to the experimental design and the literature to which the study contributes. Instructors may need to clearly state how a given example informs what is generally known about a phenomenon. In short, the richness of information contained in a graph regarding experimental design, numerical evidence, and rationale needs to be made explicit alongside interpreting the take-home message.
The students in our study mastered naming variables, yet they struggled with articulating the experimental relationship depicted in graphs. Students’ ability to name but inability to connect dependent and independent variables suggests that there is additional thinking required to transition from the mechanics of a graph to its experimental meaning. We therefore suggest that instructors go beyond asking students to identify the axes and include experimentation as a natural part of data visualization conversations.
As the curriculum shaping student performance is determined by instructors, instructors have actionable areas in which we can improve. Giving our students better scaffolds and practice interpreting the directionality of the graph can improve their understanding of the biological content. Because students were given a novel graph on each exam that related to content discussed in the course, it is not likely that familiarity with behavioral concepts was the issue, but rather that students were unable to connect the content across representations. This, in many cases, points to an underlying issue in the way students relate variables causally. For instance, in an evolutionary sense, the causal relationship that a bird sings to get mates is very different than a bird who has mates and sings, but students are not connecting their biological knowledge to representations when presented with a graph. Students often treat data displays as disjointed pictures of an experiment rather than a condensed display of data that connects a larger framework. Although correcting this limited thinking is likely to require interventions across several courses, it would behoove instructors to explicitly confirm and reaffirm biological content relationships with students prior to and alongside showing them those same relationships in graphs. Moreover, greater exposure to various types of experimental designs and data types, such as those that include transformed data, may relieve students’ cognitive discomfort by allowing them the opportunity to think through the biological concept being described while considering the graph choices made to display findings.
Practicing science process skills such as graphing and statistics in lecture makes for an engaging learning experience that taps into students’ curiosity while encouraging independent and thoughtful development of these process skills (Roth & Roychoudhury, 1993). The use of the graphing tools in an active lecture context has proved beneficial for all students and has demonstrably removed a knowledge gap between students from different racial and ethnic backgrounds in the classroom. As past work has demonstrated (Theobald et al., 2020; see references therein), active learning narrows STEM achievement gaps for students from racial and ethnic minority backgrounds, and in this article, we provide yet another approach to increase student skills and improve equity in the teaching and learning of science. Thus, instructors can adopt this approach to not only engage students but also improve the ways their students conceptualize graphs.
Acknowledgements
We are very thankful to the members of the Science Education Research Journal Club for their feedback on earlier drafts of this manuscript. We also thank the School of Biological Sciences at the Georgia Institute of Technology for supporting our work.
Emily G. Weigel (emily.weigel@biosci.gatech.edu) is a senior academic professional in the School of Biological Sciences at the Georgia Institute of Technology in Atlanta, Georgia, and Aakanksha Angra is an instructional design and curriculum specialist at the University of Minnesota Medical School in Minneapolis, Minnesota.
Biology Instructional Materials Literacy Teacher Preparation Teaching Strategies Postsecondary