
High School | Daily Do
Why doesn't the snow melt?
Crosscutting Concepts Is Lesson Plan NGSS Phenomena Physical Science Science and Engineering Practices Three-Dimensional Learning High School Grades 9-12
Sensemaking Checklist


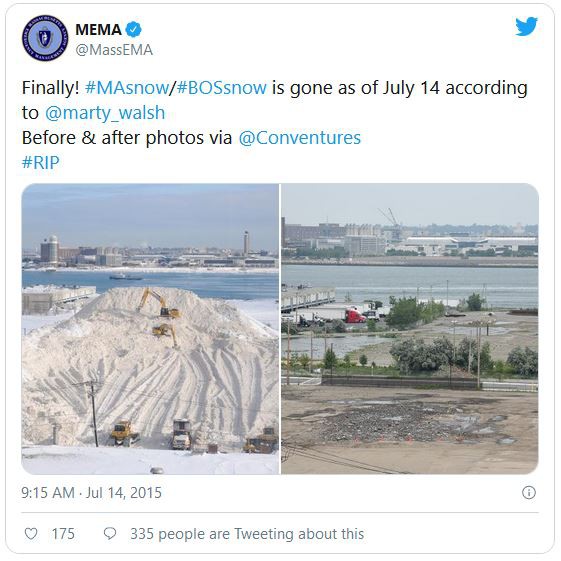
Boston, MA, received a record-setting 108.6 inches of snow during the winter of 2014-15. The last snowflake fell in mid-March; four months later, the last pile of snow finally melted. The tweet on the right shows snow being piled high on February 16, 2020, and the watery remains of that pile on July 14, 2020.
In today's Daily Do, Why doesn't the snow melt?, students experience the phenomenon of a snow pile that doesn't melt through the lens of energy and matter (crosscutting concept) and engage in science and engineering practices to try to explain why water remains a solid even when temperatures soar well-above freezing.
Student questions about this phenomenon will likely create in them a need to engage in the Why does ice melt without getting hotter? Daily Do.
Daily Do Playlist: State Changes in Water
Why doesn't the snow melt? is a stand-alone task. However it can be taught as part of an instructional sequence in which students coherently build science ideas about water's ability to absorb, store and release large amounts of energy.
Experience the Phenomenon
Tell students you have an intriguing phenomenon to share! First, inform them that during the 2014–15 winter season, Boston, MA, had a record-breaking total snowfall of 108.6 inches. The last day snow fell that year was March 15, 2015.
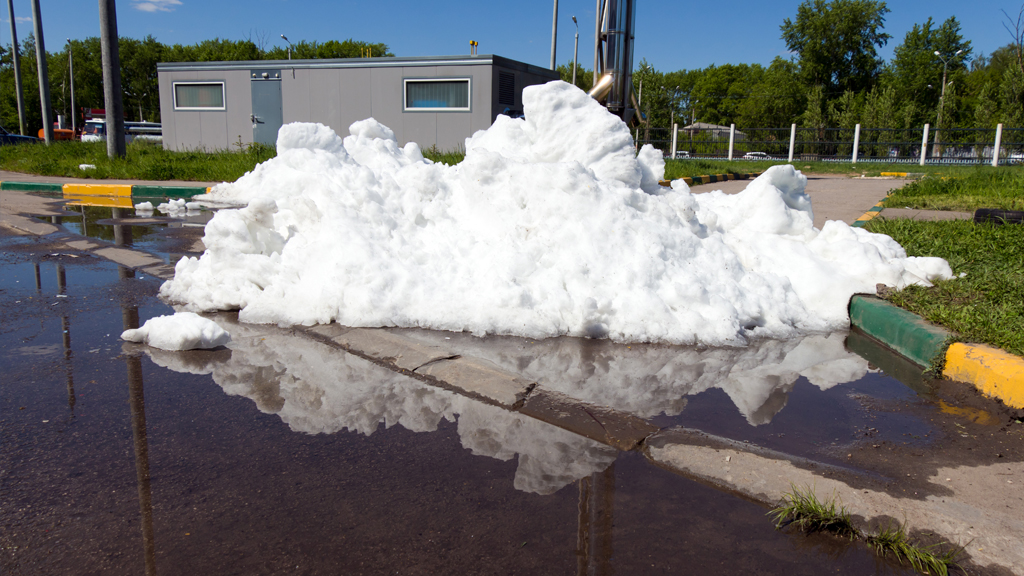
Next, share the Boston Snow Farm melt, March 27 - July 6, 2015 video with students. Ask students to create an "I see - I think - I wonder" table in their science notebook. Give them time to independently make and record observations (I see) and inferences (I think) as well as note questions that pop up while they are studying the photograph (I wonder). Students will likely be excited to share their thinking, but ask them to hold their ideas until after they observe the snow pile over time.
Place students in small groups and ask them to share their observations with each other. Consider asking students to place a check mark next to the observations they have in common with their group members and circle observations only they (or only one other group member) noticed. Ask each group to choose two common observations and one less common observation to share with the class. Create a class list of observations.
Ask students to review their inferences. Based on the class list of observations, would they revise or remove any of the inferences they made about the snow pile over time? Give students independent thinking time and then ask them to share with a partner an inference they revised or removed and why they made the change. Listen for students to share inferences/ideas about the (air) temperature being "cold" or "colder than normal" between March, 2015 and July, 2015.
Say to students, "Many of us are wondering if it was cold in Boston, MA, between March and July, 2015. Does it make sense to look at temperature data for these months before we go any further trying to explain our observations of the snow pile over time?"
Analyze Historical Weather Data for Boston, MA
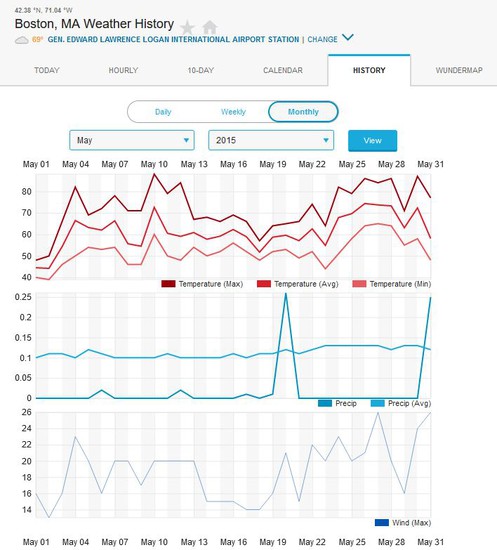
Share historical air temperature data for Boston, MA, between April 2015 and June 2015 with students or task them to find air temperature data for this period on their own. (The linked weather data includes air temperature, precipitation, and wind speed; you might want students to consider all three data sets since they all contribute to the rate at which the snow pile melts.) Ask students to independently make and record observations of the data presented in the temperature, precipitation, and wind speed graphs. Then, ask students to work with their group to identify patterns in each data set and between data sets.
Bring the class back together and ask each group to share one pattern they identified. (Complete as many rounds of sharing as needed to capture all of the patterns identified.) Create a class record of the patterns observed. Students will likely identify the following patterns:
- Daily high temperatures between April and June were almost all above 50 degrees F
- Daily low temperatures between April and June were all above freezing (32 degrees F) after April 2
- Daily average temperatures between April and June were all above freezing
- May and June had about the same number of days with air temperatures in the 80's (degrees F)
- May had the hottest temperatures
- April, May and June had about the same number of rainy days, but more rain fell on those days in April and June
- The lowest max wind speed and highest max wind speed were about the same for all three months
- The average max wind speed was almost the same for all three months
Consider showing the Boston Snow Farm melt, March 27 - July 6, 2015 video again. Do students notice any patterns between the weather data and changes in the snow pile over the same time period?
Ask students to revisit their inferences a second time. Based on the patterns in data the class identified, would they revise or remove any of the inferences they made about the snow pile over time? Give students independent thinking time and then ask them to share with a partner an inference they revised or removed and why they made the change.
Create a Class Consensus Model
Place students in small groups of no more than four students (these can be the same or different groups). Ask them to create a group model to explain why it took four months for the Boston, MA, snow pile to disappear. Encourage students to use the class observations of the snow pile over time and patterns in the weather data, as well as their individual inferences, to support their ideas. As you move around the room, you might ask the groups questions to move their thinking deeper without leading them. Examples of questions include:
- What are the components of the system? (What are the parts of the system?)
- How are the components interacting? How might you represent the interaction between A and B in words? Using pictures and symbols?
- What are the boundaries of the system?
- What energy is entering, staying, and leaving the system?
- What forms of energy are involved in this system?
- What happens to matter as it moves within/leaves this system?
As you move around the room, note group models that focus on the changes in state of water/follows a "drop" of water from snow in pile to gas in air; models that focus on the interaction of sunlight with the snow pile (reflection, absorption, transmittance); and models that focus on energy transfer and transformations. Instead of asking for groups to volunteer to share their models, consider selecting groups representing these different focuses.
Choose a group to share their model with the class. Ask students to look at their own group model and the one that was just presented to find similarities and differences between them. Ask the groups to share similarities and begin to develop a class consensus model to explain why it took four months for the snow pile in Boston, MA, to disappear. Ask students to share differences they noticed. Do the difference identify places where we disagree or are groups representing the same ideas but in different ways? How should we represent places where we disagree on the class consensus model?
Invite the next group to share. Again ask students to compare their own group model with the one presented and identify similarities and difference. Use the students noticing to add to and/or revise the class consensus model. Continue in this way until all of the groups you selected to present their models to the class have shared.
You might ask the presenting groups to post their models (in the classroom or virtual space) and then ask the remaining groups to post their models nearest the presented model most similar to their own.
Ask students to review the questions they recorded in their I see - I think - I wonder table and identify questions they are now able to answer. Encourage students to record any new questions they have about the phenomenon of the snow pile taking four months to disappear.
Brainstorm Related Phenomenon and Ask Questions
You might ask students to individually brainstorm and record related phenomena. Then ask students to share their related phenomena with a partner before sharing them with the class. Consider creating a class list of related phenomena which might include:
- ice cubes shrinking in the freezer
- ocean water staying cold in the summer (and staying warm in the fall)
- snow piles next to sidewalks or driveways lasting longer than the snow "blanketing" the ground
- when food defrosts sometimes it is still frozen the middle when you think it has finished thawing
Say to students, "Between our inferences from observations and related phenomena, there are a lot of questions we could investigate that would help us figure out parts of our model to explain why the snow pile in Boston, MA, took four months to disappear." Ask students to choose one question the class could investigate to figure out more about what's happening in the snow pile and the related phenomena the class has brainstormed so far.
Create a space in the classroom or digital space for students to post their questions. You might have student read and post their questions one at time, adding to existing "categories" of questions or starting new ones, as appropriate. If working in a digital space, students might post their questions all at once and then work together to sort the questions into categories. Student questions will likely include:
- Would the snow pile melt faster or slower if it wasn't covered in dirt/trash?
- Would the snow melt faster if it was flattened out (not in a pile)?
- Why didn't all the snow melt as soon as the temperature was above freezing?
- Why doesn't the snow pile melt into a big puddle of water? (Where did the water from the snow pile go?)
- Would you feel cold if you were standing near the snow pile (on a hot day)?
- Would you notice the air was humid (feel "wetter") if you stood next to the snow pile?
- Did the snow go from a solid to a gas? (Did the snow evaporate?/How does snow evaporate?)
- Why does (ocean) water take so long to get warm (stay cold so long)?
Navigating to the Next Lesson
You might say to students, "Many of us are wondering how any water can remain a solid (snow) when the temperature is above freezing. Should we investigate this question first?" Navigate students to the Why does ice melt without getting hotter? Daily Do.
Depending on the grade you teach, you might instead choose to pursue questions that create opportunities for your students to make sense of science ideas about the water cycle and/or how light interacts with objects.