
Teaching Teachers
Learning to Teach with Science Representations
Meaningfully connecting the three dimensions of science
Science and Children—January/February 2023 (Volume 60, Issue 3)
By Meredith Park Rogers, Cindy Hmelo-Silver, Celeste Nicholas, Dionne Cross Francis, and Joshua Danish
However, representational practices may be challenging for learners, including teachers as learners. For example, a drawing that closely resembles an object may be easy to understand, whereas a more abstract representation such as a graph or equation might be more difficult (Gilbert 2008). Therefore, to support learners in using representations, teachers need to consider what concepts students will learn and what activities students will do when choosing representations to support learning science. In this article we describe a project we are working on to address these needs.
In our professional development (PD) work with teachers, we foreground the science phenomena and then consider appropriate representational forms and learning activities to support the learning of this phenomenon. This approach keeps the focus on the science content and offers flexibility in bringing together various representations that can help explain underlying processes and mechanisms. Additionally, this flexibility affords learners the opportunity to create, share, revise, critique, and further revise representations to illustrate potential patterns in their explanation of the phenomenon, cause and effect relationships, scale or proportion, and so on.
Harnessing the power of representations as a means of exploring ideas in science helps support students in three-dimensional learning. We share our PD approach to illustrate how we assist elementary teachers in learning to integrate the three dimensions of science learning (science and engineering practices [SEP], disciplinary core ideas [DCI], and crosscutting concepts [CC]) through use of representations. We explain how the teachers first experience learning science in this way for themselves followed by how they learn to teach science using representations. We conclude with a set of recommendations for further use of representations across a range of elementary science topics.
Designing PD with a Focus on Representations
The Representations for Teachers as Learners (RepTaL) Project is a multi-year PD and research project aimed at supporting elementary classroom teachers with incorporating representations in their science teaching. To achieve this goal, we are working with cohorts of teachers to iteratively explore new ideas from the cognitive and learning sciences, introduce those ideas in their own classrooms, document their teaching practices, reflect upon their practices, and develop new practices. Employing an iterative PD model (see Figure 1), we provide teachers with two essential learning experiences continuously throughout a year.
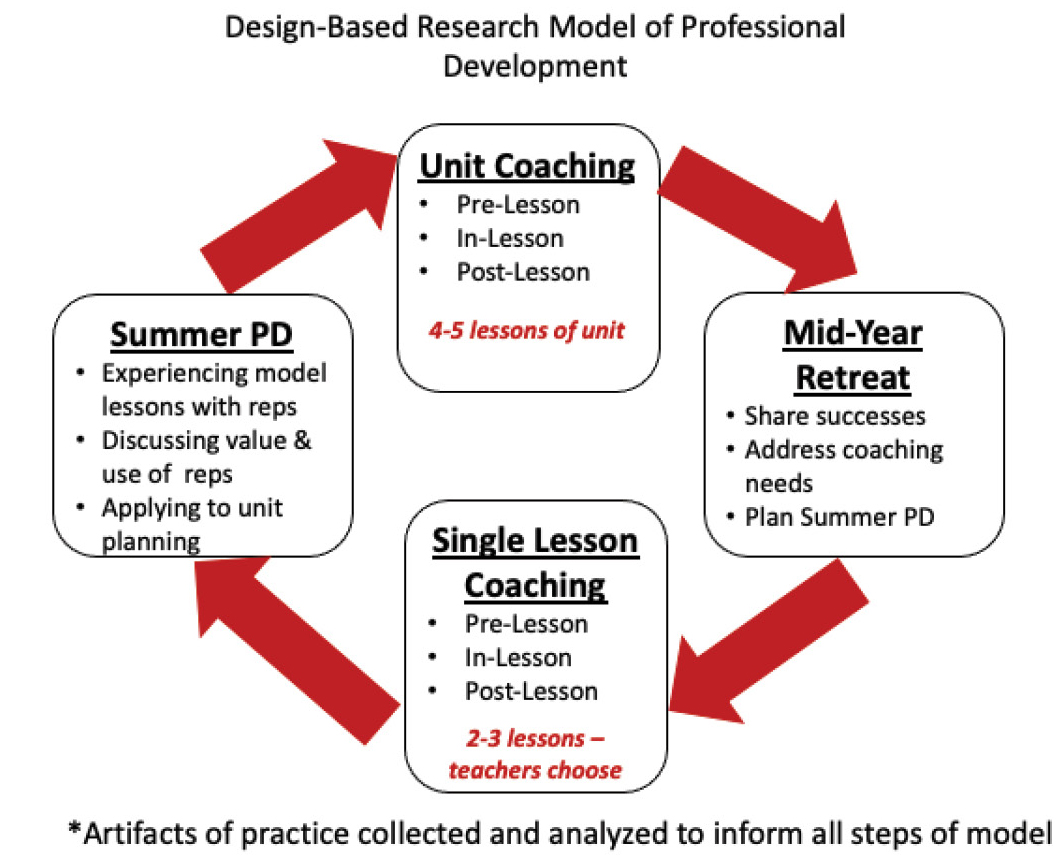
PD model for RepTaL Project supporting teacher learning and teachers’ learning to teach.
PD Workshops: Supporting teachers’ own learning by engaging with and reflecting on what representations are and exploring their uses in learning disciplinary core ideas, practices, and crosscutting concepts in science.
School Year Coaching: During this phase, we employ a Holistic Individual Coaching (HIC) model (Cross Francis 2019); wherein a project team member works one-on-one with a teacher to support their planning (pre-lesson), teaching (in-lesson), and reflection on their practice (post-lesson).
With both essential elements, teachers are consistently engaged in learning and reflecting on what science phenomenon students need to learn, what representational forms might best suit explaining the phenomenon, and what sorts of activities can support students with engaging with the representation to (a) learn the DCI the phenomenon is situated in, (b) the SEPs associated with inquiring about the phenomenon, and (c) the CCs relevant to understanding the underlying mechanisms of the phenomenon.
Teachers’ Learning About Representations
We began our work with the teachers by engaging them in a multi-day activity called “Life in a Square” (see Park Rogers and Steele 2014 for details), involving exploration of one-meter square plots of land. The DCI focused on studying ecosystems. For the elementary grades, this topic relates to the broader topic of Interdependent Relationships in Ecosystems (LS2A) and Ecosystems Dynamics, Functioning, and Resilience (LS2C). Additionally, depending on what is in the plot of land chosen, there is the potential for interdisciplinary connections to Earth Science DCIs The Role of Water in Earth’s Surface Processes (ESS2C) and Weather and Climate (ESS2D). From a teacher learning standpoint, the focus of the activity was to engage the teachers in the practice of gathering data about their square over several days.
The teachers needed to collect data from their squares and represent the data in ways that would help to illustrate to others how they were changing over time. Figure 2 illustrates examples of some of the ways the teachers chose to represent their data. Within these examples are representation forms referred to as: physical materials (samples), mathematical (grid, pie chart), drawings (with zoom in features), and lists (tallying items).
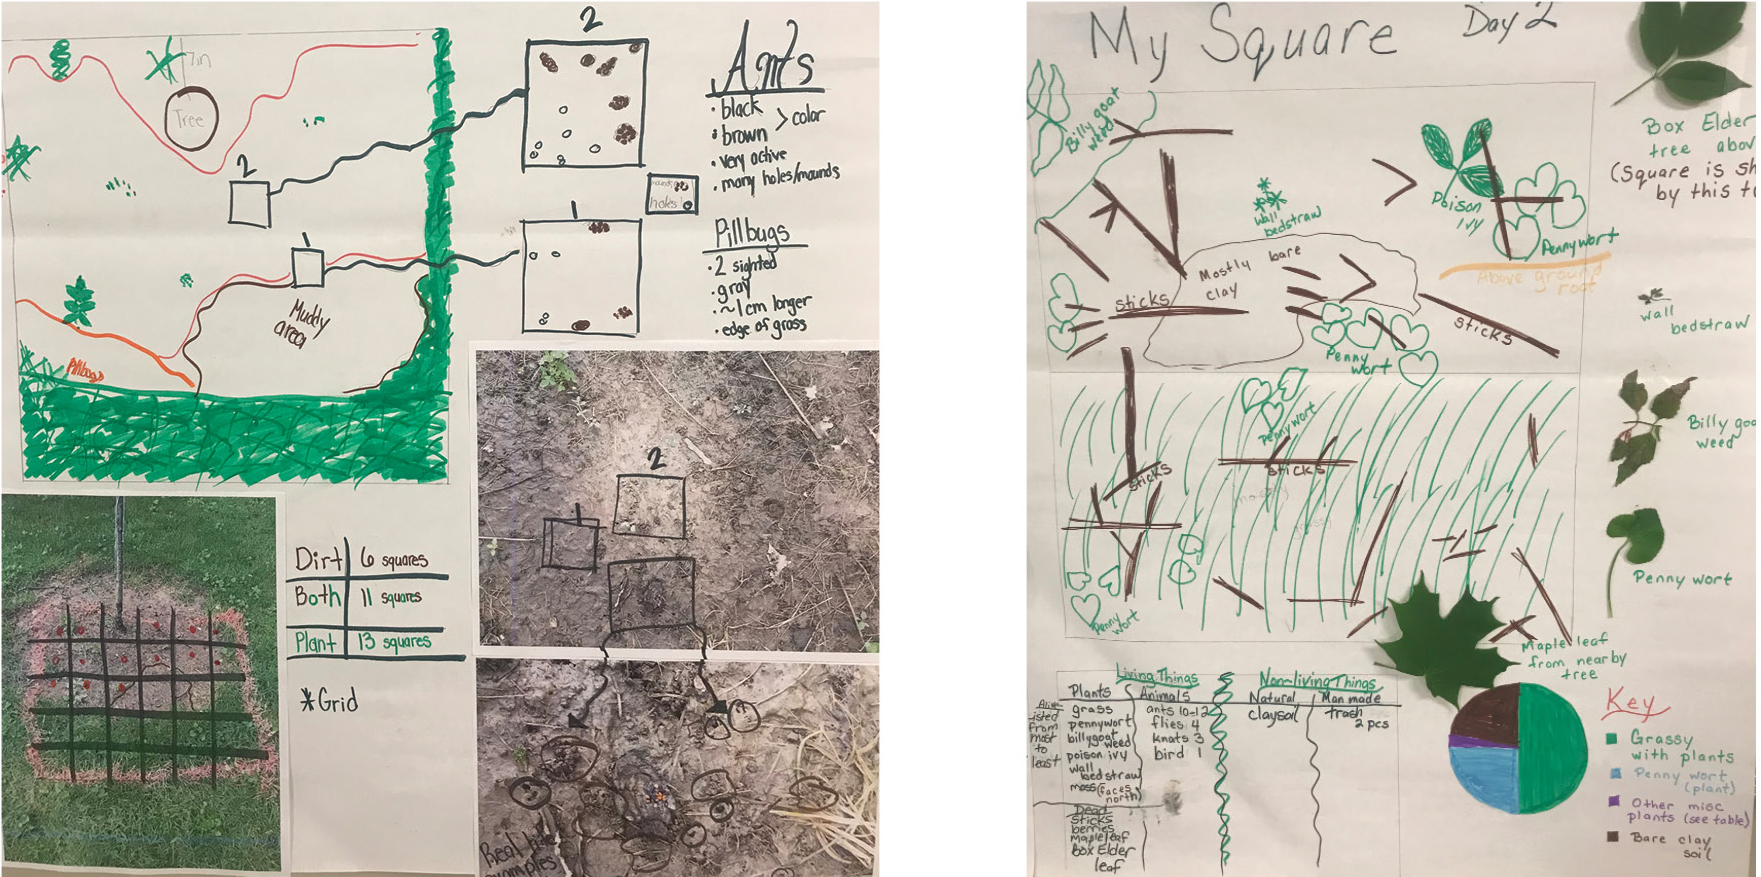
Examples of different representation forms teachers used to show what was in their ecosystem.
Figure 3 demonstrates how a teacher grew in her use of representations after discussing a range of representational forms and their purposes in the PD, as well as trying some of these out with different science activities focused on other disciplinary core ideas. In the beginning, this teacher included drawings and photos mainly, as well as samples of a few dominant materials found in her square. An important difference between the two pictures is how the teacher moved away from simply using representations to talk about the content of the square but challenged herself to include representations that would provide a viewer an understanding of some differences in content and classification of content within her square. This shows growth from using representations as a means of description to a means of analysis. Specifically, this shift in representational forms integrates the DCI of ecosystem dynamics along with the SEPs of using models, mathematics, analyzing and interpreting, and communicating. Additionally, the inclusion of the graph-based representations affords the teacher an understanding of the CC of scale, proportion, and quantity, and if she were to collect data a third time on her square, a point of comparison for understanding stability and change. Online, we have shared a table (see Supplemental Resources) summarizing how participating teachers shifted their representational practices with respect to SEPs and CCs over the course of the PD sessions. Across the five-day Life in a Square activity, the teachers’ selections of representational forms and activities became more complex, resulting in opportunities for connecting more deeply with a range of SEPs and CCs.
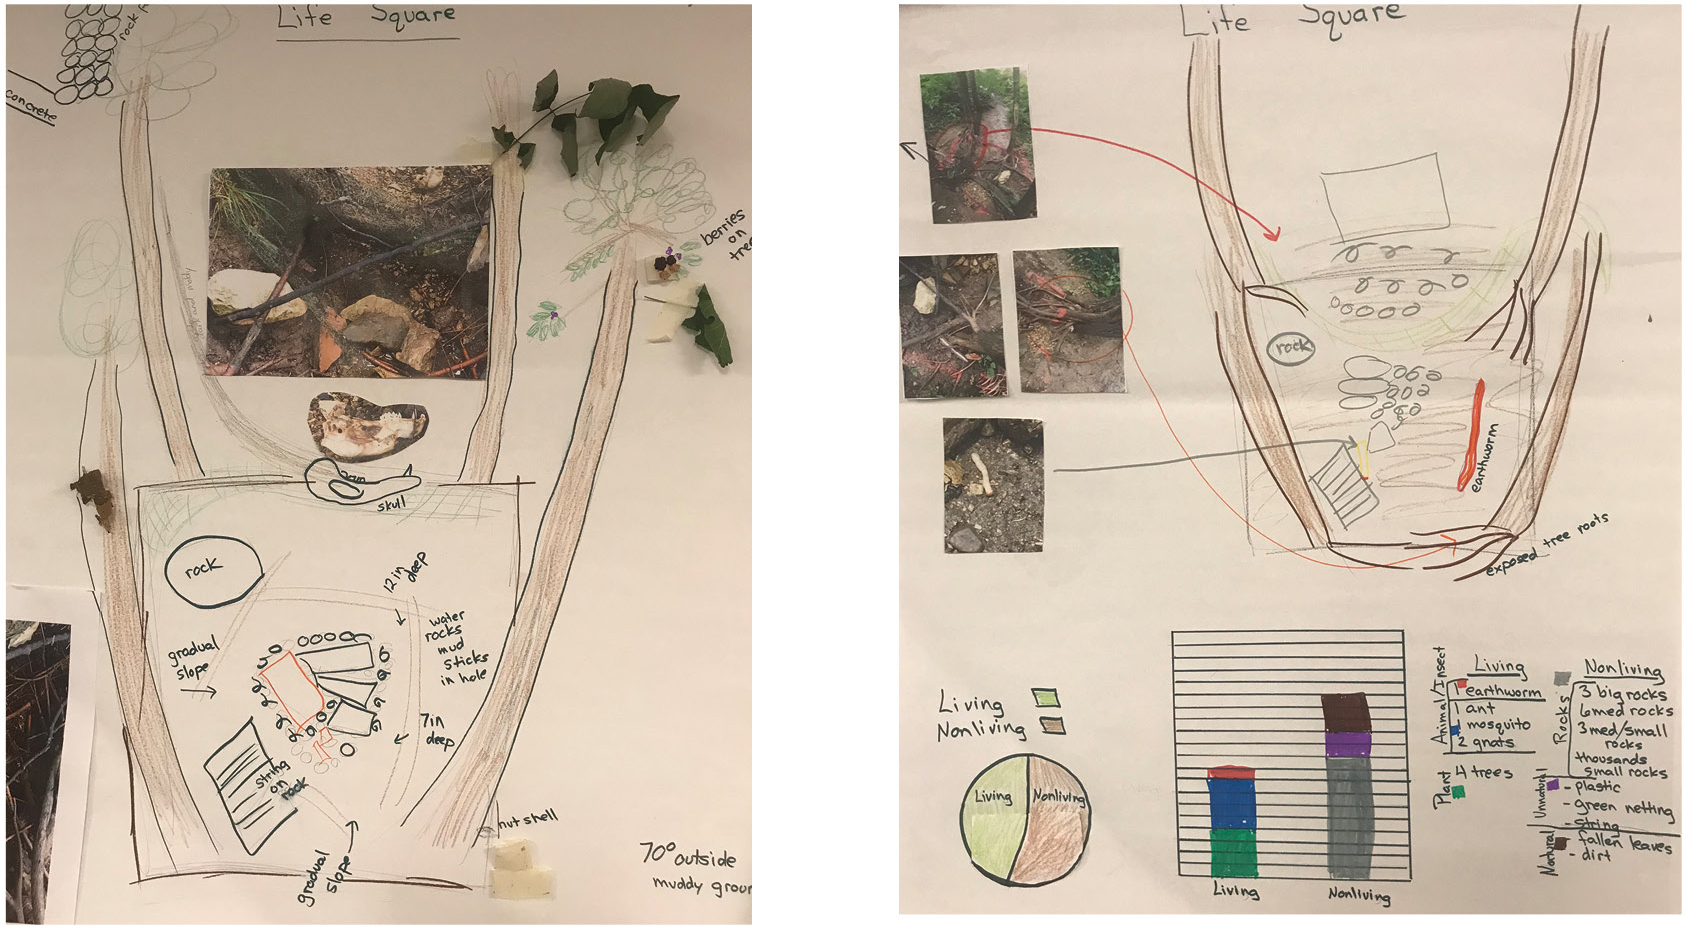
One teacher’s set of representations of what she observed in her ecosystem over time.
Learning to Teach with Representations
During the summer school PD, teachers were given time to work with their coach to draft a science unit that would incorporate representations. Implementing this unit was the central focus of the teacher and coach relationship as part of the HIC model employed by the project as a means of providing continuous teacher support (Cross Francis 2019). Typically, three to five lessons from the unit were selected by the teacher to focus the coaching sessions. In the pre-lesson conversation, the focus is on selecting representations that align with the aspect of the DCI the teacher is trying to address in the lesson (i.e., learning objective).
From our first year of working with the teachers, we learned the coaching conversations required more than just a discussion about selecting representations—explicit deeper pedagogical discussion was needed as well. One aspect of the conversation focused on how certain representations would support three-dimensional learning and perhaps how others would not. For example, what were the students expected to show about their understanding of the phenomenon through the representation, what learning activity should they be engaged with to show this, and what scaffolds should the teacher provide to support the learning activity?
In other words, simply engaging in these same learning experiences with representations as students was not sufficient to transform teacher practice. Rather, moving into the coaching component of the PD, it was evident the teachers needed support in transforming their learning of what representations in science are to how to teach others what representations are and how to use them for learning science. This process of learning something for one’s own understanding to learning how to teach the ideas to others is a complex skill that teachers struggle with every day. This became much of the focus then of our coaching cycles throughout the year, and from this work the decision-making process illustrated in Figure 4 was developed.
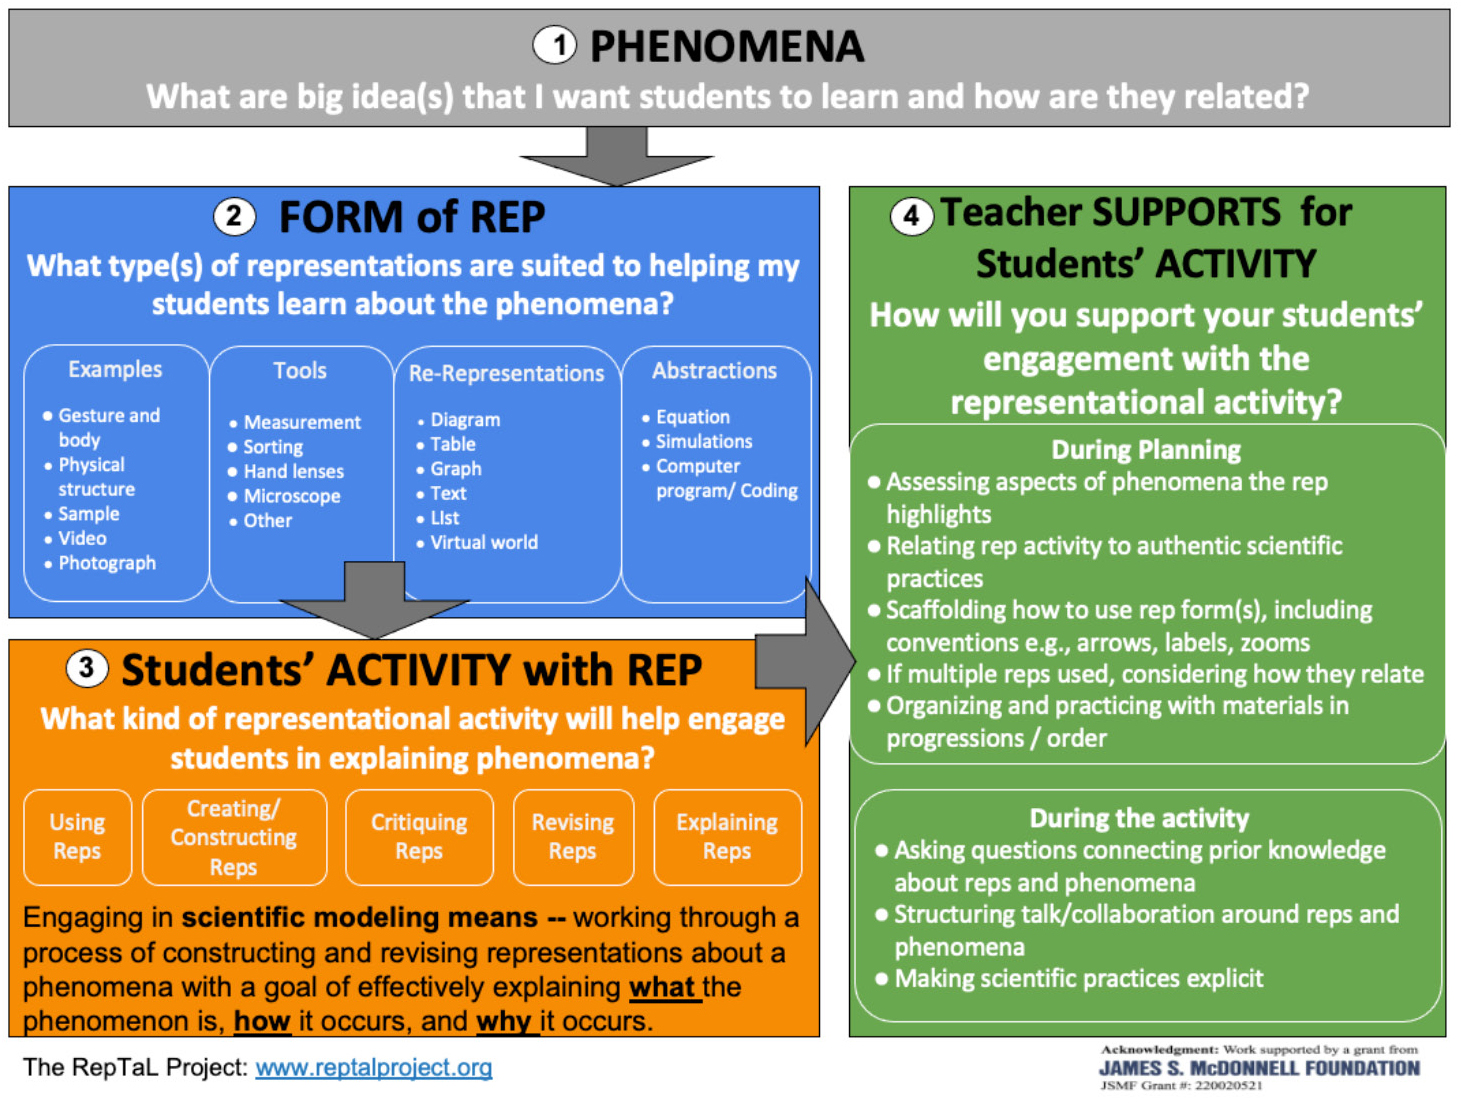
Teaching science through representations to promote three-dimensional science learning.
In Table 1 we provide an overview of two teachers and how they incorporated the four aspects described in Figure 4 and the aspects of three-dimensional learning into their units on properties of matter and Earth processes. The teachers began with first identifying the phenomenon they wanted their students to learn about. This phenomenon addressed the DCI targeted by the state science standards. After identifying the phenomenon that would anchor their unit, they began to select potential representations that could be used at different times throughout the unit to help students to construct an explanation about the phenomenon near the end. Identifying the representations ensured the teachers were giving students multiple ways of working with materials to have evidence they could use in creating those representations. This also helped facilitate students showing their overall thinking about explaining the phenomenon.
Conclusion
The inclusion of multiple representations afforded the teachers’ students the opportunity to engage in multiple SEPs as well as develop knowledge of CCCs. The continued instructional support of the coach throughout the unit helped to ensure that the representations selected for each lesson both supported three-dimensional learning and were appropriately sequenced to answer the guiding phenomenon question. Additionally, the post-teaching reflective component of the coaching experience supported teachers with learning how to scaffold their students’ learning with the representations toward these goals. Thus, the three parts of the coaching cycle were integral to the teachers learning to teach science with representations.
We recommend the following to others working with elementary teachers (at all levels) to assist with meaningfully connecting the three-dimensions of science learning using representations as a modeling practice of science.
- Provide teachers with opportunities to learn what representations are and how to use them in explaining science phenomenon.
- Make the connections among the three-dimensions of learning and the purpose of representations in bridging these connections explicit.
- Support teachers with how to pedagogically transform what they have learned into their work with teaching students. We have found incorporating the components in Figure 4, not only into lesson planning but also reflecting on teaching, can support teachers with this transformation.
Furthermore, we offer Table 2 as a starting point for considering how various representational forms could be incorporated with other science topics as part of a science methods course or professional development program. Additionally, supports for using the planning structure of Figure 4 can be found online (see Supplemental Resources). These resources take sections 2–4 of the planning structure illustrated in Figure 4 and provide details on how learning can be supporting using these methods, as well as questions for teachers to consider when planning for using representations to support three-dimensional science learning.
Acknowledgment
The work of RepTaL Project is supported by grant # 220020521 from the James S. McDonnell Foundation.
Supplemental Resources
Download the table aligning life square phenomenon, representational forms, and learning activities with SEPs and CCCs dimensions and the resource expanding on Figure 4 at https://bit.ly/3YlWQsG.
Meredith Park Rogers (mparkrog@indiana.edu) is an associate professor of science education, and Cindy Hmelo-Silver (chmelosi@indiana.edu) is a distinguished professor of learning sciences, both at Indiana University in Bloomington, Indiana. Celeste Nicholas (celrnich@iu.edu) is a research data analyst in the School of Public Health at Indiana University-Purdue University Indianapolis, Indiana. Dionne Cross Francis (dicross@unc.edu) is the Joseph R. Neikirk Term Professor in Mathematics Education at University of North Carolina in Chapel Hill, North Carolina. Joshua Danish (jdanish@indiana.edu) is a professor of learning sciences at Indiana University.
Crosscutting Concepts Disciplinary Core Ideas NGSS Performance Expectations Professional Learning Science and Engineering Practices Three-Dimensional Learning Elementary