
cross-curricular connections
Combining the Old With the New
Using a historical text and a citizen science app to engage student learning
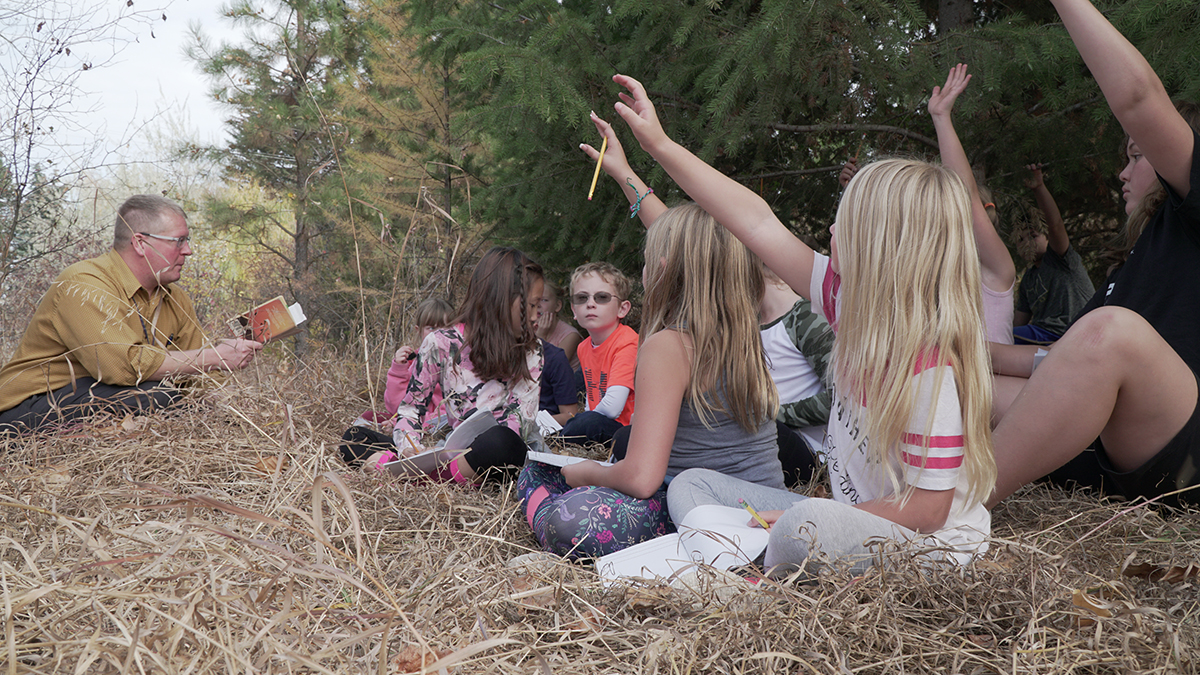
Students share observations during an outdoor reading session.
Teachers never have time to do it all, and curriculum integration too often means a one-time experience. To address this, we will discuss a cross-curricular approach that integrates science, art, math, and language arts throughout the school year and across the seasons. A historical text and an app-based tool are combined as resources to successfully integrate content. In reading Aldo Leopold’s A Sand County Almanac (1949; SCA) throughout the year and using the online citizen science app Project Budburst (PB) (budburst.org) at carefully designed intervals, fourth graders are immersed in genuine applications of reading, writing, math, and art within a science context.
This project builds wonder and curiosity without easy answers. SCA’s implementation is flexible from year to year, highlighting climate, geography, and interests of both students and teacher, through observations made each month. Each season is appreciated, even the cold and wet ones, through experience. As we listen to Leopold, the fine details he describes often pique students’ interest. Adding PB brings the historical context into modern focus, specifically related to phenology (seasonal change in plants). In this article we present our approach that uses crosscutting concepts with SCA and PB in concert to engage student learning.
A Historical Text: A Sand County Almanac
Leopold learned through careful observation and contemplation and recorded his efforts so others may learn from his experiences (Leopold 1949). SCA is a very accessible 95-page treatise that creates vast opportunities to engage students in observing the natural world more closely. Leopold’s observations, arranged by month in his book, are used to help us understand natural phenomena as well as human interactions with, and influence upon, our world. Leopold demonstrates that observation is the root of all good science and the basis for creating new understanding. Our initial ideas, like his, won’t always be right, but we continue learning from what we first misunderstand.
Each month, a chapter of SCA is read that correlates with our current month. All reading is done outside, allowing students to experience seasonal sights, smells, and sounds inherent to our location. Due to the reading level, vocabulary, and figurative language of the text, SCA is used as a guided read-aloud while students discuss, take notes, and draw observations. Student nonfiction reading occurs in more depth during the scheduled classroom reading times on a weekly basis.
Students compare and contrast our home environment to Leopold’s. We live on the boundary between forests and large-scale wheat farms. The latitude is roughly that of Leopold’s in Wisconsin, though the continental climate is less prevalent here. The impacts of longitude and especially latitude can be accounted for and the discussion adjusted as needed to highlight the causes of similarities and differences with any location. Through this process of connecting our observations to those of Leopold, a measure of validity is given to students’ sense of wonder about little things and their observations become more acute.
Observation
Lessons initially focus heavily on observation. A short but powerful immersion activity helps students focus on sensory processing of information. As a five-minute “brain break,” students sit outside silently for four minutes with eyes shut, taking in all the information they can. They open their eyes for the last minute before journaling sensory observations. Students are amazed at how long four minutes without sight seems and how powerful senses other than sight can be. Regular repetition of this activity builds a sense of continuity and reflection. Student observations are edited as we discuss what makes a solid observation. Something as general as “August is hot” is a start, but it can soon be refined to a temperature range as specificity improves. We create a Venn diagram (see Figure 1) comparing our observations to those of Leopold each month. We include timeless human activities like hunting, planting, and harvesting but leave out modern cultural phenomena specific to the United States through children’s eyes, such as football season or spring break.

As with any field trip or experience beyond the classroom, parents should be notified ahead of time to aid in clothing choices. Many schools keep a few extra coats/gloves/even shoes in the office to help students in need of appropriate clothing. Keeping a few blankets or material handy to spread over wet benches before students sit makes the rest of the day more pleasant for all. Before going outside, notify the office and have a way to communicate with them (cell phone or walkie-talkie). Be sure to bring student medications such as inhalers and epi-pens as applicable. Advise students to use caution regarding plant defenses (i.e., thorns, irritants) they may encounter. Sticks, cones, and rocks (even snow) should be left on the ground unless students are asked to inspect them. Move slowly and quietly, and most importantly, respectfully, while observing the surroundings. The outdoor classroom is treated as any classroom. Before exiting the building, students recite the phrase, “This is not recess, I am going outside to enhance my learning.” Students with mobility issues can be included with assistance from other students, paraprofessionals, or the teacher as needed. If participation proves unrealistic for some students, information from outside can be digitally brought inside through recordings on iPads or cell phones. Artifacts may also be brought inside for tactile learning, but should be returned to the natural environment upon completion of the study.
In Practice
A day typical of the month is chosen for the read-aloud, usually a half hour session. While reading and highlighting the natural attributes Leopold described, students adjust and add to their Venn diagrams to reflect what they learn about Leopold’s home, as well as new thoughts about their home, spurred on by comparing and contrasting. Interruptions are encouraged when something intriguing is observable. For example, we frequently see a hawk hunting, a woodpecker excavating our gym wall, or a thermal wind carrying leaves in a spiral. Students stop the reading to call attention to such activities. Other wild visitors (e.g., deer, rabbits, insects, many songbirds, and seeds floating on the wind) add to our observations. The increased excitement of being outside and looking for interactions builds student interest and encourages questions that can be tied back to our vegetation and the phenological changes taking place. Students are encouraged to document factors they believe are relevant, which may later become testable questions. For example, a student asked about leaves, which were all green recently, being different colors in autumn. This led to questions about photosynthesis, chlorophyll, and tests with chromatography paper. Though the historical text is engaging, students also crave modernity and technology in their learning.
Citizen Science: Project Budburst
PB is a national network of citizen scientists monitoring seasonal changes in plants (phenology) with a long-term goal of understanding cycles and change. While Leopold theorizes and drifts in his essays, the PB protocols give validity and an anchor for students as well as a specific set of criteria to evaluate.
Students get excited about citizen science, using technology, and sharing data with the world. We focus on deciduous trees and shrubs as they demonstrate clear, phenological changes and are relatively easy to identify. In conjunction with our exploration of SCA, each student has a chosen plant that becomes the subject of their data collection for PB. Once the initial protocols are explained to students, the time commitment is minimal, for example, small student groups draw upon estimation skills learned in math to evaluate whether a tree has 50% yellowing of its leaves in autumn or 90% unfolding of its leaves in spring. These observations can be done in under five minutes. The many associated skills, which are used across much of the prescribed curricula, are put in a new and interesting context. This is how curricula become more streamlined and focused, efficient and relevant to student outcomes.
Integration Through the Day
Incorporating integrated curricula into a structured day can be challenging. Just as Leopold wove common themes through his chapters representing different months and varying seasons, we weave SCA and PB throughout the different subjects of the school day and build skills throughout the year.
Scheduled time for in-class reading creates the first bridge with the read-aloud outside. SCA leads easily into contextualized lessons on nonfiction reading, literary elements, figurative language, and expository writing. Students are guided gradually toward an understanding of Leopold’s land ethic as the central theme through the monthly vignettes and reflection upon the year’s progression. As prescribed curricula (my district uses McGraw-Hill) allows for connections to the real world and other texts, students are referred back to our SCA experience. Nonfiction reading time furthers goals of working with Latin root words, vocabulary, and comprehension, which have direct science applications. PB data sheets require students to demonstrate understanding of specific terms in the choices they make when evaluating plants.
Students begin with a printed paper version of the PB observation requirements. PB data sheets are very easy to use for students and teachers alike, while also asking students to consider variables they probably would not come to on their own (see PB website for observation sheet). The app is likewise useable and requires very little reading for teachers and little training for students. Also, working through a dichotomous plant identification key requires students to evaluate measurements and understand adjectives.
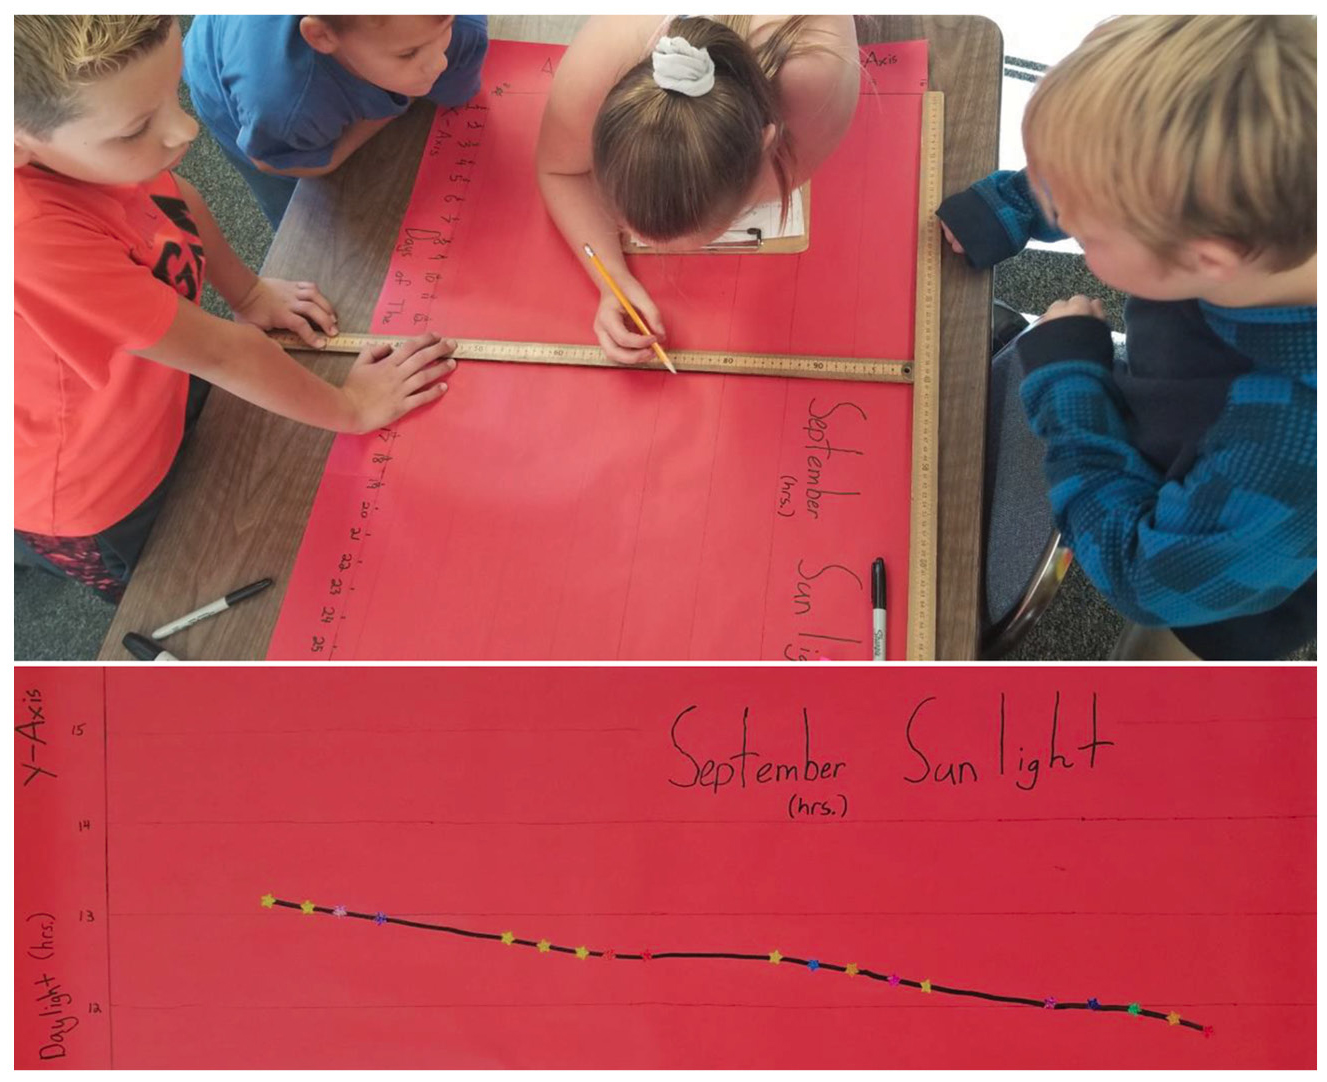
During math, PB lends itself to problem solving, measurement, record keeping, and data analysis. Light is a central theme as students estimate and then measure hours of sunlight daily. Students record the sunrise and sunset times each day from the local newspaper. As an entrance or exit activity, the class computes the hours of daylight we have each day. Doing so provides a quick assessment that meets grade level standards. Students track their math data within a science context. Working with real data in real time brings more motivation than worksheets. Regular light data analysis and monthly data sheets allow us to see our calculations fit into a pattern. Students graph the information, setting an appropriate x- and y- axis and scale. At the end of each month, student-generated data tables are used to create a poster charting the trend in daylight hours (see Figure 2). As the year progresses, daylight hours decrease in the fall and increase after the winter solstice, turning our data posters into a solar sine wave. Graphs of historic data can also be printed from PB with minimal time input. These present an easy comparison of data across time.
Both SCA and PB create platforms for social studies with obvious starting points in history and geography. Leopold eloquently discusses history in the context of tree rings and changes in the landscape through the year and across generations. PB documents current status of plants as a primary source, and data can be sorted and viewed geographically. Questions naturally arise about how geography and time affect their plant. Formalizing observations into PB is straightforward and can be done in a matter of minutes with the additional data of “place” (latitude/longitude) and date.
Along with science, art is also an important part of our journaling. Students systematically observe and make detailed drawings of one focal plant as it changes through the year to help further understanding. Students begin to ask and answer detailed questions about their plant’s functions, structures, and factors influencing behavior.
Science class time remains solely for adopted science curricula, which has many connections to SCA and PB, as well as the NGSS. In studying energy, waves, and light, for example, we learn about photosynthesis. As the year progresses, students are able to draw information from math, language arts, and personal observations, to frame their understanding of the concept of energy transfer. The science crosscutting concepts (e.g., cause and effect, energy and matter, patterns, systems and system models), added to other content areas as an overarching structure, effectively integrate and deepen the learning experience for students.
Integration Through the Seasons
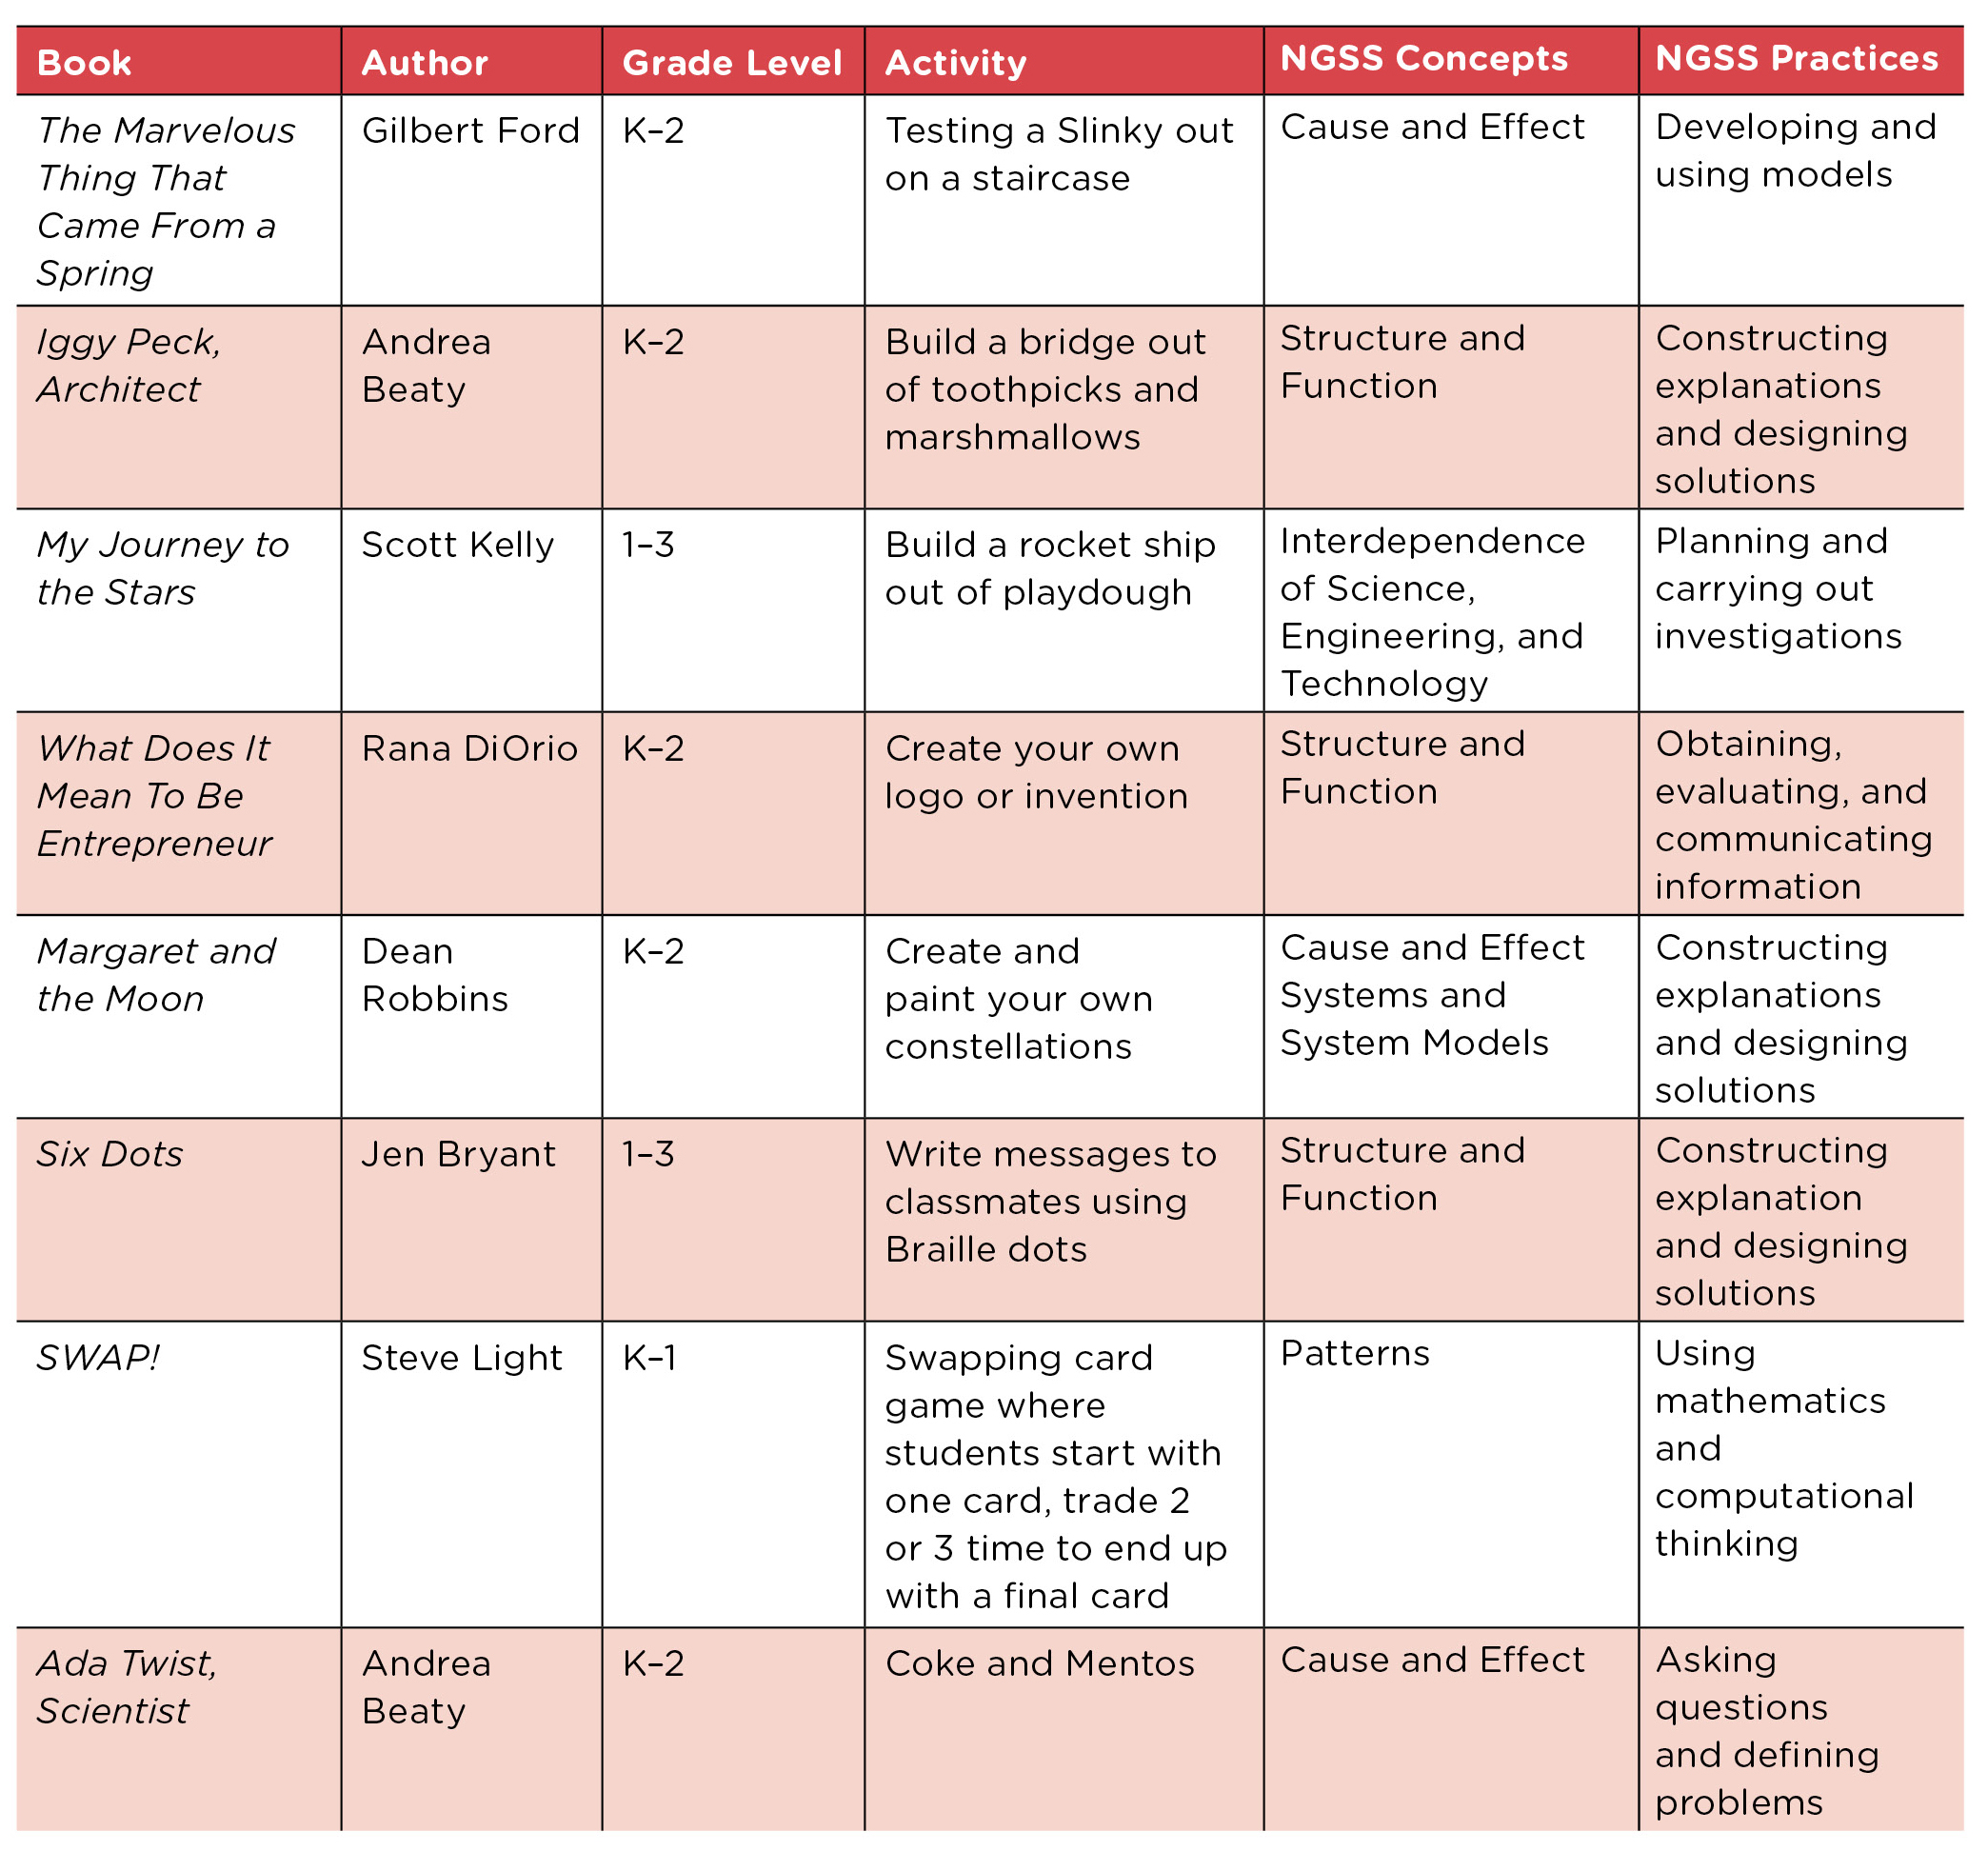
Each location, teacher, and class will take on its own personality (Table 1). Here is one example of how content can be built through the year: Language arts in autumn focuses on dissecting use of metaphor and figurative language. For example, in the August chapter of SCA, “The Green Pasture,” described as a painting, is neither a pasture nor a painting. Rather, it is riverside sedges emerging at low water. Leopold teaches not only to see but to think about and appreciate what we are seeing in new ways. October brings a relatable story about red lanterns, as most students have experienced blackberry picking and the thorns associated with it. Students are challenged by new vocabulary while thinking of the brambles in terms of protection for birds. By winter, students are working on short descriptive writing pieces using comparing and contrasting skills. An example of a favorite writing assignment is to accurately describe one of three similar cones (i.e., pine, spruce, juniper cones) collected from outside, so that readers can select the one described. In spring, students write expository pieces detailing their plant through the yearlong observational process. Working July’s chapter into June at the end of the school year can be difficult, but it is essential for closure. In this chapter, Leopold reports phenological comparisons similar to those of students through PB and draws conclusions that tie together several curricular topics from the students’ year.
Math focuses intensely on daylight (as described above) in the autumn with both measurements and predictions. Students learn which models always work and which do not when calculating elapsed time. In winter, we spend more time classifying and measuring, often with dichotomous plant identification keys. Studies in geometry allow us to use right triangles as a clinometer to measure tree height. In spring, consistent monitoring of light data allow predictions and tracking of phenological events like budburst and flowering, even human events like allergies.
Assessment
The ongoing and semi-formal approach described lends itself best to formative assessments throughout the year. Many appropriate formative assessments we use are featured in the book Science Formative Assessment: 75 Practical Strategies for Linking Assessment, Instruction, and Learning (Keely 2008). A great many of Keely’s ideas can be modified depending on teacher needs. For example, student annotated drawings allow students to show understanding and misconceptions beyond vocabulary level through drawings. Data match exercises encourage, allow, and show whether students believe their own collected data or believe in misconceptions regardless of data. Informal student interviews and a simple K-W-L are useful as well.
This project focuses on using observable information in conjunction with crosscutting concepts to further explain phenomena. Phenology is a relevant and observable application of the grade level NGSS standard of energy transfer and CCSS math standards for measurement, including time as linear (elapsing) and cyclic. CCSS language arts standards become the method by which students demonstrate their understanding. Many of the assessments are streamlined into language arts and mathematical assessments, with a content and context relevant to wider learning. For example, when assigning a student piece of expository writing, the topic can easily be descriptions of their plant or comparisons to other’s plants. Students are measured both on clarity of expression as well as attention to distinguishing details of natural processes that are directly observable by them. Likewise, mathematically calculating the height of their tree serves as a more relevant problem than finding the missing side of a triangle on a worksheet and demonstrates a real-world application. In this way, real-world content blends with language and math skills to provide a coherent learning structure. The project takes place and evolves over a year, so assessments build and evolve as well, starting small, then encompassing the year.
Conclusions
A perennial favorite SCA passage regards when, on drab March days, the educated person misses the excitement of geese flying over because she is indoors. Students plump themselves up a little at hearing this after having read outside in the winter and likely having watched and listened to geese fly over. Memorable school experiences like this provide a coherent structure and storyline for learning throughout the school year. Students see this long-term project broken up into manageable chunks, each accessible, each interesting, each important to the overall picture. It gives students a sense of importance in learning from and about the natural world through a new lens.
Online Resources
Project Budburst https://www.budburst.org
Wes Bascom (w.bascom@hotmail.com) is a fourth-grade teacher in Moscow, Idaho. Brant Miller is an associate professor of science education at the University of Idaho, Moscow.
Instructional Materials Interdisciplinary STEM Teaching Strategies Elementary