
engineering encounters
Farmers vs. Rabbits
Fifth graders explore how to maintain balance with environmentally sustainable solutions
Science and Children—March/April 2023 (Volume 60, Issue 4)
By Heidi Masters, Jacob Brehmer, Doug Feyen, and David McKittrick
Angry farmers are tired of rabbits eating their crops, so they have set live traps, put out poison, and/or overhunted them to remove them from the area. As a result, the farmers have disrupted the food web. Can you help the local Department of Natural Resources design a solution to help stabilize the ecosystem? A fifth-grade teacher provided us this opportunity to engage their students in four lessons to address this problem. Students learned about food webs (5-LS2-1), factors that can affect food webs, and the engineering design process (3-5-ETS1-1-3) (NGSS Lead States 2013). When designing a possible solution, the students were given the choice to create an outreach project or a construction project. By providing choices, students felt empowered and motivated by the opportunity to be creative with their design solution, which resulted in them engaging deeply in the learning experience (Katz and Assor 2007).
Lesson 1: Food Webs
We began the first lesson by constructing a food web using different items the students ate for lunch. To elicit the students’ initial ideas about the constructed food web and investigable question, we asked the students, “How do organisms depend on each other to survive?” One student responded, “We depend on many animals and plants for food.” We engaged the students in an interactive Web of Life simulation that we modified from Population Connection (2016) to explore this question further using organisms from the kelp forest, as prior to our lesson, the students were learning about this ecosystem with their teacher.
For the simulation, students were invited to stand in a circle, and they were each given a picture of an organism from the kelp forest ecosystem. Students with the same organisms were asked to stand next to each other. We then read a kelp forest food web story that we created using a similar format to Population Connection (2016) but with kelp forest animals (see Supplemental Resources). As students heard their organism’s name, they received a ball of yarn and held onto a piece of it before tossing it to the next organism in the story. This resulted in the creation of a large food web model that helped students visualize how organisms within an ecosystem are connected.
Statements were then read (see Supplemental Resources) about a specific organism’s population increasing or decreasing due to a specific factor (e.g., hunting, water pollution, overpopulation). When an organism was affected by a factor, the student holding the yarn for that organism tugged on it, and those that felt the effect of the tug raised their hand. Students were shocked by the number of organisms that would be affected due to a change to one organism in the food web.
To assess the students’ learning, we asked them to create a food web using grass, a snake, a rabbit, and a hawk (Figure 1). As shown in Figure 1, our students frequently drew the arrows the wrong direction to show the transfer of energy (e.g., arrow pointing from the rabbit to the grass). It is important to remind students that the arrows should point in the direction the energy transfers (e.g., arrow pointing from the grass to the rabbit). Additionally, students answered the investigable question (Figure 1). Students built upon this assessment in the three remaining lessons.
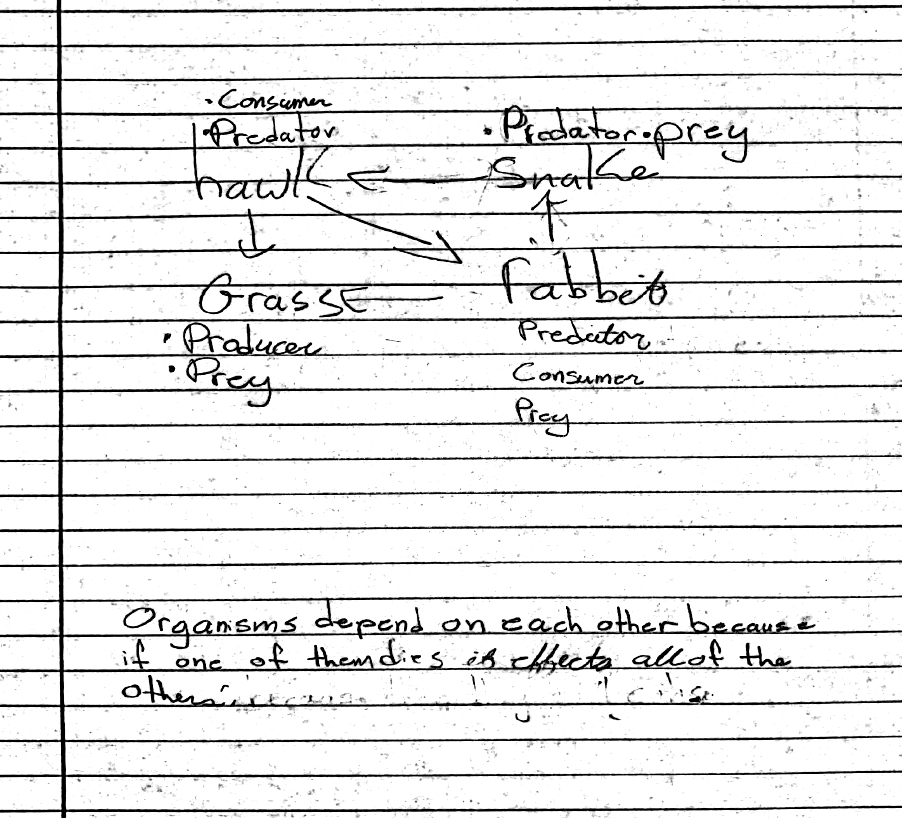
Example of student food web and explanation.
Lesson 2: Factors that Impact Food Webs
We began lesson two by eliciting the students’ prior knowledge about food webs by asking them to construct one using a python, racoon, bobcat, opossum, rabbit, and fox. Students were reminded the arrows should point in the direction the energy transfers. We prompted the students to predict what would happen to the food web system if the population of one organism increased or decreased significantly. Most of the students predicted that an increase in one organism would provide more food and benefit the ecosystem; whereas a decrease in one organism would result in there not being enough food and cause some organisms to struggle.
For the remainder of the lesson, students explored factors that could cause a food web system to become unbalanced and the impact this would have on an ecosystem. To introduce this concept, students were tasked with reading a short paragraph on how an invasive python species affected an ecosystem. From this reading the students realized, “The invasive python was eating all the other animals, which resulted in the other animals’ food supply being impacted.” Students were then asked, “What are other factors that could change the balance of an ecosystem?” A few initial ideas the students had were “disease,” “weather,” and “pollution.” To explore this concept further, we introduced the investigable discussion “What factors can impact a food web?”
For the investigation, we divided the class into four groups and each group was given two factors to explore: humans (urbanization and overhunting), environment (pollution and natural disasters), disease (pesticides/herbicides and infection), and competition (invasive species and overpopulation). Each group received two articles to read (see Supplemental Resources) and were asked to take notes on how the two factors could impact a food web. After giving the students time to read their articles, we utilized the Jigsaw Method (Aronson 1978) to rearrange the four groups so there was a student from each of the four categories (i.e., humans, environment, disease, and competition) in a new group. In their new groups, students took turns sharing how the factors they read about impact food web systems. Some ideas that were shared are: “Parasites can cause animals to die.” “There are some invasive plants that can take over an area and remove native plants.”
After discussing the factors that can cause disruption to an ecosystem, students applied what they learned to a food web simulation. Prior to running the simulation, we elicited the students’ ideas by asking them to predict what would happen to the number of each organism (e.g., increase, decrease, stay the same) if one of the following occurred: diseased grass, overpopulation of snakes, and reduction in rabbits. After students made their predictions, we ran the Gizmos digital food web simulation. The simulation results for the grass becoming diseased can be found in Figure 2. While the students were analyzing and interpreting the data, we engaged them in a fruitful discussion about what they noticed happened to each organism. For the diseased grass data, students noticed, “All the organisms decreased.” Students recorded the results and compared them to their initial predictions, which served as an assessment. We continued this process for the snakes and rabbits as well. Students were perplexed by the data for the snakes because it did not match their prediction that more organisms would benefit the ecosystem.
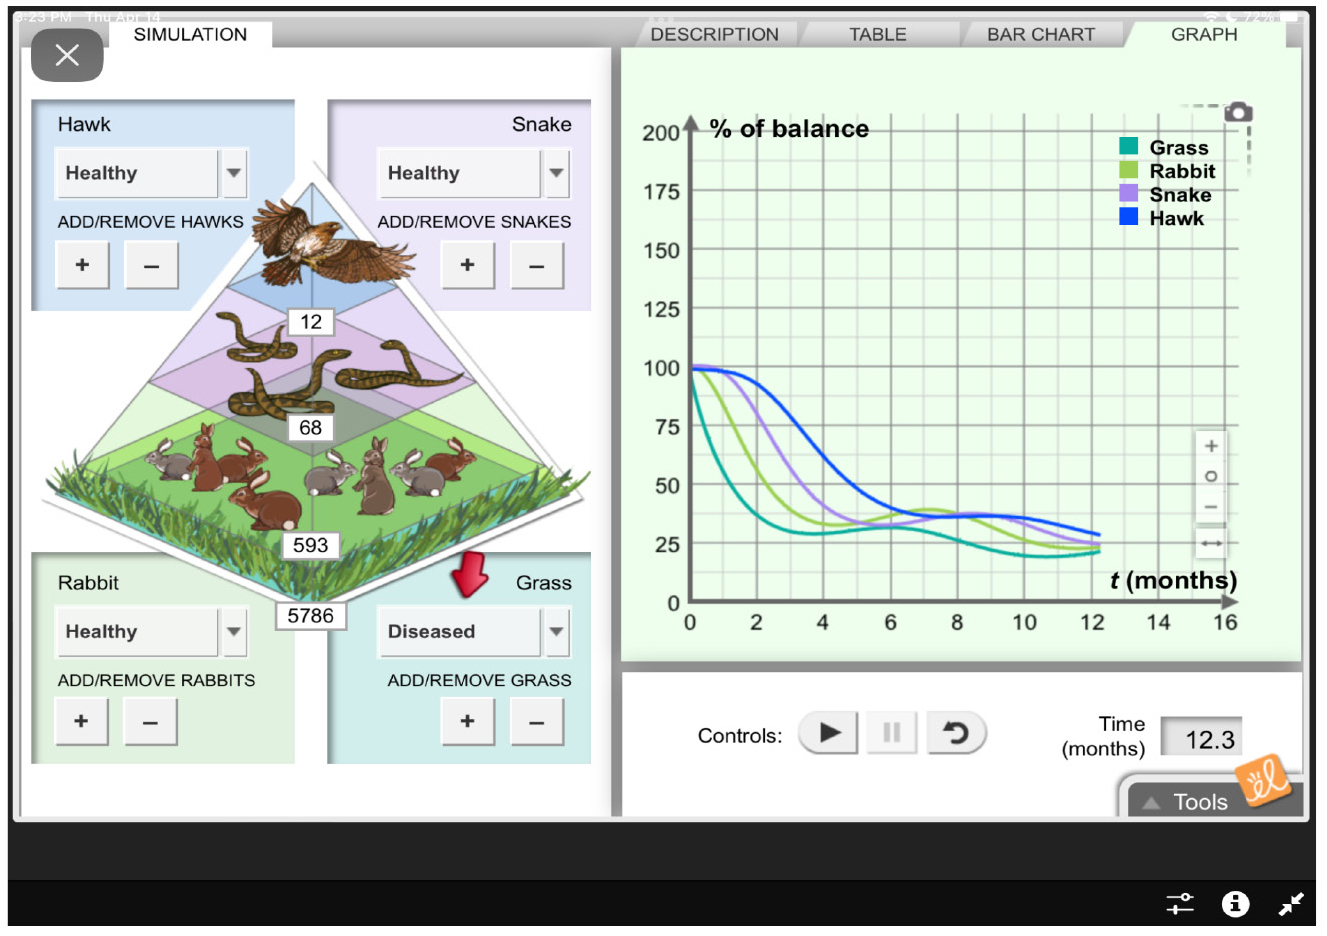
Gizmos simulation results for diseased grass.
Lesson 3: Engineering Problem, Research, and Design
To engage students, we decided to dress up as farmers to introduce the problem. Students reviewed the Gizmo data from lesson two to fully grasp how a decrease in the rabbit population would affect other organisms in the food web. Before working on a solution to this problem, we engaged students in a discussion about the work of an engineer, as this role was new for the students. A few responses from students were they: “Fix things,” “Create,” and “Test ideas.” Next, we explained the engineering design process and emphasized the redesign stage to normalize that their first idea may not work.
We then introduced two different approaches students could use to solve the problem: an outreach project or a construction project. Both options had the following constraints: time (two workdays), money ($100 budget), and materials (Tables 1 and 2). The criteria for a successful outreach project consisted of educating at least 300 people about the environmental impact of rabbit reduction on the ecosystem and more sustainable solutions (Table 1). As shown in Table 1, the cost and number of people reached with each marketing venue varied to resemble the real-world. For example, the social media marketing venue had the most variability as the amount of people a post reaches is often dependent on how frequently it is shared.
For the construction project, the criterion for a successful solution was keeping at least 30 rabbits out of a 1-acre farm field with a perimeter of 800 feet. If groups chose to design a construction project, they automatically paid a $40 building plan fee, which is a common requirement for a new construction (Table 2). Each building material also cost a certain amount per 400 feet and would keep out a percentage of rabbits to align with the real world. For example, the moat would keep out the most rabbits but also would cost the most to construct.
After reviewing the two solution options, we divided the students into groups of three or four based on their solution preference. Within the groups, students began by researching different outreach project venues and environmentally sustainable solutions or exploring the pros and cons of different construction designs. While students were working, we assessed their thinking by encouraging them to share their reasoning for their design decisions. Examples of responses we heard were: “We are going to build a moat around the farmer’s field because the rabbits will not be able to easily get across the water,” and “We are thinking about creating a news story, as we want to educate the most people on other ways they can prevent rabbits from eating their crops.”
Lesson 4: Engineering Development and Share Out
On the last day, we reminded the students about the engineering problem, criterion, and constraints. After providing students a little more time to work on their solutions, each group was given the opportunity to share (1) how their solution addressed the problem, (2) how much it would cost, (3) how successful it would be, and (4) how it would help maintain an environmentally sustainable and balanced ecosystem. When listening to the fifth graders present their projects, we focused our assessment on their responses to number one and four. Examples of student responses are provided when discussing Figure 3 and 4 below.
Figure 3 is a picture of an outreach project that we captured while they were developing it. As Figure 3 shows, the students in this group were focused on educating the public about how trapping and poisoning rabbits can cause an ecosystem to become unbalanced. During this group’s presentation to the whole class, they also shared more environmentally sustainable approaches that people could use to protect their crops and reduce the impact on the rabbit population, such as putting up a fence and planting marigolds to deter the rabbits.
| Table 1. Outreach project materials. | |||||||||||||||||||||||||||||||||||||||||||||
|---|---|---|---|---|---|---|---|---|---|---|---|---|---|---|---|---|---|---|---|---|---|---|---|---|---|---|---|---|---|---|---|---|---|---|---|---|---|---|---|---|---|---|---|---|---|
|
|||||||||||||||||||||||||||||||||||||||||||||
| Table 2. Construction project materials. | ||||||||||||||||||||||||
|---|---|---|---|---|---|---|---|---|---|---|---|---|---|---|---|---|---|---|---|---|---|---|---|---|
|
||||||||||||||||||||||||
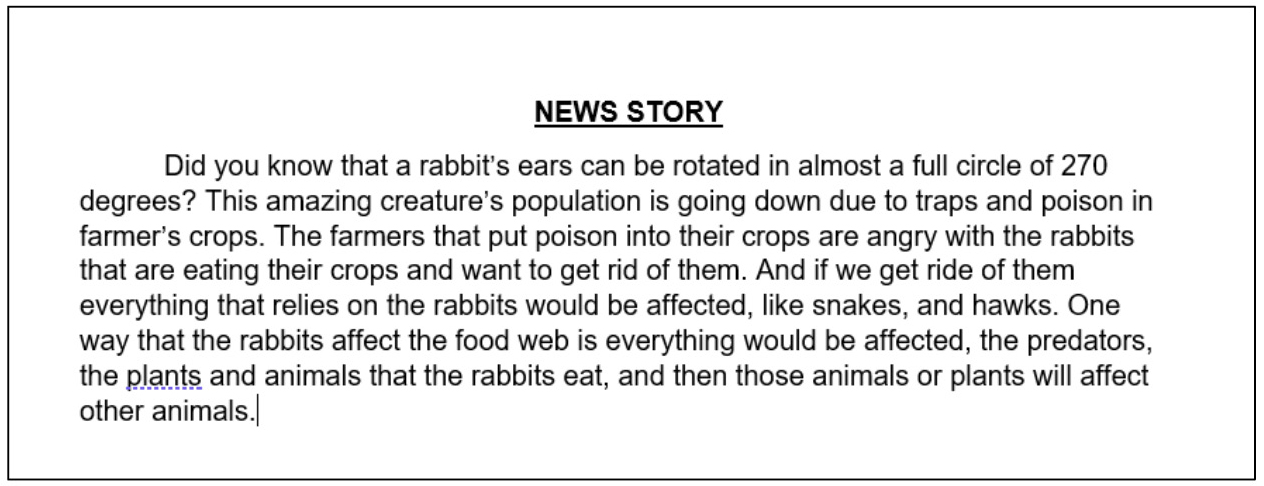
Student outreach project example.
Figure 4 is an example of a construction project a group shared that included a moat, chicken wire fence, and plants rabbits prefer. When presenting the construction project shown in Figure 4, the students shared they selected a moat and chicken wire fence to keep rabbits from eating the farmer’s crops; however, they also included plants rabbits prefer around fence to make sure there was still enough food for the rabbits to eat.
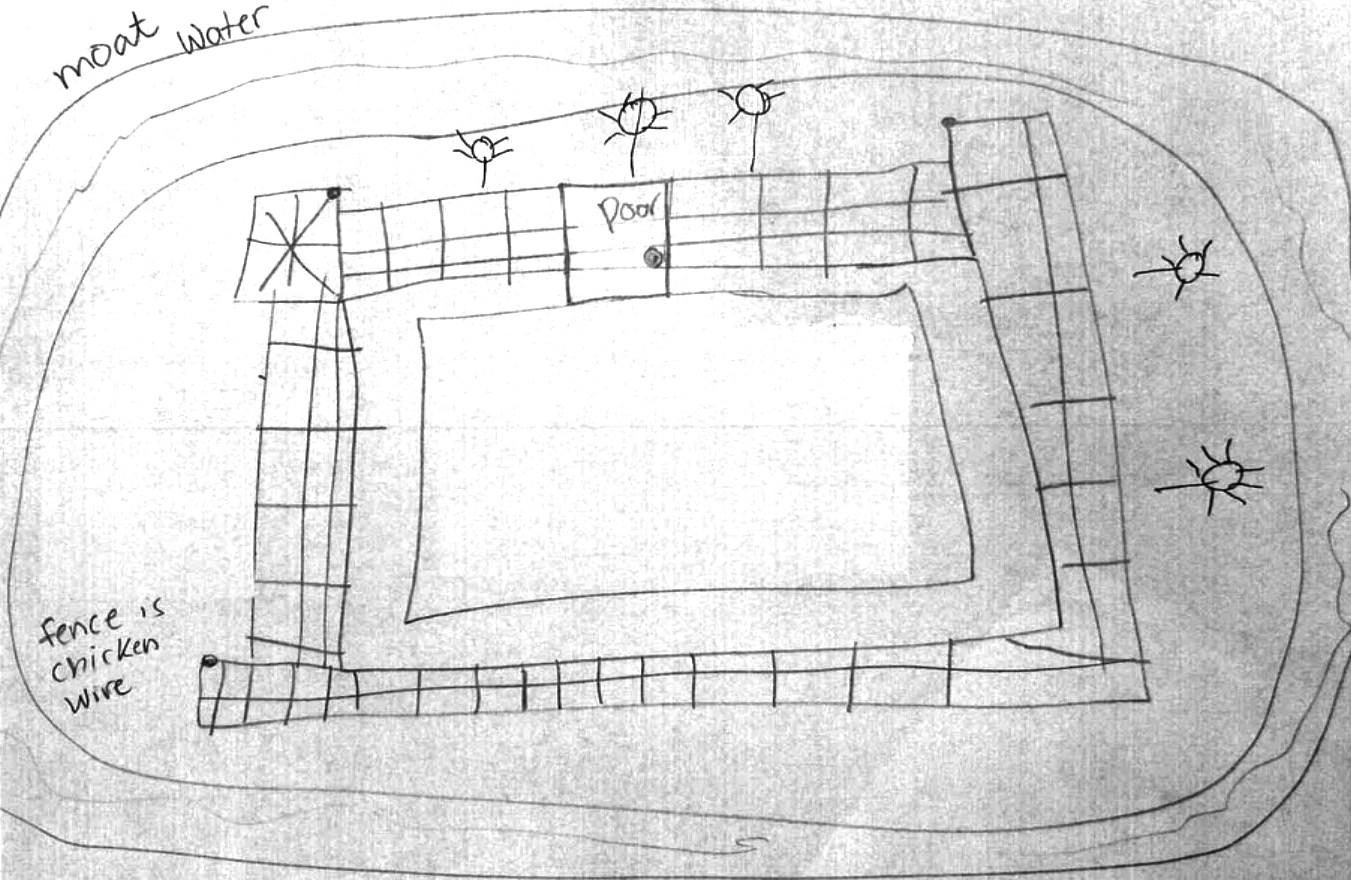
Student construction project example.
To conclude this lesson, students were given an opportunity to think of one change they could make to their solution to improve its effectiveness. One interesting modification from a student was, “Next time we could try using decoys and pheromones to lure the rabbits away from the farmers field.” This comment demonstrates the amazing thinking these fifth graders were able to do during this sequence of lessons. We are very proud of their ability to apply what they learned and develop a variety of creative and environmentally sustainable solutions to address the farmers’ problem.
Conclusion
By engaging in this series of lessons, students were provided the opportunity to learn about the delicate nature of food webs and how a seemingly small change to an ecosystem can have long-term effects. Students were challenged to apply the science concepts they learned to solve a real-world problem farmers experience as engineers. Although the engineering solutions could not be “tested” in real life, the simulated experience allowed the students to engage in critical thinking and problem-solving efforts to develop and explain how their solution would result in an environmentally sustainable and balanced ecosystem. Due to time limitations, we unfortunately were unable to provide students the opportunity to physically revise and improve their solution; however, the classroom teacher was able to continue this process with her students. Given these rich learning experiences, the local farmers are thrilled about the variety of new solutions they can now use to protect their crops against rabbits while sustaining a balanced ecosystem.
Supplemental Resources
Download the readings at https://bit.ly/3SjVdJH
Online Resources
Gizmos Food Web: https://gizmos.explorelearning.com/index.cfm?method=cResource.dspDetail&ResourceID=381
Heidi Masters (hmasters@uwlax.edu) is an associate professor, and Jacob Brehmer, Doug Feyen, and David McKittrick are teacher candidates at the University of Wisconsin – La Crosse in La Crosse, Wisconsin.
Earth & Space Science Engineering Interdisciplinary Life Science Teaching Strategies Elementary Grade 5