
Feature
The Energy Zipline
CONTENT AREA Physical Science
GRADE LEVEL 6–9
BIG IDEA/UNIT Connecting energy and motion
ESSENTIAL PRE-EXISTING KNOWLEDGE Conducting investigations and graphical analysis
TIME REQUIRED 120 minutes or three 45-minute periods
COST Less than $5
SAFETY Safety glasses should be worn by students.
Potential energy and kinetic energy are common concepts in middle school science curriculums. In this lesson students investigate the impacts of mass, velocity, and height on energy. This article explores the use of the “energy zipline” to engage students in exploring the variables of kinetic and potential energy and developing skills in modeling and graphical representations. These lessons on potential and kinetic energy are taught following our unit on motion.
Day 1: Zipline mass investigation
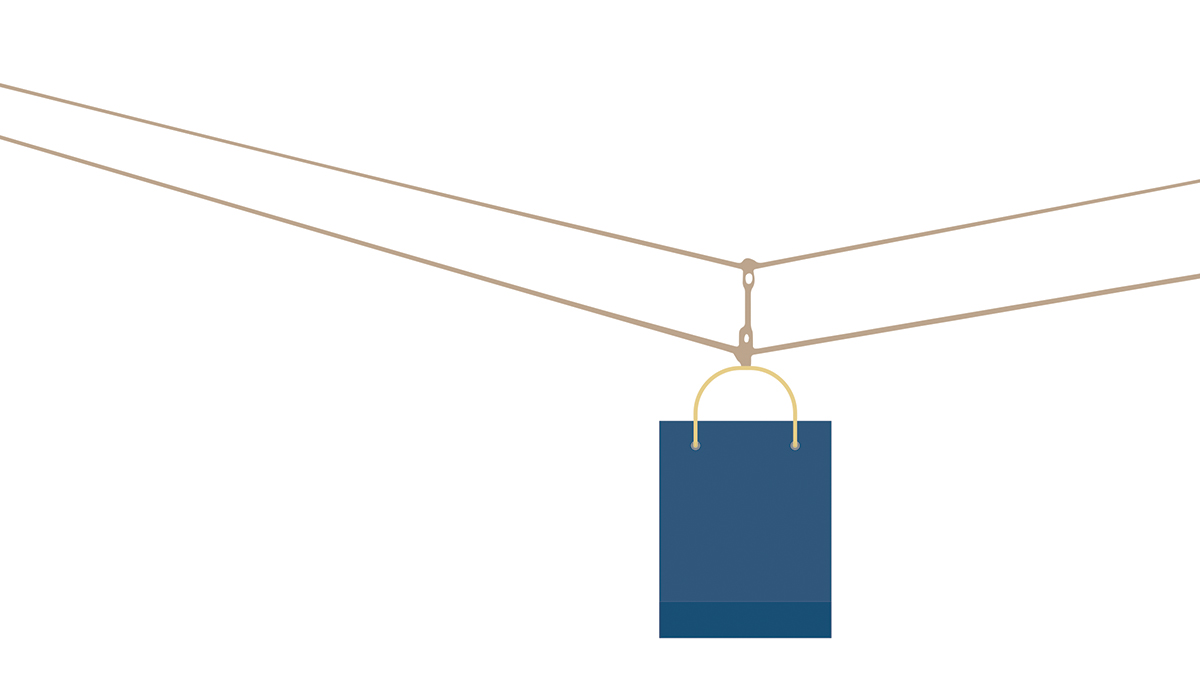
In our first 45-minute period, students excitedly enter the classroom to see a bag attached to the top of a zipline that spans our entire classroom above their own heights. For easy setup, we attach our zipline to the top of our projector screen and to the bottom of a table leg. To begin class, we suspend a can (e.g., canned vegetables) in a bag from a carabiner and ask students, “How much energy does the bag have at the top of the zipline?” Typical student responses vary from “a lot” to “none—it’s not moving.” We tell students we will show the zipline twice. We release the bag and watch it move down the zipline. Then, we focus students’ thinking by asking, “If the bag has no energy, how does it move down the zipline?” We release the bag again from the zipline. Then, students discuss their ideas concerning the question in their table groups before sharing out responses to the whole class.
To begin helping students differentiate between potential and kinetic energy, we ask, “How does the energy of the bag compare from the top of the zipline to the bottom?” We write students’ ideas on the board to keep a record. Students typically claim the energy is decreasing or going away altogether as the bag moves down the zipline. Next, we ask students, “How is the energy at the top different from the energy at the middle of the zipline?” Typically, student responses include that there is “possible energy” and “moving energy.” We note that the moving energy is called kinetic energy and the possible energy is potential energy.
Next, we ask, “How much energy does the bag have once it’s sitting on the ground?” Because of prior learning, students know to say that “there is still energy because it can’t be created or destroyed.” Unfortunately, this is an example of students misapplying conservation of energy. To help them we ask, “What did you notice when the bag hit the ground?” Students easily note that the bag made a loud noise, so we ask, “How is that noise and vibration related to the kinetic energy of the bag?” With some small-group talking, students typically speculate that the kinetic energy gets turned into the sound and vibrations. To support students’ understanding of the transfer of energy, we place a small box at the bottom of the zipline and send the bag down the zipline again. This time, the students see the box slide at the same time as the bag comes to a stop. At this point we ask, “What can you say about the transfer of energy to the box?” Students share that sound and vibrations are made when the bag hits the box and the box begins moving when the kinetic energy is transferred from the bag to the box. We then revisit a prior question by asking, “Where does the energy from the bag go when it reaches the ground?” Students identify that the energy is transferred to the box and the ground (Figure 1).
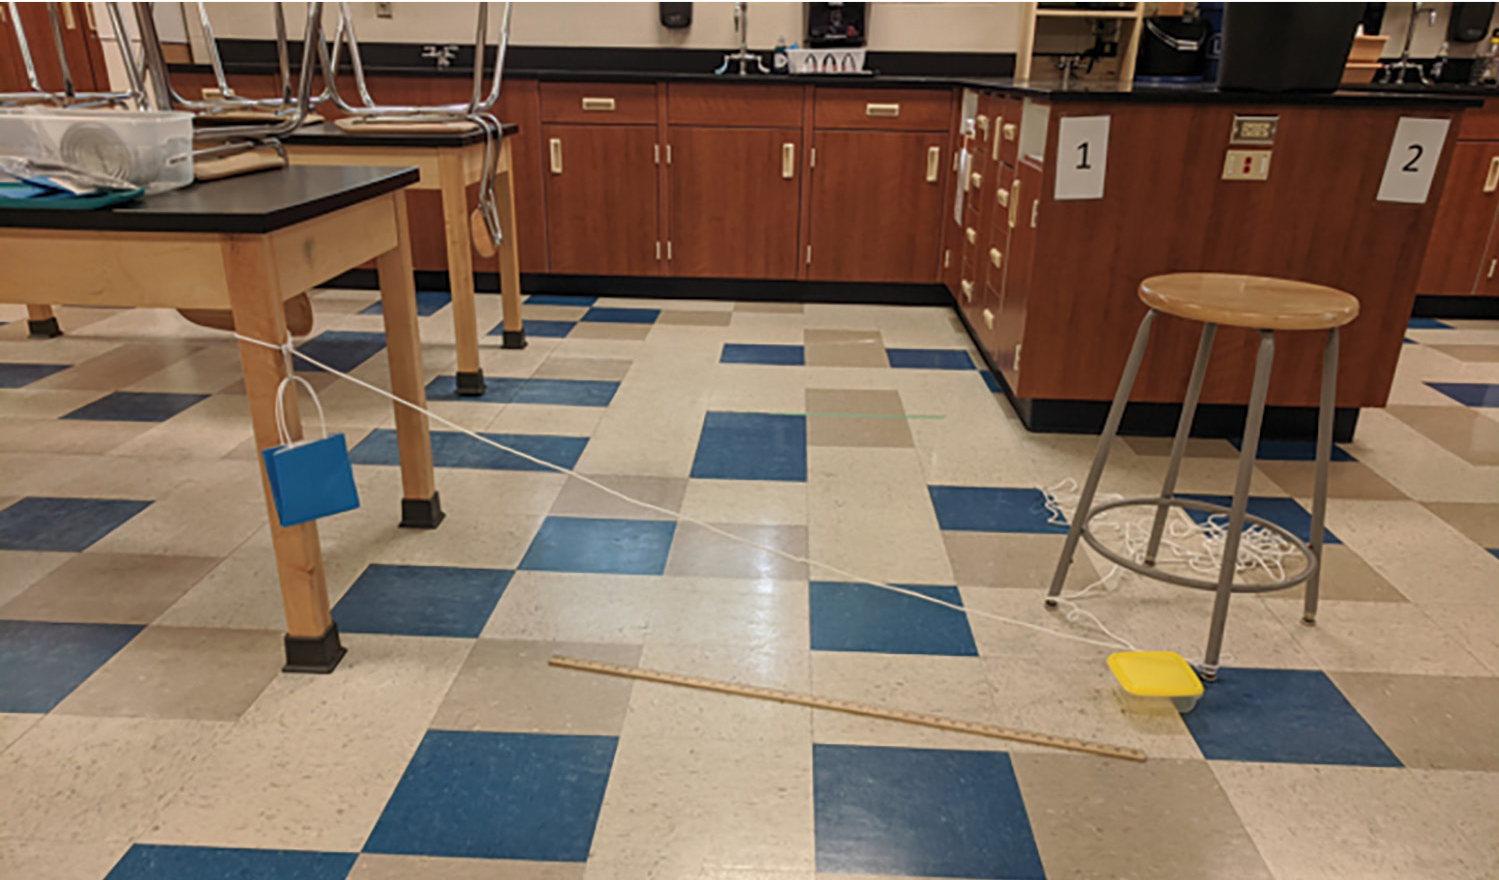
A student-constructed zipline used for investigations.
To focus students on the relationship between mass and kinetic energy, we ask them, “How does the mass of the object change the kinetic energy?” Students discuss this in table groups. After some brief sharing, we tell students that each table group of three to four students will work together to conduct an investigation and will get a mini-zipline kit containing: a zipline rope (e.g., ¼ inch nylon rope of at least 20 feet), a small bag (e.g., 4 × 6 inch paper gift bag), a carabiner, and a box (e.g., 2 × 5 × 7 inch box) to place at the end of their zipline. To focus the investigation, we ask, “How can we test the relationship between mass and kinetic energy?” To help students develop a procedure we ask, “How could you change the mass of the bag?” Students easily note that they can add things to the bag. Next, we ask students, “How can the box help us visually see the change in kinetic energy?” When students say that the more the box moves, the more energy there was in the bag, we ask, “What data do we need to collect if we want to know how mass impacts the kinetic energy?” We listen to student ideas until the following ideas are shared: mass of the bag and the distance the box moved. Then, we ask students, “How can we organize this data in our notebooks?” On the whiteboard, as a whole class and using student ideas, we create a two-column chart with students to organize their data. An example of a student procedure is shown in Table 1, and the two-column data chart is shown in Table 2.
|
Set up your group’s zipline by attaching rope to the bottom of the chair leg and to the top of a table. |
|
Attach the bag to a carabiner and hang it from the top of the zipline. |
|
Place the box at the bottom of the zipline. |
|
Place the mass object for this trial in your bag and set on the balance. |
|
Write down the mass of the bag in your data table. |
|
Allow the bag to move down the zipline and hit the box. |
|
Measure how far the box moved and record the distance in your data table. |
|
Repeat steps 2–7 with a different mass object in the bag to collect additional data. |
Now students in each table group set up their groups’ zipline, put on their safety goggles in case the bag breaks, and begin to collect their data. See Figure 1 for an example of a group’s initial setup. Once students clean up and return to their seats, we draw an x-axis and y-axis on the board to begin graphing data with students. We ask, “How can we use our data to create a graph showing the relationship between mass of the object and the amount of kinetic energy?” When students say we need one side to be the mass and one side to be kinetic energy, we label the graph for students with mass on the x-axis and energy (distance box moved) on the y-axis. Next, we take a point of data from our own investigation and model for students how to graph the data. Then, we ask students to draw the graph in their notebook and add their own data to the graph. While students work, we walk around the room assisting them as needed with their graphing. Once table groups are done, we welcome each group to add their own data to the graph on the board. Once all groups have added their data we ask, “How does mass impact the kinetic energy?” We then have a class discussion about how increasing and decreasing the mass increased and decreased the kinetic energy, respectively.
Day 2: Zipline speed investigation
As our bell ringer, we displayed the question: “What could change the amount of kinetic energy an object has?” From our previous investigation, students note mass, but we push them further by asking, “What else might affect kinetic energy?” When students note speed, we ask, “How does a change in the speed of an object impact the kinetic energy?” After listening to student ideas, we ask, “How can we change the speed of the zipline bag to test your ideas?” Once students have shared ideas about how to adjust the speed of the zipline, we focus them on the idea of adjusting the height of the zipline by asking, “How does changing the height of the zipline change the speed of the bag?” When students respond that a higher zipline allows the bag to fall longer so it will be moving faster, we ask, “How can we use the box again to measure the kinetic energy for the different speeds?” Students easily make connections to the previous day, and we develop a similar procedure as a class. We remind students before starting their investigation to wear their safety goggles.
Before allowing students to work, we ask, “How can we organize the data we need to collect in this investigation?” Once students have identified that we should use a data table and collect data on the height of the zipline and how far the box moved, we have students add these columns to their data table. Some schools and students may have access to photogates or picket fences that can assist students in collecting data and could allow students to collect position, time, and speed data to be used in a more mathematical and technology-based approach to this investigation. Because this is unavailable to our students and many middle schoolers struggle to measure speed accurately using time over a short distance, we use the height (and resultant increased steepness) of the zipline as a proxy for speed. Because our emphasis is on conceptual rather than quantitative understanding, this approach works well.
After data collection we ask students, “How can we graph our speed and energy data?” When students identify that we could use the same process that was used for mass, we draw a second set of axes to the right of the first data set. We ask students to add the second axes to their notebooks and graph their data as shown in Figure 2. Once they check their notebooks with us, they add their data to the class graph on the whiteboard. This allows us to do a quick check to ensure that students understand the graphing process.
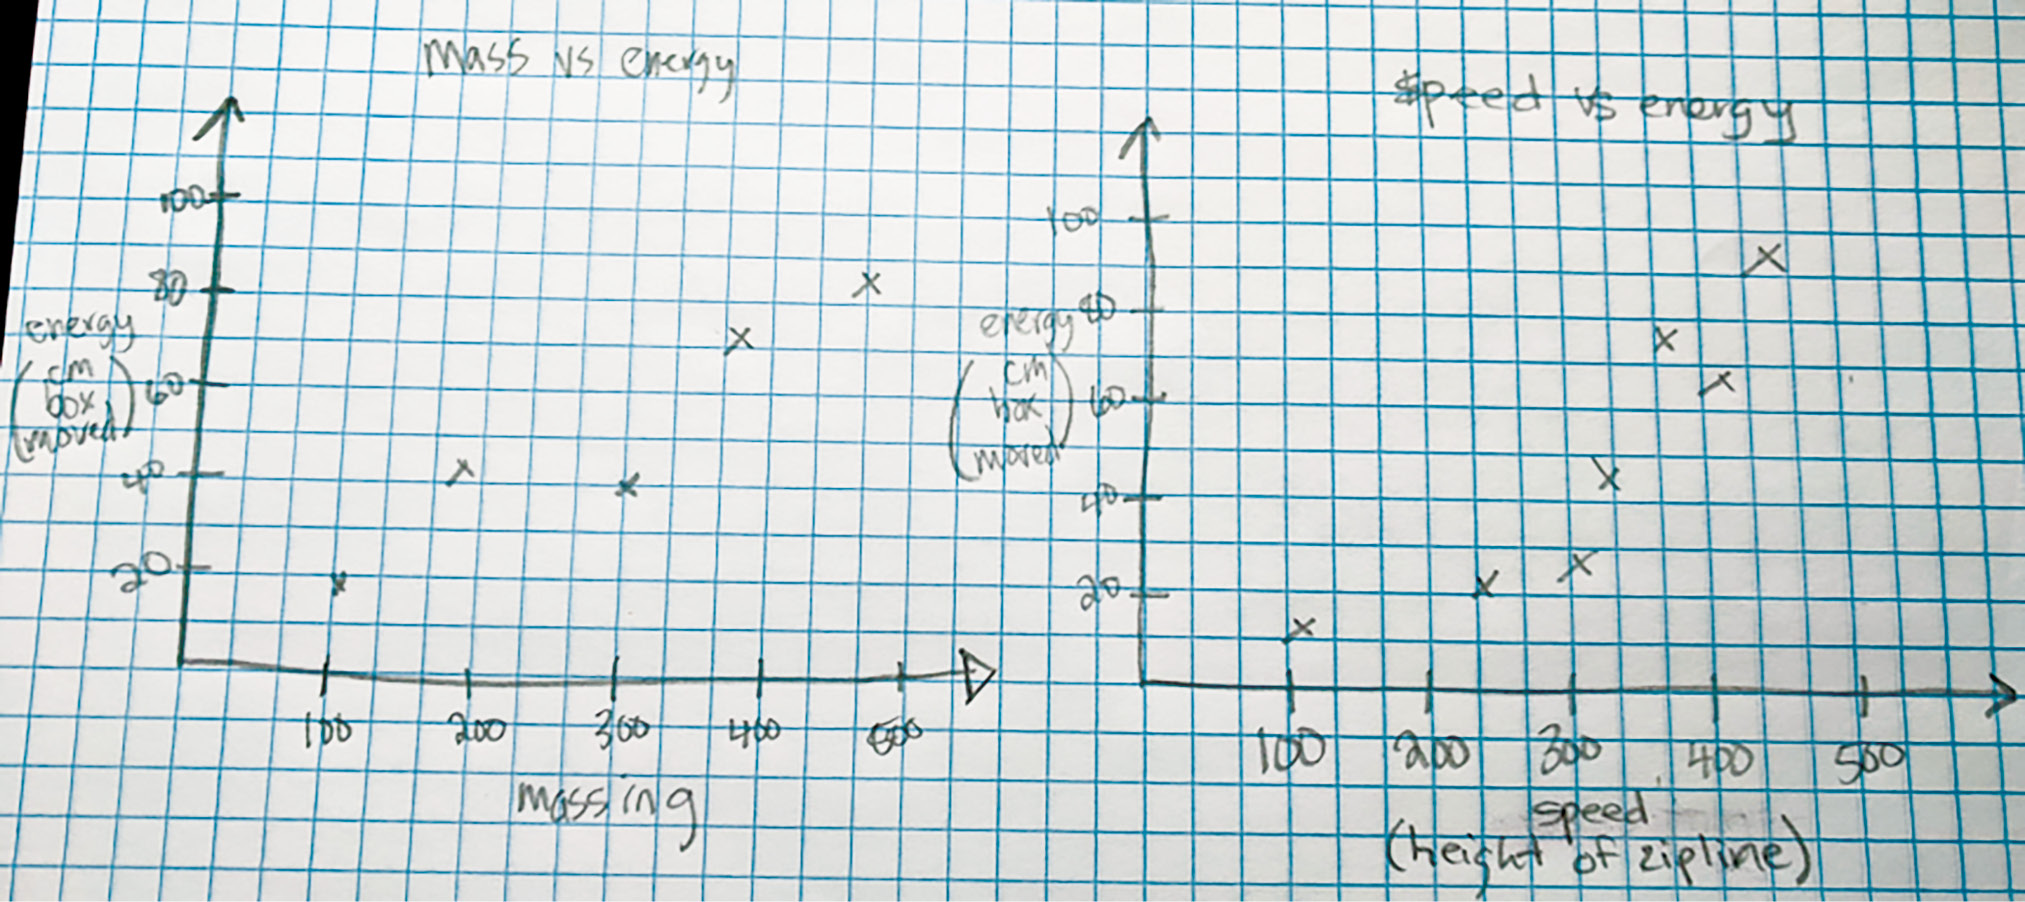
Two student-created graphs exploring the effect of mass and speed on transferred energy.
Once students have added their data, we ask them, “How does the speed impact the kinetic energy?” When students recognize, using their data as evidence, that as speed increases/decreases, the kinetic energy also increases/decreases, respectively, we ask them, “How can we find a line of best fit for both our mass versus energy graph and our speed versus energy graph?” From prior learning, students know to use a straightedge to draw a straight line as close to the data points as possible as shown in Figure 3. While we draw the line using student ideas on the mass-versus-energy graph quite quickly, students have different ideas about the best fit line for the speed-versus-energy data. In response to student ideas we ask, “We are hearing that you have a few different ideas about how to fit a line to the data; why might a straight line not best represent the speed data?” When students share that the data is more of a curve, we draw the blue curve line onto the graph. We ask students, “The blue line is a curve. What would cause the data to curve?”
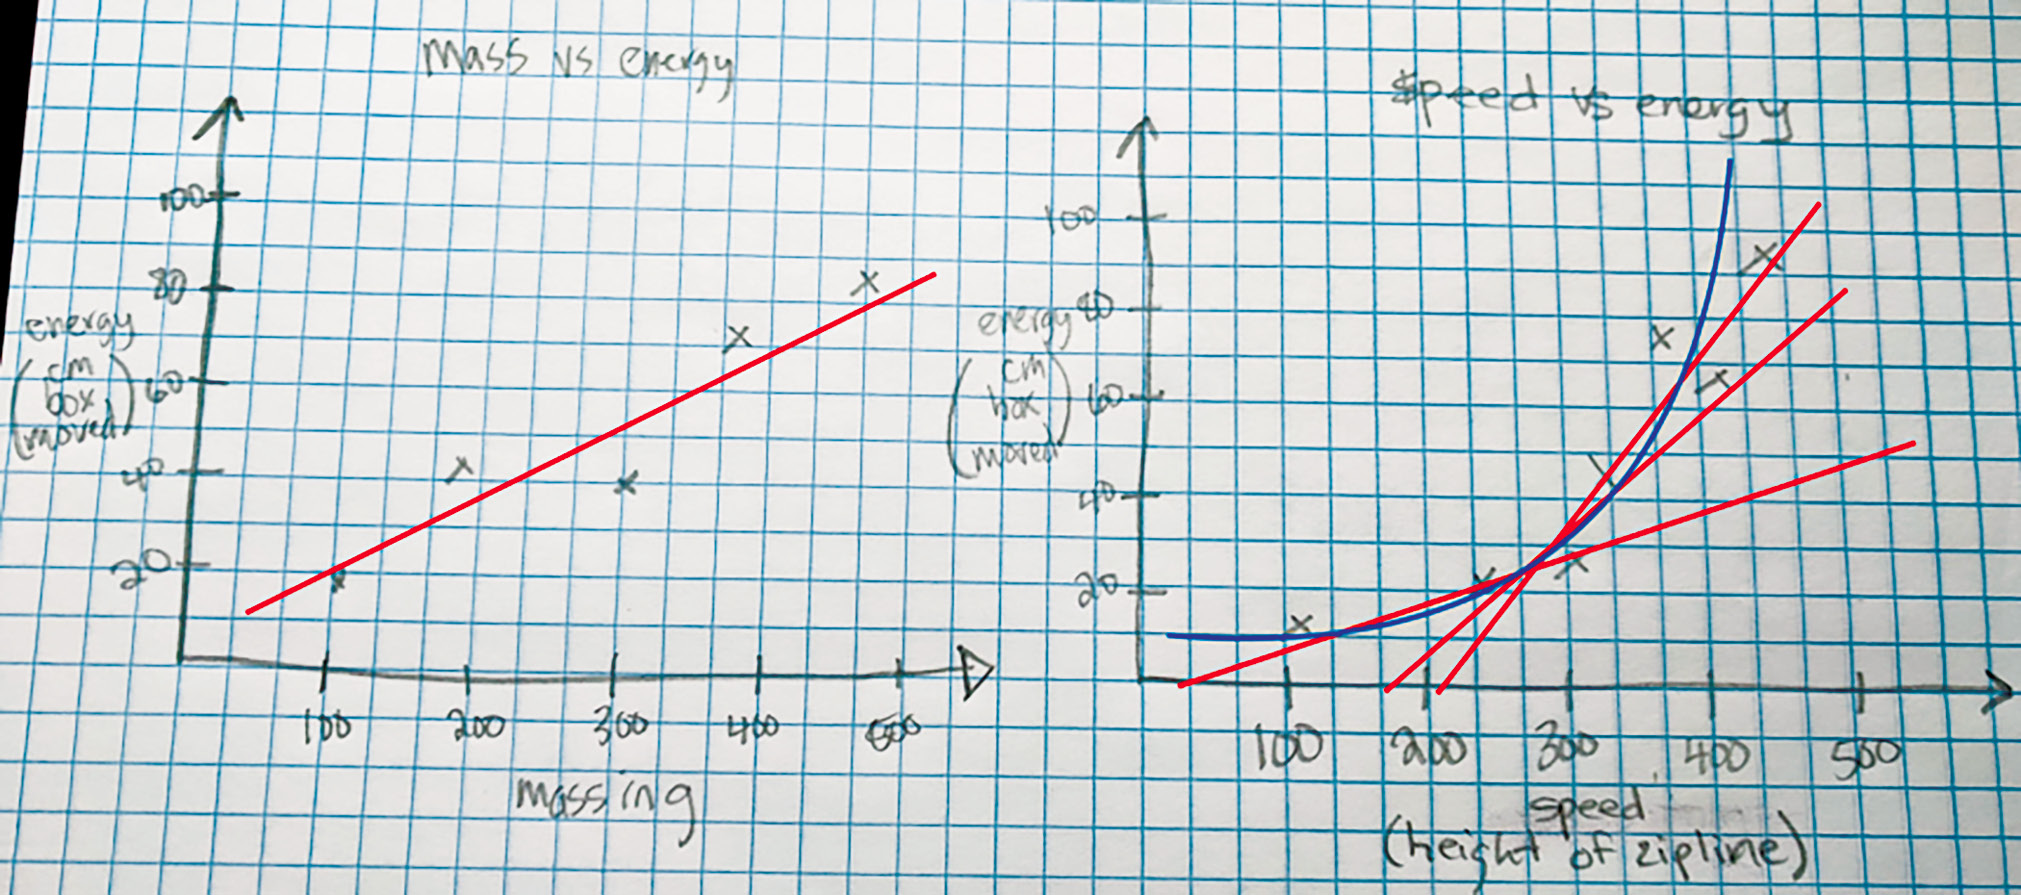
Overlaying lines and curves on student data to support data interpretation.
Students often struggle with identifying a cause, so we break down graph shapes by having student groups draw a y = x graph. Students quickly recognize the graph is a straight line at about a 45-degree angle. We then ask students to draw a graph of y = x2. If groups struggle, we do some example data points with them such as (1,1) and (3,9). When students connect their points for y = x2, they recognize the curved nature of the graph.
To explicitly connect the y = x2 and their velocity graphs, we ask, “If these two graphs are both similar curves, what does that mean about how speed impacts energy?” When students recognize that speed squared must affect the change in energy, we encourage students to make one more connection by asking, “Which variable has a greater impact on the kinetic energy: mass or speed?” Once students are verbalizing that speed has a greater impact because it is squared and mass is not, we end our lesson.
Day 3: Zipline discussion
To begin day 3, we draw a model of the zipline on the whiteboard and ask students, “Where on the zipline is the potential energy greatest?” When students share that the top of the zipline has the greatest amount of potential energy, we draw a circle for a pie chart and ask students, “How much of this is potential energy?” When students conclude that all of the pie chart is potential energy, we shade the entire pie chart one color. We then ask, “Where is the greatest amount of kinetic energy?” When students identify the bottom, we ask students, “How can you graph that using a pie chart?” After students discuss in small groups, they typically note the pie chart should be all kinetic energy. We then ask, “How would you color this pie chart in the middle of the zipline?” We allow students to discuss, and although they struggle a bit more, they recognize the pie chart is about half kinetic energy and half potential energy. While we sometimes use percentages in this discussion, trying to determine actual percentages can cause students to focus on numbers and lose sight of the conceptual understanding.
After this discussion we ask, “How much energy does the bag have once it’s on the ground?” When student’s say none we ask, “How can we add that to our pie chart diagram on the board?” Students often struggle with this, so we introduce the idea, adding “transferred energy” to the pie chart. With this new idea, students quickly realize that the pie chart representing the bag at rest on the ground is all transferred energy.
We then draw a zipline angled lower than the current one on the whiteboard and ask, “How does the potential energy at the low zipline compare to potential energy at the high zipline?” Once students conclude the top zipline has more potential energy and the bottom zipline has less potential energy, we ask, “How will the bottom zipline pie charts be different from the top zipline pie charts?” If students struggle, we ask, “How will the speed of the bottom zipline compare to the top?” and “If the speed is less, why can we say the energy is also less?” followed by “If the energy is less, what should happen to the size of our pie chart?” Students recognize that the pie chart should be smaller to show less potential energy so we draw a smaller circle. That is, we can conceptually (rather than mathematically) represent different systems with different amounts of initial potential energy by using different-size pie charts. A larger circle represents more initial potential energy.
Given that students easily recognize the relationship between speed and energy, we revisit the connection between mass and energy by asking, “What evidence do you have that mass, as well as speed, also affects the kinetic energy of the zipline?” We allow students to share with their groups and encourage them to think about their investigations. The resulting discussion provides formative assessment and allows us to revisit any necessary concepts.
Assessment
After the lessons, we assess student learning by providing students with an exit ticket style assessment. We gave students the following assessment prompt: “Box A is sitting at the bottom of an angled conveyor belt in a factory. Another box, Box B, is placed at the top and slides down hitting Box A, moving it forward toward the next factory worker, but Box A stops before reaching the worker. What are two ways the factory can increase the kinetic energy of Box B as it approaches the bottom of the hill? How do these changes impact the potential energy of Box B at the top of the angled conveyor belt? Drawing a picture may help.”
Students who demonstrate strong understanding note that they can increase the height (angle) of the conveyor belt to increase the potential energy and they could also increase the mass of the box so that there is more potential energy to transfer into kinetic energy. Some students demonstrate that they are still struggling when they write the opposite of the previous responses such as decreasing the height or mass or when they can only indicate one change. For students who may struggle with reading or language, we sometimes draw the scenario for them, or even model the scenario for the class in the front of the room.
Conclusion
The zipline investigation provides an interesting hook to peak students’ interest and a manageable system in which to investigate kinetic and potential energy. Through such investigations students are learning more than just content. They are learning to think critically, problem solve, and work collaboratively. Such skills will benefit students no matter their future endeavors. •
Supplemental Materials
Katherine Carman (sciencechica101@gmail.com) is a chemistry and physical sciences teacher at Urbandale High School in Urbandale, Iowa. Jerrid Kruse is an associate professor in the School of Education at Drake University in Des Moines, Iowa.
Inquiry Lesson Plans NGSS Physical Science Three-Dimensional Learning