
feature
Using Summary Tables to Support Students’ Explanations of Science Phenomena
Science Scope—November/December 2022 (Volume 46, Issue 2)
By Kraig A. Wray, Jonathan D. McCausland, Scott McDonald, Amy Pallant, and Hee-Sun Lee
Students need support making sense of what they experience in online learning and web-based visualizations and simulations. One way to provide students with this support is through the use of summary tables as a means of scaffolding student discussions and helping them to make sense of class activities. In this article, we draw on the plate tectonics module as an example curriculum module for explanation purposes, but summary tables, as a tool, can and should be used with phenomenon-based teaching regardless of science discipline.
Using summary tables to support students’ explanations
Summary tables are teaching tools to support student sensemaking by breaking up student explanations into three to four categories consisting of (1) the activities (labs, videos, readings, interacting with simulations, etc.) they engage in, (2) observations or patterns from that activity, (3) the reasoning behind the observations or patterns, and (4) connections between patterns/observations and how they help explain the phenomenon. This structure provides a way for students to organize what they experience during class activities and connect their observations to the target phenomenon.
Although summary tables can be constructed individually or in small groups, they are intended to be public displays used to organize the thinking of the class about their activities as they relate to the target phenomenon—in this case, the future movement of Earth’s plates. We recommend constructing a single whole-class summary table for each unit in either paper form, on a white board, or projected digitally. This class-level summary table supports coherent talk among students and is a living document that gets amended based on student conversation. The class summary table can and should be changed as the unit progresses to reflect the class’s new and revised ideas. Should a teacher choose, individual student or small-group summary tables can be kept in paper or digital notebooks, but they should also be updated as student thinking and understanding changes in response to individual activities. It is essential that this table be prominent and dynamic. This will allow for changes in thinking over time and makes student thinking public. Table 1 is an example of a single row of a multirow summary table. Each column focuses on a different sensemaking opportunity—for example, observations and patterns—and each row is intended for one activity that helps explain a larger phenomenon. Therefore, the titles of the columns can be adapted to meet the needs of any unit because the general structure of the summary table stays the same. With that said, it is important to remember that a single summary table should be used across an entire unit, and each row should be used to make sense of individual activities that make up the unit.
Activity
- What kind of patterns/observations do we see?
- What is causing these observations/ phenomena?
- How does this help us understand what Earth will look like in 500 million years?
Activity 2: Convergent cases
- More earthquakes are at boundaries involving ocean plates than continent to continent boundaries.
- Ocean plates go deep under other plates because of the different density of the plates— oceanic plate material is more dense.
- Existing continents can subduct into the Earth and make new mountains, changing Earth’s surface.
Helping students make sense of activities
Using the summary table as a framework, sensemaking is broken into two main phases. These phases push students to first describe “what they learned” and then answer “how does this help us think about our essential question or puzzling phenomenon” (Windschitl, Thompson, and Braaten 2018, p. 190). When talking about a single cell within a summary table, the teacher should hear from as many students as possible, get students to compare and contrast ideas, and make decisions about what evidence means or how ideas are supported by evidence. These discussions help students decide what evidence is important and how that evidence helps explain the driving question or phenomenon.
It is important that during sensemaking discussions students are encouraged to use their own words to communicate their ideas. The goal of sensemaking discussions is to get students to share their science ideas, not assess them for using scientific language. This has important equity consequences because science requires learning both new ideas and more technical language and can lead to the marginalization of students and emergent multilinguals (Brown 2019).
To scaffold sensemaking discussions, teachers must guide students by “pressing” and “probing.” In other words, teachers should ask students to clarify or develop their ideas so everyone, including teachers and students, understand what each other are thinking (Windschitl, Thompson, and Braaten 2018). Examples of talk moves used by teachers with summary tables are listed in Table 2 with examples from participant teachers in italics.
During the public sharing, teachers can hear student ideas (and students can hear from one another) to see if they are asking related questions, seeing important patterns in the data, and evaluating if their arguments make sense related to the bigger picture (i.e., the driving question and phenomenon). After public sharing, teachers can then formatively adjust and adapt future lessons to address student questions and help them develop a more robust explanation by providing more or different evidence through future activities.
Before beginning a unit, we recommend teachers complete their own version of a summary table specific to the unit they are going to be teaching. This practice forces the teacher to think about the purpose of individual activities in relation to the anchoring phenomenon as well as to think about the relationship between the lessons across the entire unit. This also helps to plan the questions a teacher can have in their back pocket (Windschitl, Thompson, and Braaten 2018) to support sensemaking and engage students in scientific talk.
Using summary tables to make sense of simulations
We use an example from the Plate Tectonics Module, a curricular module created by the Concord Consortium (2019) in collaboration with The Pennsylvania State University (see link in Online Resources), which consists of five scaffolded activities that provide students with opportunities to investigate data visualizations and simulations in order to observe and explain how variables impact plate motion and the resulting surface features and events. The data visualization tool called Seismic Explorer (SE; see link in Online Resources; see also Figure 1) uses real-time USGS data sets documenting earthquake depth and magnitude as well as historic data of volcanic eruptions (Smithsonian/USGS 2013). The simulationTectonic Explorer (TE; see link in Online Resources; see also Figure 2) models an Earth-like planet that allows students to simulate and observe plate motion and interactions along plate boundaries and the consequences in an accelerated time frame. Students can change the number of plates on the surface, placing continental crust within a plate, choosing the direction of plate motion, and choosing each plate’s relative density.
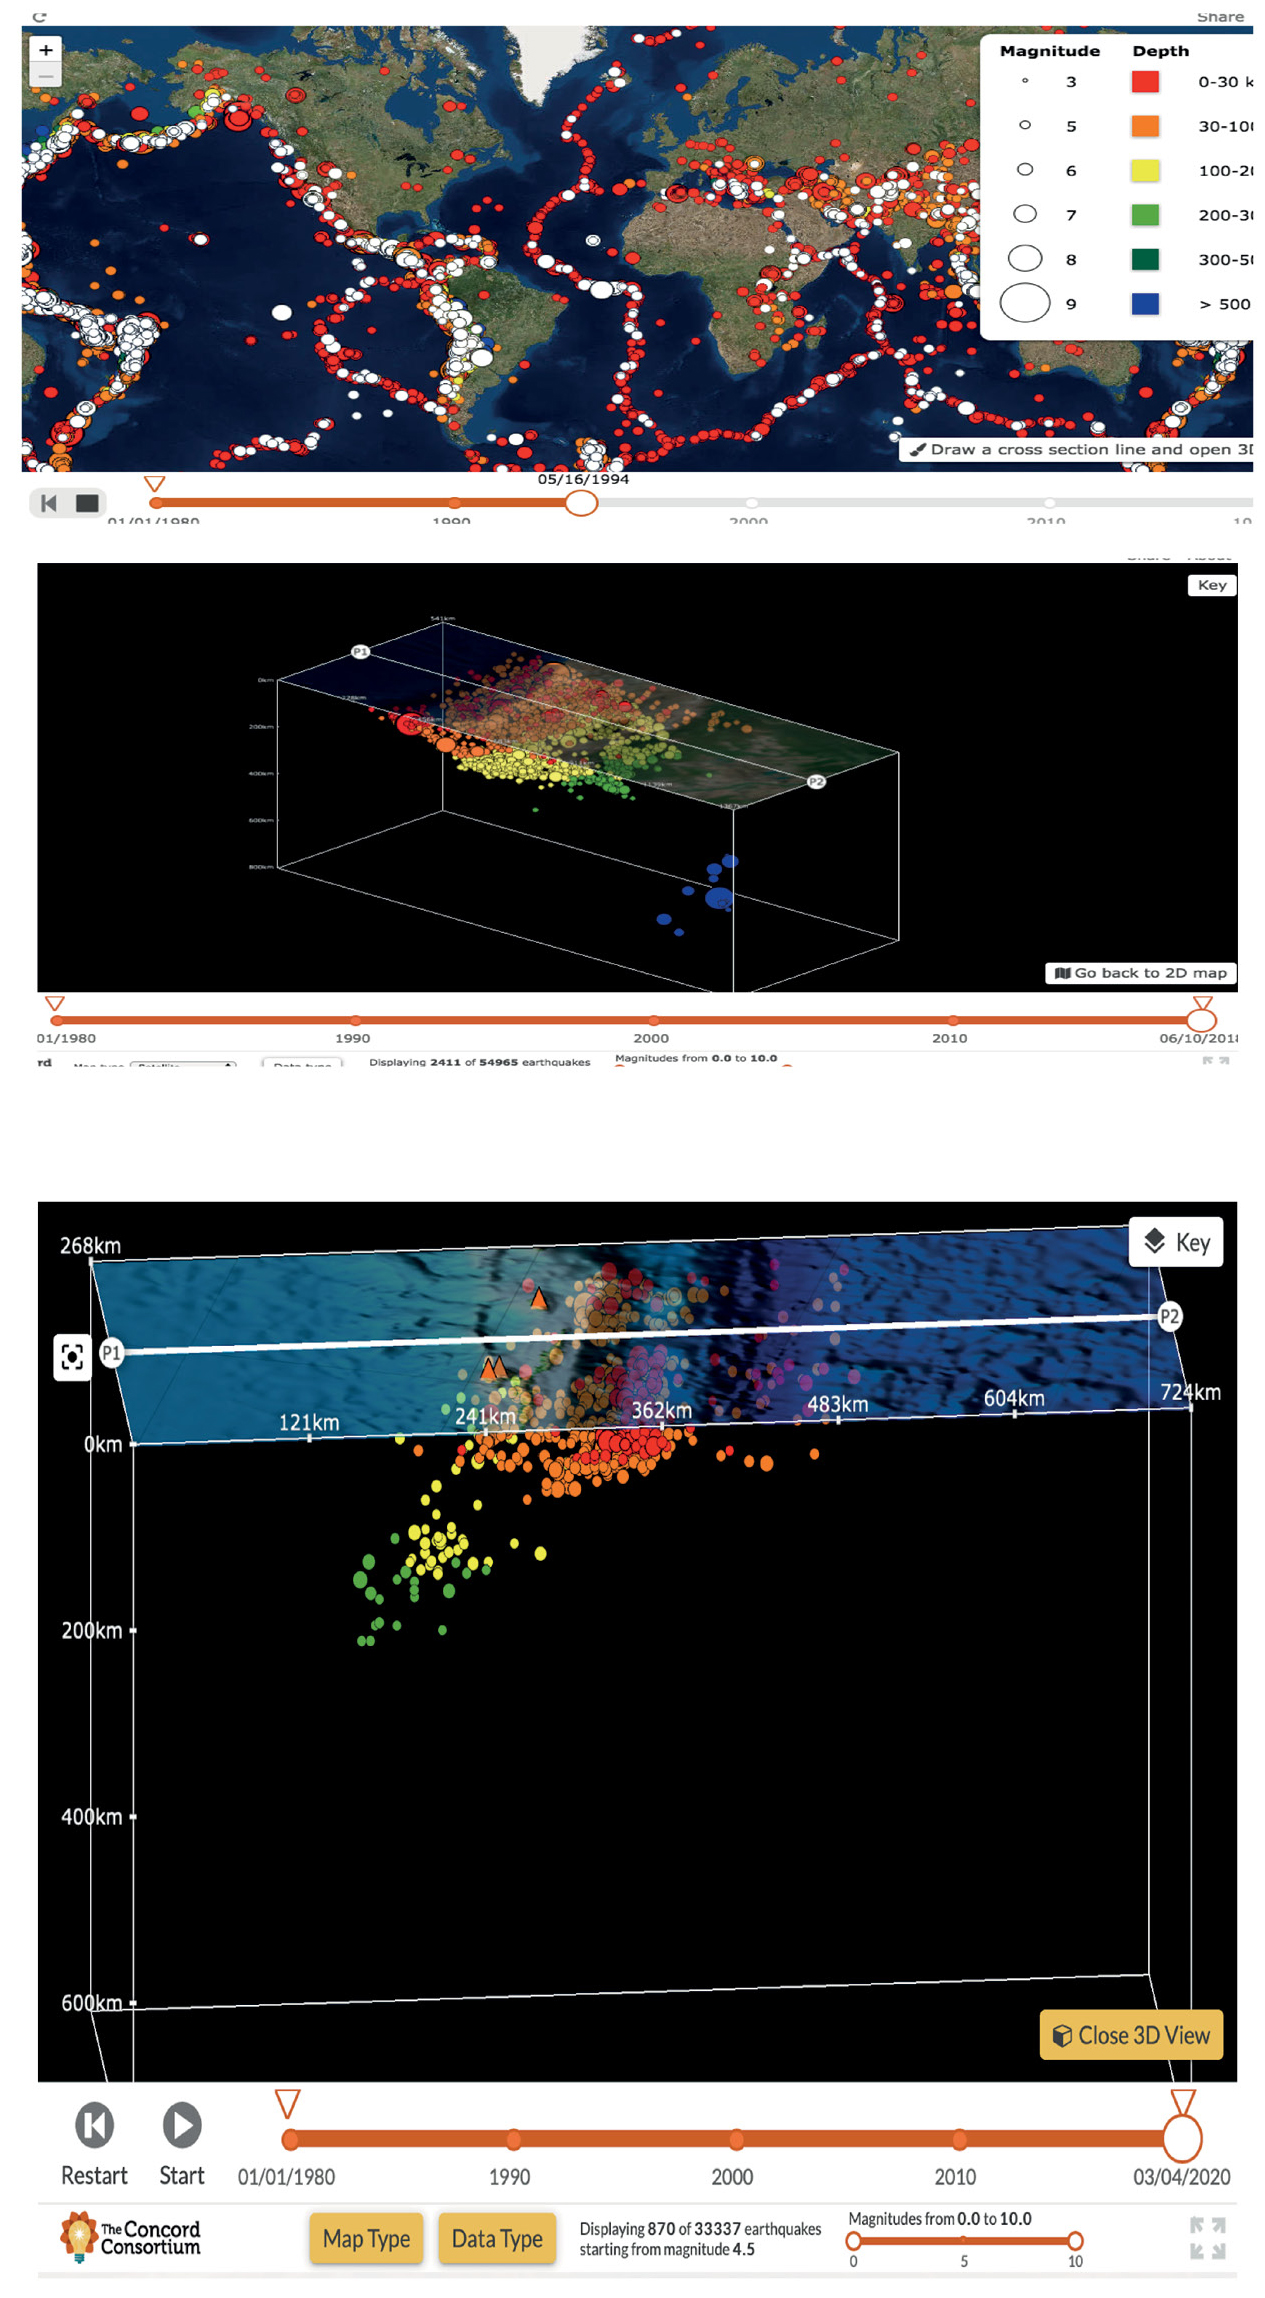
Seismic Explorer. TOP: Main view on the left and cross section tool on the right. Students have the option to select on the main view where to construct the cross section, essentially giving them access to a cross section they can rotate and view at different angles at any location on earth. BOTTOM: Sample cross-sectional view of the Aleutian Island chain (Concord Consortium, 2019).
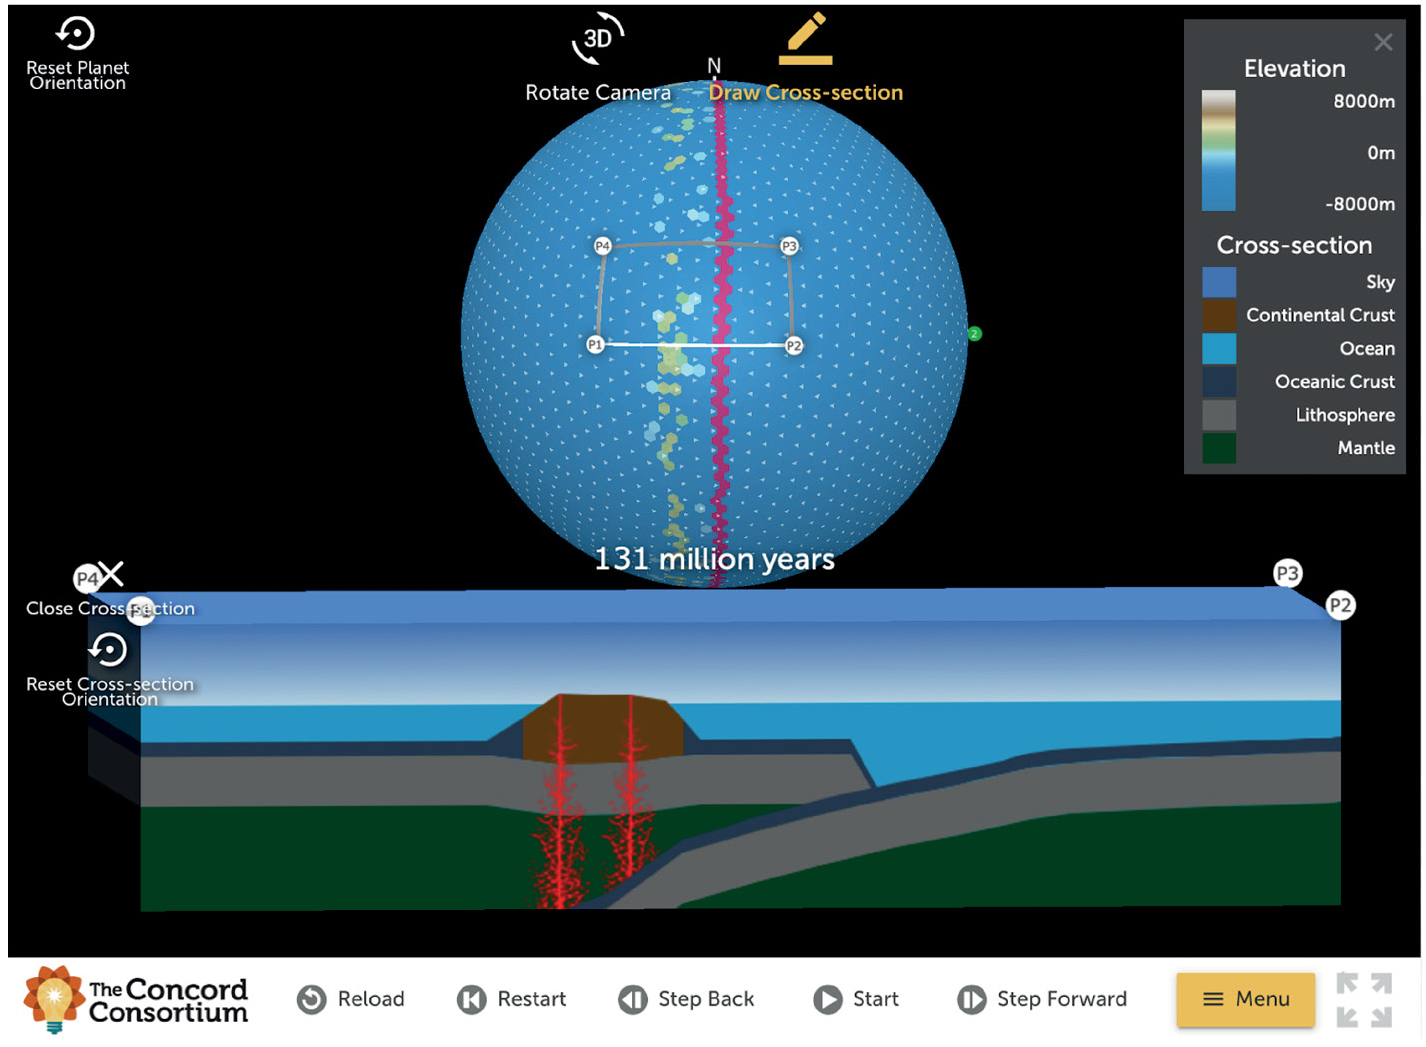
Tectonic Explorer. Students can create land masses, adjust relative density, and plate motion to investigate plate interaction and the resulting landforms. Sample student re-creation of the Aleutian Island chain (Concord Consortium 2019).
TE and SE allow students access to phenomena that are typically beyond school hands-on lab activities and help them articulate claims about phenomena that are supported by reasoning around evidence derived from the visualization and simulation. SE and TE in the Plate Tectonics Module work together to help students produce more robust explanations of phenomena because students can use the simulation to test their claims based on patterns and observations from the large data sets represented by visualizations—for example, looking for patterns of volcano formation near an ocean trench as indications of converging plates and a descending slab. Eventually, when students’ understandings are made public through summary tables and teachers’ questions, a context can be created for three-dimensional learning as students are engaged in grappling with data sets (science and engineering practice [SEP] 4) and modeling (SEP 2). In this case students are developing disciplinary core ideas around plate tectonics and large-scale systems (Earth and Space Sciences [ESS] 2B), while considering patterns (crosscutting concept [CCC] 1).
Implementation example
Many of the practices described within this article were seen during an implementation of the online Plate Tectonics Module. Stacy, a middle school science teacher, focused on having her students proceed through the module, use the tools to explore their own questions independent of those in the module, and collect evidence to be used in an explanation for the driving question of the module, “What will Earth look like in 500 million years?” While the students worked through the module at their own pace with a partner on individual laptops, Stacy chose to include time for students to create explanatory models in groups on white boards at their tables, to share out ideas, to engage with one another in sensemaking discussions, and to work to apply what they learned in the modules toward answering the driving question. Stacy set up her class summary table to focus on “what patterns were observed,” “what might be causing these patterns,” and “how does this help us explain what the Earth will look like.” These labels differ from what was discussed previously but remain in the spirit of supporting sensemaking; they are responsive to the context and therefore are an acceptable way to set up the summary table. As an example, after completing Activity 2, which includes SE and TE, a large-class discussion took place to begin to fill out that row of the summary table (see Table 3).
After ensuring each group had something to share by circulating between table sets of four to six students (Stacy had two to three pairs at each table set), Stacy began the class summary table discussion about earthquakes and volcanoes by saying, “What patterns did we observe?” Stacy had established a culture of openness and scaffolded opportunities to collaborate with classmates through small-group discussion and large-group presentations. As a result, many students felt comfortable sharing ideas and talking about each other’s ideas. Each idea was negotiated as a class and then included in the summary table in the same words and phrasing the students used. As ideas waned, Stacy, wanting to ensure certain patterns were included, asked more specific questions such as “What did the data from the GPS stations show?”—referring to the data representation from the first activity. Additionally, she brought ideas into the conversation that she overheard students talking about during their small-group work time: “What else about the plates? You all mentioned Pangaea a lot, Harry.” She used this talk move as a way to narrow the students’ thinking and to try to elicit ideas they may have regarding Pangaea and plate motion. Both of these moves helped her formatively assess her students thinking and surface all important ideas into the public space for discussion. It also helped her position as many students as possible as being authorities in science, an important consideration for addressing equity in her classroom (Faller 2018).
Many of the students shared observations and causes but were sometimes generic in the language they used to articulate their ideas. For example, a student stated a pattern about plates: “They were tighter.” In keeping with classroom norms, Stacy pressed and probed student responses—for example, saying, “What do you mean by ‘they’?” and “When you say ‘tighter,’ what do you mean?” She did this not to correct science vocabulary, but to maintain the expectation that students be clear in describing their ideas so that everyone could understand them. In this way, Stacy was offering students an opportunity to learn science concepts before introducing science language that could act as a barrier to her students’ participation and learning. Only after students showed command of scientific ideas in their own language would Stacy introduce the scientific language.
Finally, when filling out the last column of the summary table, Stacy restated the column title and followed it with, “Essentially, what claim can we create?” The goal was to focus on making a claim that is supported by evidence and that addresses the driving question of “What will Earth look like in 500 million years?” Through discussion, the class developed the claim that “the Earth is made up of moving pieces” for the first activity. Rather than leaving it as a claim, Stacy pressed the class by asking for the evidence collected so far to support this claim. With the first row of the summary table completed, students followed up by completing a claim, evidence, and reasoning (McNeill and Krajcik 2008) journal entry that began with the claims the class made in the summary table based on the evidence they collected throughout the activities.
Using summary tables to support Earth science learning
Summary tables are valuable tools for teachers looking to help students construct explanations across multiple class activities; however, the previous example highlights a common challenge for areas of science like ESS teaching—one where the phenomena students are working to explain occur on a geologic time scale, size, and distance scales, or involve complex systems that cannot easily be broken into smaller concepts and connected activities. In this case, students tend to think of mountains, deep-water trenches, and island arcs as surface features of the Earth rather than as the evidence of the dynamic nature of Earth’s interior because their motion can’t be directly observed. Earthquakes and volcanic eruptions are observable phenomena, but they are not subject to experimental or in-class investigations in the typical sense. While this challenge impacts the areas of ESS, other areas of science dealing with large-scale systems also struggle with similar challenges. Summary tables as a tool are uniquely positioned to support students in making connections across evidence that is at different scales and levels of complexity.
Conclusion
Summary tables are productive ways to help support students’ integrative thinking across multiple activities in a science unit, but they require teachers to think about those activities as sources of evidence for a larger explanation. When paired with teacher and peer talk moves, summary tables can help students in maximizing their experiences by creating opportunities for sensemaking and organizing activities. Creating a classroom community willing to critically engage with one another’s ideas while having access to high-quality online tools is a powerful way to support students’ learning science (see link to Tools for Ambitious Science Teaching in Online Resources).
Acknowledgment
This material is based on work supported by the National Science Foundation (NSF) under Award No. DRK-1621176. Any opinions, findings, and conclusions or recommendations expressed in this publication are those of the author(s) and do not necessarily reflect the views of NSF.
Online Resources
Plate Tectonics Module—https://learn.concord.org/geo-platetectonics
Seismic Explorer—http://seismic-explorer.concord.org
Tectonic Explorer—https://tectonic-explorer.concord.org
Tools for Ambitious Science Teaching—https://ambitiousscienceteaching.org/tools-face-to-face
Kraig A. Wray (kraig.wray@gmail.com) is director of instruction and a science teacher in Pittsburgh, PA. Jonathan D. McCausland (jdmccausland@nmhu.edu) is an assistant professor of STEM Education at New Mexico Highlands University in Las Vegas, New Mexico. Scott McDonald (smcdonald@psu.edu) is a professor of education in the Department of Curriculum and Instruction at Pennsylvania State University in State College, Pennsylvania. Amy Pallant is a senior research scientist at Concord Consortium in Concord, Massachusetts and Hee-Sun Lee is a senior research scientist at Concord Consortium in Emeryville, California.
Crosscutting Concepts Disciplinary Core Ideas NGSS Phenomena Science and Engineering Practices Three-Dimensional Learning Middle School