
special issue
The Science of COVID-19
An Online Course for Teachers and Their Students
The Science Teacher—January/February 2023 (Volume 90, Issue 3)
By Matthew Johnson, Tiffany Lewis, Kit Martin, Amber Cesare, Anthony Schmitt, Eugene Lengerich, Kristin Bittner, and Chris Divyak
In early 2020, we were introduced to a novel virus that would change our world for the next several years. SARS-CoV-2, the virus that causes the disease known as COVID-19, originated in Wuhan, China, and quickly spread across the globe. It created a global pandemic and forced all of us to make decisions about where we went, whom we saw, and what other actions we took to avoid contracting or spreading the disease.
In the classroom, teachers were forced to quickly change their teaching styles to ones that were compatible with teaching remotely, and then they had to learn how to teach in in-person and remote hybrid settings. For those teachers who rely on groupwork and hands-on activities, this change was difficult. It was then that most of these teachers were searching the internet for high-quality materials that they could use remotely.
Despite the countless problems COVID-19 caused, it created an opportunity for students to learn about how science happens. Rather than learning about phenomena, cycles, and descriptions of models that were debated, negotiated, and concluded years ago, COVID-19 offered an opportunity for students to learn about the practices scientists use to create knowledge about the virus and disease while learning disciplinary content. Despite Steven Shapin’s urging that science ought to include a “warts and all” picture of the process of knowledge making (1992, p. 28), students rarely get the chance to look closely at the methods, assumptions, and evolving nature of the field’s understanding of phenomena.
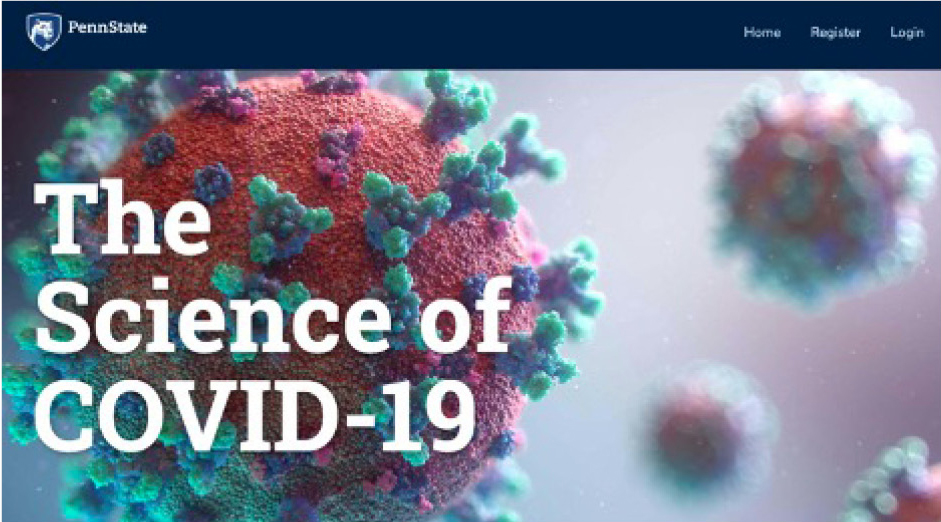
We, a group of science educators at the Center for Science and the Schools (CSATS) at Penn State University, formed a team with experts in science and instructional design to write, pilot, and revise a free online course for high school teachers to use with their students called The Science of COVID-19 (Figure 1). We did this to create instructional materials that teachers could teach in remote or hybrid situations, especially for schools without resources to pay for curriculum. We also wanted to highlight the authentic practices scientists are currently using to learn more about SARS-CoV-2 and COVID-19 and to tie this work directly to disciplinary content teachers need to teach in their classes.
The free, online course available at http://covid19.csats.psu.edu.
The course described in this article has three modules, each delineating a dimension of epidemiology as described by Straif-Bourgeois, Retard, and Kretzschmar (2014). The first module takes the perspective of virology and looks at the biology of the disease and viruses as they relate to individual bodies. The second module takes the perspective of epidemiological modelers and focuses on how incubation periods and other temporal considerations affect the spread of the disease. The third module takes the perspective of public health preparedness experts and looks closely at how the disease affects communities, particularly vulnerable populations.
We developed the course in collaboration with an instructional designer and a front-end web developer. Then nine secondary science teachers from a diverse set of geographical, content, and demographic contexts pilot tested the course. Each of the teachers completed a feedback survey and participated in an hour-long interview to discuss strengths and necessary modifications of the course. We incorporated those revisions and launched the course to the public in early February 2021. As of this writing, 3,310 students, teachers, and interested citizens have registered for this course, which takes roughly 2–4 hours to complete.
Those who register for the course as “teacher” get access to additional resources, including a teacher implementation guide, student and teacher versions of handouts to use in conjunction with the course, and student and teacher versions of quizzes for the modules to use for assessment purposes. The course invites teachers to have discussions with their classes about the several embedded activities, ranging over topics such as what the data mean, trends that occurred over different time periods, and recommendations about nonmedical interventions. These discussions are open-ended and require students to apply their understanding of disciplinary content while engaging in science and engineering practices such as developing and using models, using mathematics and computational thinking, and engaging in argument from evidence (NGSS Lead States 2013).
Module 1: Virology
The first part of this module puts the student in the position of a virologist who is warned that a novel virus is infecting people in a hospital. Students start by learning about how scientists characterize viruses. This involves understanding the major categories of viruses, starting with whether their primary genetic material is DNA or RNA. From there, students take the partial sequence of a “sample” of RNA collected from the novel virus and use two online tools to analyze it. First, they use the Fuzzy Search DNA tool to compare the similarities of the unknown sequence against other common viruses. They find that the sequence is quite similar to the spike protein (also known as S protein) from the SARS-CoV virus that caused an outbreak in Hong Kong in 2003.
Next, students can analyze electron micrographs of the unknown virus (Figure 2, left). The module calls students to notice the structure of the virus, such as the projections coming from the viral capsid (coat). They compare this image to other known viruses and confirm that in addition to being genetically related to SARS-CoV, the unknown virus also looks similar. After verifying through multiple methods that there are significant similarities between the unknown virus and the SARS-CoV virus, students then use a more sophisticated bioinformatics tool known as the Basic Local Alignment Search Tool (BLAST; Figure 2, right). Unsurprisingly, the students find a 100% match with SARS-CoV-2, the virus that causes COVID-19. However, the course helps them recognize that in late 2019, the entry for SARS-CoV-2 did not exist but the sequence was 79% identical to SARS-CoV. The similarity in the sequences led to the naming, but it also provided a basic understanding of the unknown virus based on what we know about other coronaviruses.
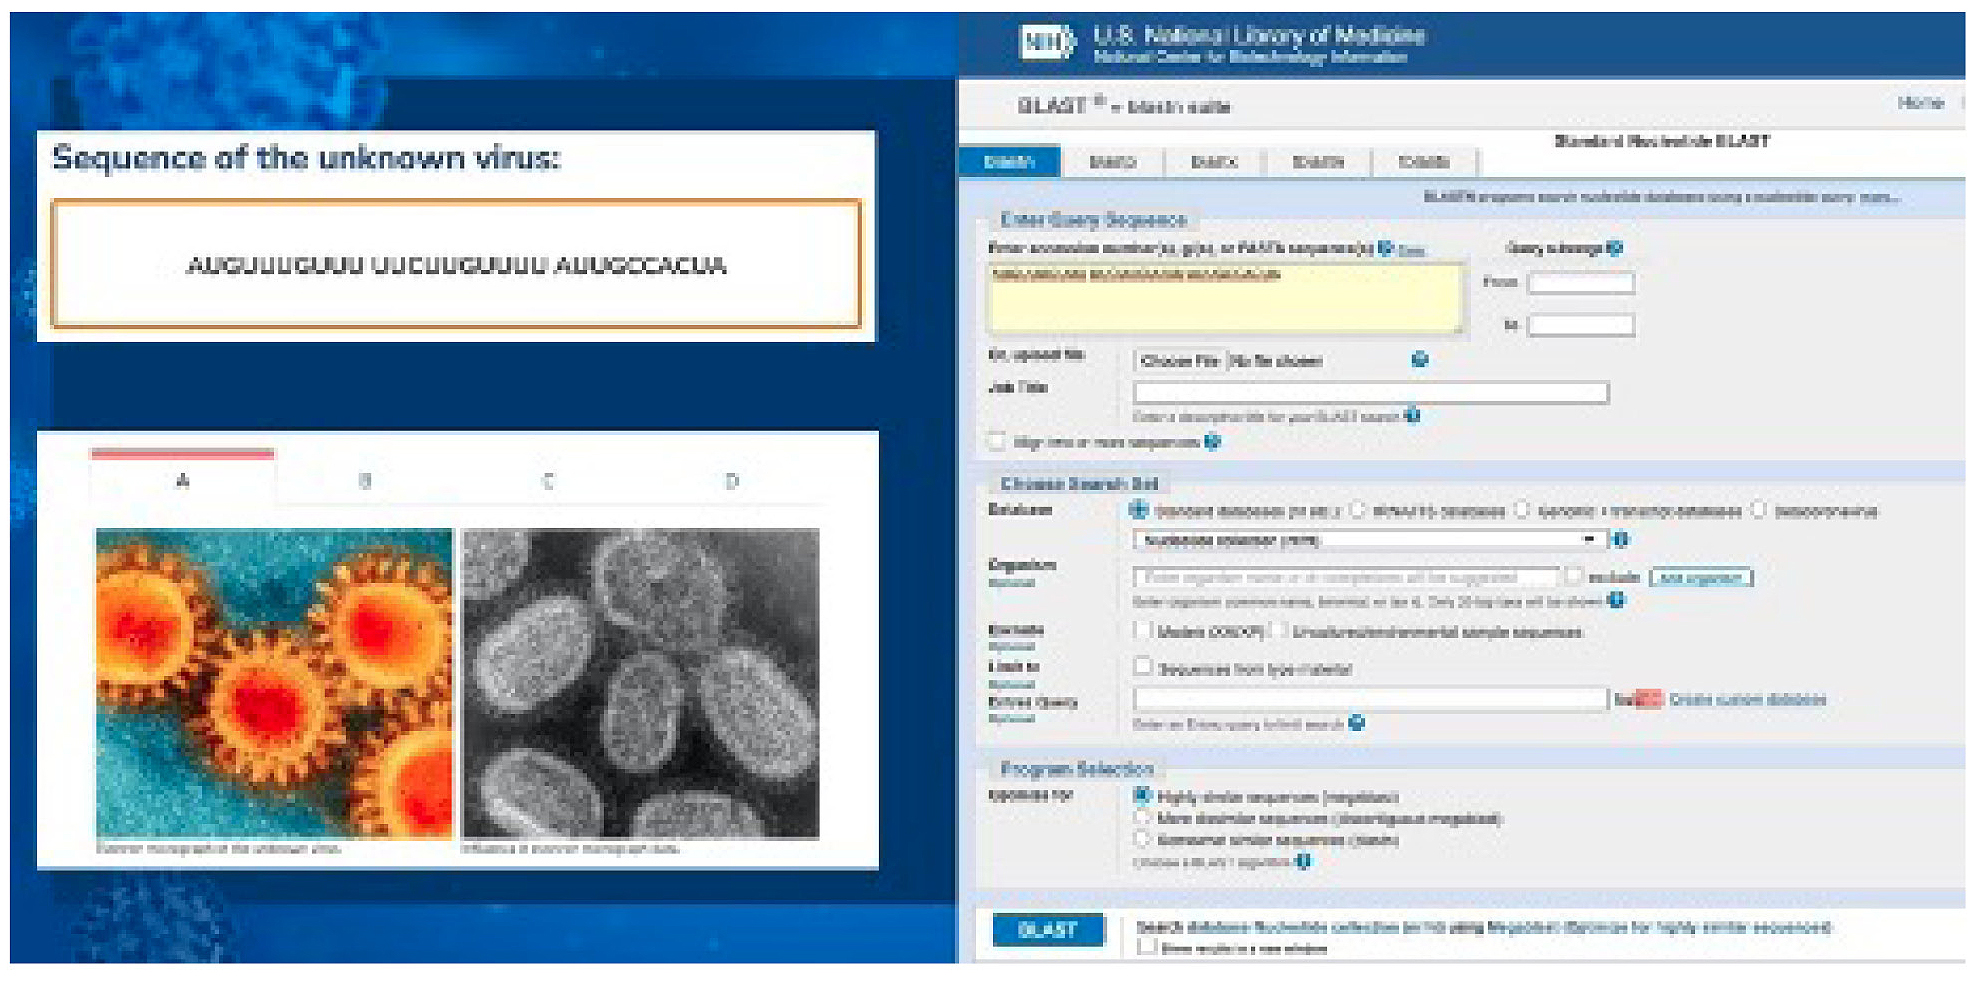
On the left is a comparison of electron micrographs of the novel virus and a known one. On the right is the BLAST tool for investigating the homology of novel sequences to ones already characterized in the database.
The second section of this module helps students understand more about the structure of the virus. The first thing students learn is that SARS-CoV-2 is an RNA virus and has no DNA. They also learn that it is surrounded by a viral membrane that can be easily disrupted with soap. Last, the module highlights the S protein on the outside of the capsid and that the S protein is what allows the virus to infect cells. To understand how the virus behaves, students must have a strong understanding of the “central dogma” of molecular biology, which describes the transfer of information from DNA to RNA through transcription and from RNA to protein through translation as well as that information cannot be passed from protein to nucleic acid (Crick 1970). Understanding the central dogma is also important to virtually every introductory life science course. The S protein is structurally similar to angiotensin converting enzyme 2 (ACE2) and gains entry into the cell by the ACE2 receptor through induced fit (Koshland 1995; Raghuvamsi et al. 2021), described in AP Biology and often compared with the lock and key theory (Koshland 1995). The central dogma is key to understanding how doctors diagnose COVID-19 using reverse transcriptase quantitative PCR, because if viral RNA is present, it gets “reverse transcribed” into DNA. That DNA replicates several times and must be detected to provide a positive test. This process works even with a small amount of RNA, and if no RNA is present, the test comes back negative.
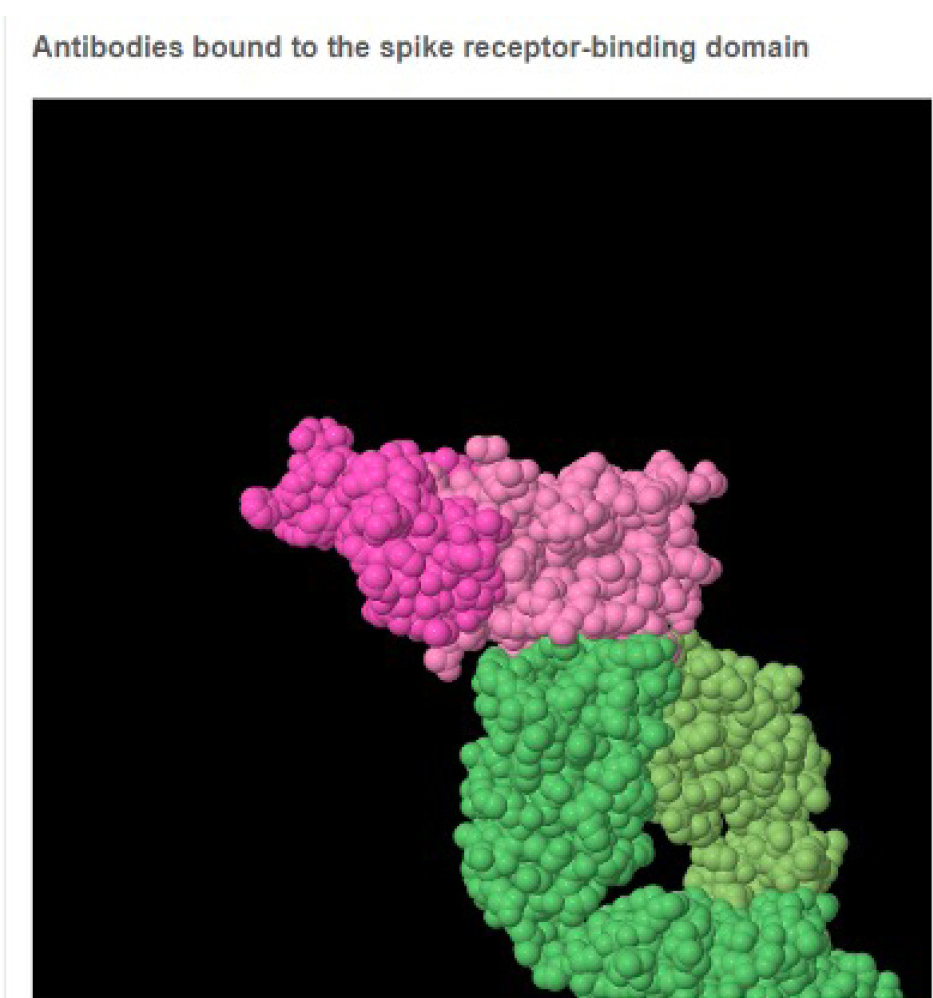
The last part of the module focuses on vaccine development and clinical trials. To understand vaccines, it is important to understand how antibodies “neutralize” the virus by physically blocking the S protein from interacting with the ACE2 receptor. In order to do that, mRNA vaccines introduce a transcript for the S protein (without the rest of the virus) so the body develops antibodies to neutralize any future SARS-CoV-2 virus it interacts with. However, through frequent mutation and short generation times, natural selection causes viruses to change quickly. Vaccine developers target a specific part of the S protein that interacts directly with the ACE2 receptor. That area, the receptor binding domain, is unlikely to mutate much because its ability to interact with the ACE2 receptor depends on it not changing! The students use JMOL simulations (Figure 3) to clearly see the importance of virologists in understanding basic life science crosscutting concepts like the relationship between structure and function and the disciplinary core ideas surrounding mutation and natural selection.
JSMol model used to look at the interaction between the S protein and the ACE2 receptor.
Suggestions for teaching
When a person registers for the course as a teacher, there is a “Teacher Resources” section that includes student handouts for each module and copies of the end of module and course quizzes. Teachers can print or deliver these handouts electronically so they can review students’ answers. We suggest that teachers use the online version of The Science of COVID-19 with their students not as a stand-alone activity but as an in-class way for students to learn or apply science concepts. Ideally, students should work in pairs to complete the handouts with the teacher encouraging discussion of the course content. Classes should complete the course in sections, with checkpoints where the class comes together to discuss what they learned before moving on. For example, it would be appropriate for students to work through Lesson 1: A New Virus and complete Activity 1: Identifying a virus, then pause to check in with the class before moving forward in the lesson. Although the lessons and activities build off one another, the lessons could be easily removed and modified for students who need accommodations, such as additional time, while still covering the material. We should note that all of the lesson content was programmed by an instructional designer who followed the current guidelines for web content accessibility.
During Module 1, students get the opportunity to look at real genetic sequences and learn how to use freely available tools to either identify the source of the sequence or find sequences that are homologous (similar) to it. Since sequence data is freely available online and the two tools described in this course are online (BLAST and Fuzzy Search), teachers could develop a bioinformatics extension lesson to look more closely at genes of interest or in homology between related species. For example, students could explore the idea of functional similarity in homologous genes by completing BLAST searches or considering the question of the SARS-CoV-2 origin by comparing coronavirus S protein sequences across various organisms.
To understand the mechanism of infection by the S protein binding to its receptor (the ACE2 protein), students must have a strong understanding of the structure and function crosscutting concept (NRC 2012). This concept is also important for considering the way our antibodies work and how researchers design vaccines. The central dogma of biology is crucial to understanding the mechanism for viral infection and how variations in the genetic code affect the three-dimensional structure of the protein (e.g., the S protein of SARS-CoV-2 is slightly different from SARS-CoV, which improves its ability to infect human cells). Teachers can use the section “How is the S protein created for the virus” to teach students the concept of the central dogma with a practical example, or students could use the course to review this information later as a culminating activity. Additionally, for more advanced learners and courses, there is an optional “bonus content” section that covers how PCR is used for COVID-19 testing. Finally, in Activity 3: How do antibodies interact with the S protein of SARS-CoV-2, students use the Protein Data Bank to consider how antibodies interact with surface proteins to prevent infection. Teachers can use the protein data bank to have students investigate the structure of several different proteins to investigate their structure/function relationship.
Module 2: Epidemiology
The second part of the framework for pandemic education described by Straif-Bourgeois, Retard, and Kretzshmar (2014) suggests that we should teach about the epidemiology of disease with a focus on incubation periods and other temporal considerations for the spread of the disease. Our course approaches this aspect of teaching the complexity inherent in the spread of COVID-19 using agent-based models (Wilensky and Resnick 1999). This section of the course allows students to use NetLogo, a free web-based tool useful for using agent-based models to explore and understand complex phenomena (Wilensky 1999). Modeling is important in this context because researchers cannot intentionally get people sick as a positive control, so they use models and simulations based on the current data to study the spread of a disease. Students get a chance to see how systems with multiple interacting variables present difficulty in research that is not easily overcome through controlled experiments. The first part of Module 2 looks closely at the models epidemiologists use to conceptualize the disease and consider which factors affect viral spread. The second part allows students to compare how using several nonmedical interventions (e.g., social distancing and mask wearing) versus using no interventions would affect transmission. Students can collect, analyze, and use data in class discussions that highlight the practices of developing and using models, engaging in argument from evidence, and using mathematics and computational thinking (NRC 2012; NGSS Lead States 2013).
The first part of this module has students consider the SIR model of disease spread (David and Lang 2001). This model considers the number of susceptible (S) people, the number of infected (I), and how many have recovered (R). Disease spreads only when a susceptible person encounters an infected person. The course introduces students to exponential growth to conceptualize spread at the beginning of the pandemic. Then it explains how the number of susceptible people starts to decrease, the curve stabilizes, and there are no more people to infect.
In the first investigation, students use a NetLogo model (Figure 4, top) to investigate the effect of increasing the number of those susceptible by the speed at which a population would get 100% infected. To do that, we reduce the chance of recovery to 0% (e.g., HIV). Since the agents in the model are programmed to move around randomly, the simulations are all intentionally slightly different, an aspect that more closely mimics reality. For this reason, students run multiple simulations and collect data within the course. The course then generates a scatterplot for students to identify patterns in the data (Figure 4, bottom). The primary takeaway is that the disease spreads much more slowly when there are fewer susceptible people in the population.
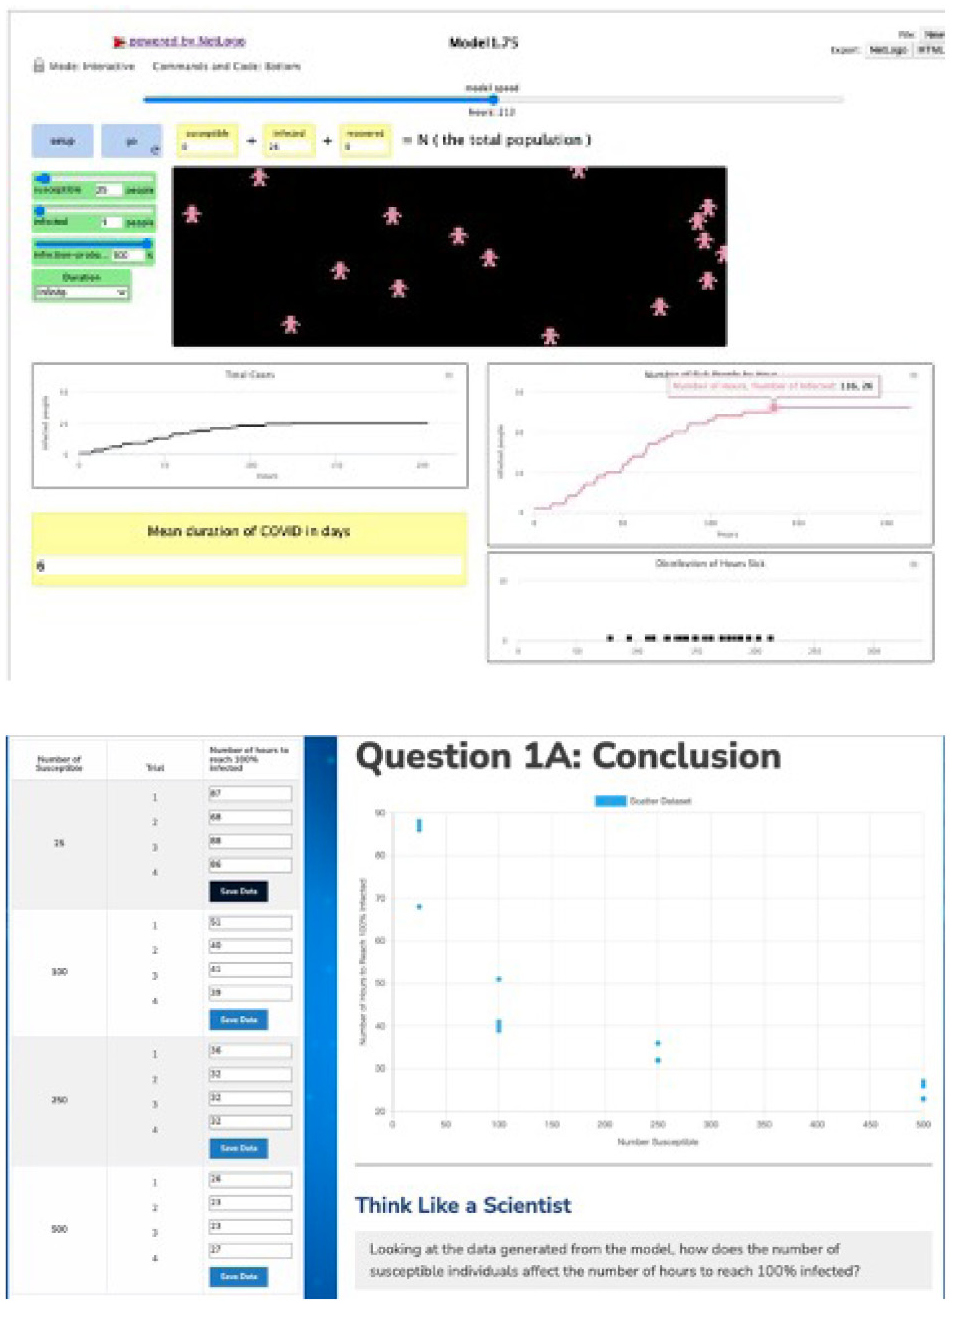
The NetLogo agent-based model on the top investigating the factors affecting the SIR model. On the bottom is the scatterplot developed by running multiple simulations.
The next part of the investigation considers the effect of increasing the number of infected people in a population. Going through another similar series of simulations helps students identify that the speed of transmission occurs much faster when there are more infected people to start with. The last part of this investigation helps students ask the question “How does the probability that someone gets infected affect the viral spread?” For this stage, students run several simulations to compare the effect of decreasing the odds that interactions between a susceptible agent and an infected one lead to transmission. Unsurprisingly, low infection probabilities decrease the speed at which the population is infected because not all interactions cause an infection.
The culmination of the first part of this module is to help the students think broadly about the factors that affect the virulence of SARS-CoV-2, or what epidemiologists call R-naught (R0). The three main factors students learn that increase R0 are 1) the number of susceptible people, 2) the likelihood of an infection when a susceptible person encounters an infected one, and 3) the length of time someone is infected. Understanding this helps transition to the next part of the module that considers interventions. Students will learn that if we can determine ways to decrease susceptibility, decrease the infection probability, or decrease the amount of time someone is infected, then we can decrease the spread of the disease.
The second part of this module simulates the ways epidemiologists model the effectiveness of interventions. Three of the interventions students investigate are isolating during infection, social distancing, and wearing masks. In this section, they use a different NetLogo model, one that utilizes a “treatment” and compares it to a “control.” By doing this, students can compare simulations about the effect of an intervention such as social distancing and compare it to a simulation without social distancing to predict the effectiveness (Figure 5). This part of the course really gives insight into why professionals might use models and highlights how important the assumptions are to the accuracy of the predictions. For example, the results of the models vary a lot when the effectiveness of masks and the infection probability change. Therefore, it is important for students to find the most accurate data published about assumptions like this, while considering that those assumptions are also evolving as researchers do more research in the field to improve our understanding and, in turn, improve our models.
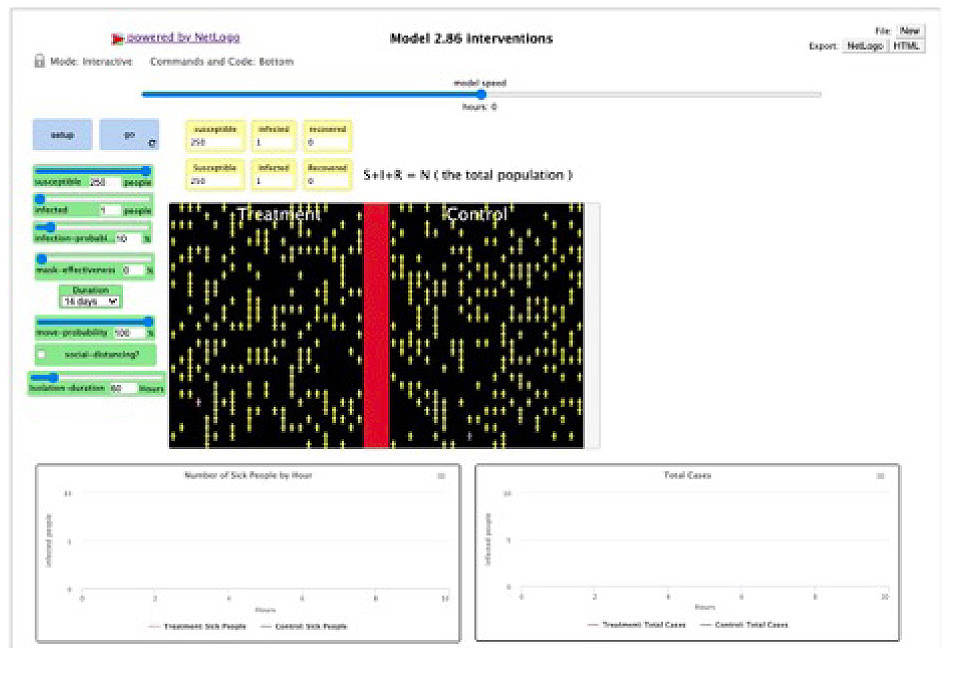
The second NetLogo model allows students to compare the effect of interventions and compare them to the status quo.
These interventions are not perfect, and they rely on people in society following the recommendations. Therefore, those who make policy recommendations must account for both the effectiveness, negative outcomes of implementation, and what people are willing to do. For example, to eliminate COVID-19, a government could have declared that everyone had to stay home for one month without going outside for any reason. In that time, some would get sick, some would die, and some would recover, but theoretically COVID-19 would not be able to be transmitted out of the homes. But no reasonable society would do that because people need to eat, work, and get medical attention. That’s why policy decisions should be both effective and acceptable.
Suggestions for teaching
The use of the epidemiological models in this section of the course provides a rich set of activities for students to engage in science practices (e.g., developing and using models, engaging in argument from evidence, and using mathematics and computational thinking), learn about crosscutting concepts (e.g., patterns; cause and effect; scale proportion and quantity; and systems and system models) (NRC 2012; NGSS Lead States 2013), and learn disciplinary content about disease spread. Module 2 would be appropriate for a general health course, a public health course, or even an example of mathematics applied to real-world scenarios. The content of this module provides an opportunity for interdisciplinary work within or across courses. Students from a science or health course could be paired with a mathematics student to complete the module together. Students do not need to complete all the models and investigations to understand disease spread; therefore, Module 2 could be modified as an accommodation for some students. For example, students could complete the first SIR model in Activity 1 to understand how disease spreads through a population, or they could simply be provided with the data to analyze and make an evidence-based claim.
Throughout the course of the pandemic, masking was a controversial topic, and many studies were released about the relative effectiveness of different mask styles and masks in general. Classroom discussions can be held that have students make claims about evidence. For example, in Investigation 5: Wearing face masks, students could ask questions about mask effectiveness and use the model to make claims about mask wearing based on evidence from analyzing and interpreting the graphs generated by the model. A small-group assignment we recommend is to develop a presentation using data derived from the models that positions students as public officials making recommendations for disease spread. Using data from the modules, students could be tasked with recommending policy that is highly effective but also minimizes the number of interventions. This assignment would be an exercise in persuasive writing, speaking, or both and would engage students in argument from evidence as they try to convince their class that their plan is the best given their context.
Module 3: Public health preparedness
The third category from Straif-Bourgeois, Retard, and Kretzschmar’s (2014) framework is to teach about the impact of disease on communities, especially those who are marginalized. We developed this part of the course with help from experts in public health preparedness. Their job is to help communities prevent, quickly respond to, and recover from health emergencies. Professionals in this field work within specific contexts and identify and support vulnerable populations.
It is in the third module that students look more closely at how the pandemic affects their local communities. Very little of the current science curricula taught in schools involves students looking at local phenomena. We feel it is important for students to consider the phenomenon of the COVID-19 pandemic through both a global and local lens. Our goal here is to help them understand how the pandemic affected (and may still be affecting) their area, identify those most at risk from COVID-19, and understand there are organizations and programs that are trying to support those vulnerable populations, including organizations teenagers can join to help those who need help the most.
This module is broken down into three activities. The first two are based around the idea of “flattening the curve,” a concept that was popular at the beginning of the pandemic. The goal of this approach was to reduce the pace and extent of infections so we did not overtax our healthcare system (Thunström et al. 2020). The dashed line in Figure 6 represents the overall healthcare capacity. The curves represent the number of people who need hospital resources. The red curve that rises above the line represents people without protective measures, while the yellow curve that stays below the line represents people with protective measures. Importantly, this diagram is not a global- or national-level model because it is irrelevant if there are excess hospital beds across the country while there are no vacancies in your immediate area. The students play the role of a specialist in public health preparedness tasked by the county commissioner to determine at what point local hospitals will be approaching full capacity and how the people in their county who are most at risk can affect those numbers.
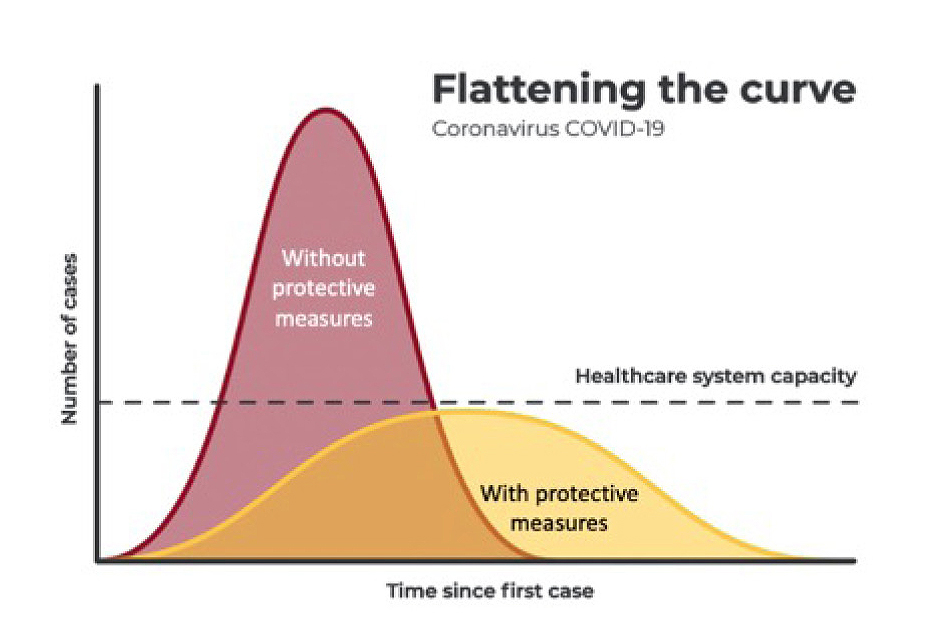
The “flattening the curve” model that shows the desire to slow down the spread of COVID-19 in order to protect the healthcare system.
The first activity has students learn about and calculate some of the key metrics areas use to describe the severity of infections in their area. These include terms like case rate and death rate that are techniques we use to be able to compare areas with differing populations. An urban area with a million residents might have 50 cases for a case rate of 5 per 100,000. A rural county could have only 5 cases, but if its population were 50,000 then the case rate of 10 per 100,000 is twice as much as the city. Students also use publicly available data to identify how many hospitals are in their county, how many beds are in each hospital, and what percentage of those beds are typically used. Students enter data and the course produces a graph with a dashed line of estimated healthcare capacity for their county (Figure 7, top).
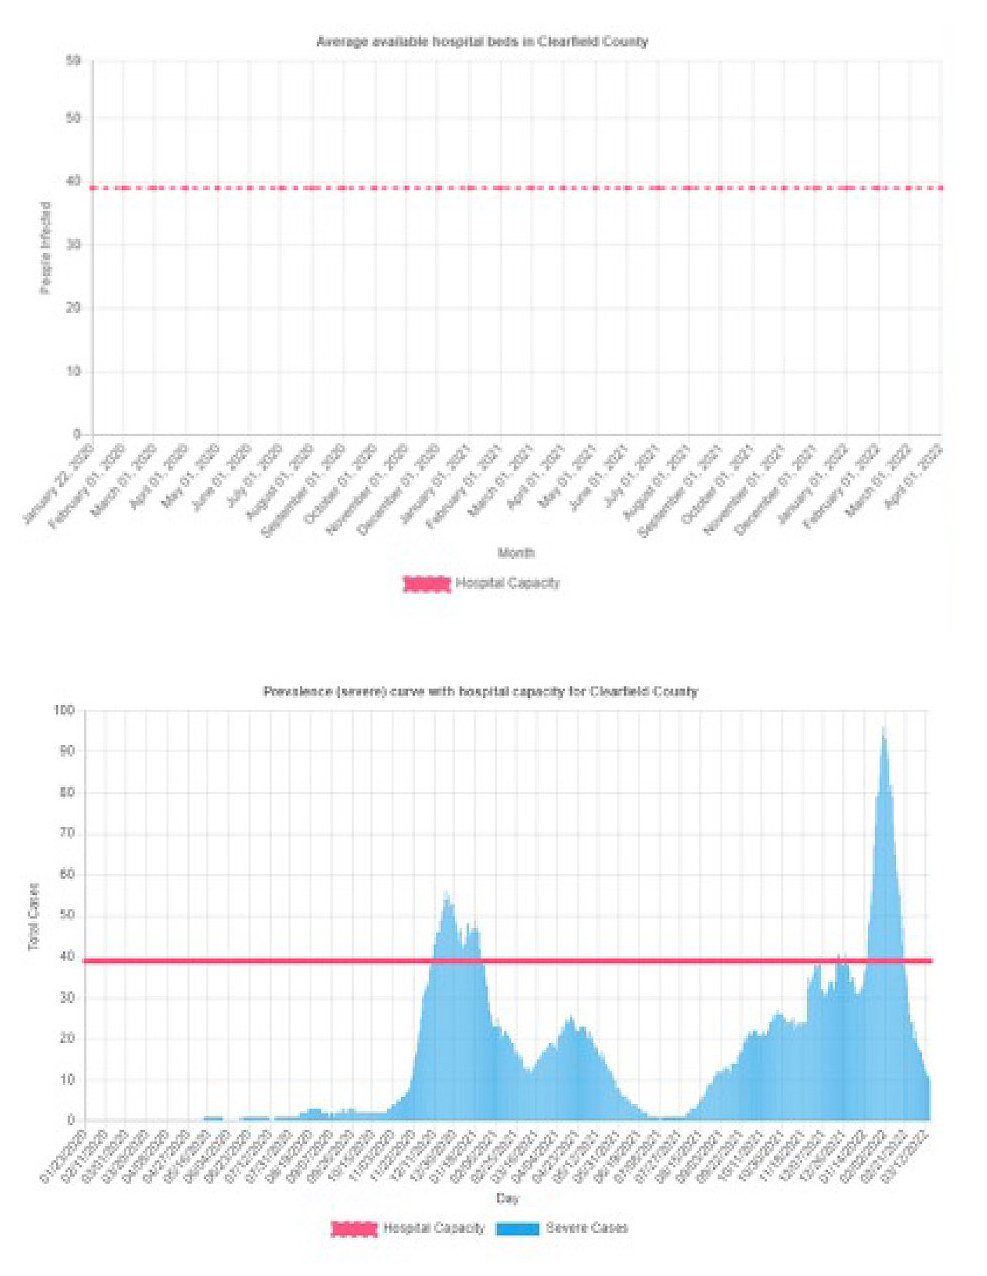
Hospital capacity is determined by taking the number of staffed beds and multiplying by the percentage of beds that are normally being used (top). The prevalence curve is a measure of the estimated number of severe cases over time (bottom).
The second activity helps the students estimate the prevalence curve—that is, the number of people who are sick enough to need to be hospitalized in an area. This corresponds to the curve from the “flatten the curve” diagram. If it exceeds the dashed lines, then the hospitals are overtaxed. However, students need to estimate the prevalence curve using two important variables: 1) What percentage of those who get sick are likely to need to be hospitalized, and 2) How long does it take for the severe illness to resolve? Given those assumptions, taken from the most recently available literature, we can estimate the prevalence in any county in the United States. We do this by downloading the data of new cases each morning from an online site called USAFacts. The course computes the percentage of severe cases and average number of days to resolve severe cases, then it generates a histogram starting from January 2020 to see the trends of cases in the students’ home counties (Figure 7, bottom). There is also a “sandbox” for students to do similar analyses for multiple counties across the country so they can compare the stresses on hospitals in different areas and the differences and similarities in their timing.
The last section helps students identify the vulnerable populations in their area, why they are vulnerable, and what organizations are doing to support those groups. This section considers individuals who are older, have underlying medical conditions, are underinsured, and are in nursing homes. It is important to note here that we recognize some of the students who take this course will be part of vulnerable populations; however, we aim not only to bring these populations to students’ attention but also to help them learn about what groups are helping these populations and provide resources they can use to get help. We also have a section about opportunities for students to volunteer to help, highlighting national and local programs and even the importance of small acts of kindness to an elderly neighbor, for example.
Suggestions for teaching
This section provides a unique opportunity to help students better understand the infrastructure of the area in which they live. It is likely many of the students will not know the hospitals in their area. The activity requires them to look up and identify the county in which they live and the number of hospitals in their county and to use local data about cases, deaths, and the respective rates of each.
This module, like the others, can be taught entirely online, but additional in-class activities would engage the students in more authentic ways. For example, if we were teaching this in our high school class, we would first put students into groups of four. Their task would be to act as consultants for a hospital in the same area of the school, in charge of informing the hospital administration about their vulnerability of running out of beds for COVID-19 patients. To do this, we would assign groups different hospitals on different dates to allow for a variety of responses and rich discussions. Students would first use the module to search for the number of hospitals in the county they were assigned. Then they would research the number of staffed beds in the hospitals and estimate available beds for COVID-19 patients. Next, they would run a prevalence curve to better estimate the number of people in that area who at that time would be severely sick and in need of hospitalization. Then students would do internet research to learn about strategies used by hospitals to increase capacity during peaks of hospitalizations. Students would develop a presentation aimed at a hospital board to help the hospital prepare for and deal with capacity issues.
The third part of the module helps students identify populations who are particularly vulnerable during a pandemic like COVID-19. The groups identified in the module are quite general: elderly, those with underlying conditions, and those who are underinsured. However, we encourage teachers who know their local contexts to help students consider other populations who are vulnerable, why they are vulnerable, and what organizations exist to help those in need. Volunteerism (by definition) cannot be assigned; however, we would help students realize how important it was during the peaks of the pandemic and that there are groups available for students to volunteer with if they choose to do so.
Assessment and evaluation
Formative items that enable students to check their understanding are embedded throughout the course. At the end of each module, students must earn 80% or higher on the summative assessment to move on. At the end of each successfully completed module, the course generates a PDF certificate of achievement, and the student can show that to the teacher as evidence of achieving the threshold. However, we recognize some teachers may want to assess module completion in a more traditional way. For this reason, in the Teacher Resources, we included sample test questions that teachers can transfer to paper, create as a Google Form, or administer through another useful mechanism. Additionally, teachers could use authentic assessments like some of the ones described in this article to assess students’ mastery of the disciplinary content, practices, and crosscutting concepts from science, as well as in ELA or mathematics.
At the end of the course, we ask students to complete a survey to evaluate the effectiveness of the course. As of the time of this writing, 342 of the 2,235 students who took the class completed the survey. We found that respondents mostly increased their understanding of COVID-19 after taking the course (90.4%, n = 309) and can explain the mechanism behind mask wearing, social distancing, and hand washing (91.4%, n = 310). Respondents also thought that the course was well organized (90.9%, n = 309) and that the activities helped them understand the materials (90%, n = 306). A majority of respondents (91.7%, n = 311) said the course helped them understand how researchers study the novel virus and that the activities in which they thought like a scientist using models and contesting ideas helped them understand the topic. A full 91.1% of respondents (n = 308) agreed that they would recommend the course to another teacher to use in the class. Unfortunately—and it may be we can all agree with this after the long pandemic—only 80% (n = 271) of respondents agreed that they wanted to learn more about COVID-19 after taking the course.
Acknowledgments
The authors would like to thank Dr. Matt Ferrari and Dr. Jennifer Osetek, as well as Savannah Ledford and Heather Schubert, for their assistance in the development of the course. We would also like to thank Kate Eisele, Melissa Farina, Barbi Vena, Jessica Fellin, Mandy Lumadue, Allison Ewing, Janet Belval, Jim Garrett, and Susan Loya for piloting the course and providing helpful feedback. The project was funded by the Penn State Social Science Research Institute and the Huck Institutes of the Life Sciences.
Matthew Johnson (mmj125@psu.edu) is Associate Director of the Center for Science and the Schools and Associate Professor of Science Education. Tiffany Lewis is STEM Education Outreach Specialist, Kit Martin is Assistant Professor of Computer Science Education, Amber Cesare is STEM Education Outreach Specialist, Anthony Schmitt is Professor of Molecular Immunology and Infectious Diseases, Eugene Lengerich is Professor of Public Health Sciences, Kristin Bittner is Instructional Designer, and Chris Divyak is Front End Web Developer, all at Penn State University, University Park, PA.
Biology Curriculum Instructional Materials Life Science NGSS Pedagogy Science and Engineering Practices High School