
feature
Exploring the Zooniverse
Using wildlife camera citizen science projects to engage students in academic language acquisition
The Science Teacher—May/June 2021 (Volume 88, Issue 5)
By Lacey Huffling, Heather Scott, Melissa Weeks, Hayward Johnson, Britt Gantt, and Regina Collins
If you run a simple Google search of citizen science opportunities for high school science, over 335,000,000 hits come back. This can be overwhelming when you are trying to integrate citizen science into the science curriculum. In addition, many citizen science projects have very strict protocols and procedures that require training to submit collected data. Though these procedures are understandable and make the data collected more reliable, this can become yet another barrier for an educator who wants to help students enter the world of citizen science. The lesson set in this article describes an introductory learning experience using wildlife camera–based citizen science projects hosted on Zooniverse (www.zooniverse.org).
We chose wildlife camera projects due to the charisma of the study organisms (Lindemann-Matthies 2005), student engagement while looking at images (Waycott et al. 2012), ease of access to projects, ease of teaching data collection protocols, and the overarching concepts of stability and change. We structured our activities to engage students in the scientific practices of analyzing and interpreting data and constructing an explanation through the creation of a scientific poster (Figure 1). Our goal was to engage students in academic language acquisition using discourse (development of narrative on scientific poster) and syntax (data representation on scientific poster) (Wiesen 2018). Academic language function makes students’ use of scientific and engineering practices possible. By collecting data, students are measuring, identifying, labeling, and calculating. When constructing explanations, students justify their claims through analysis, discussion, and evaluation.
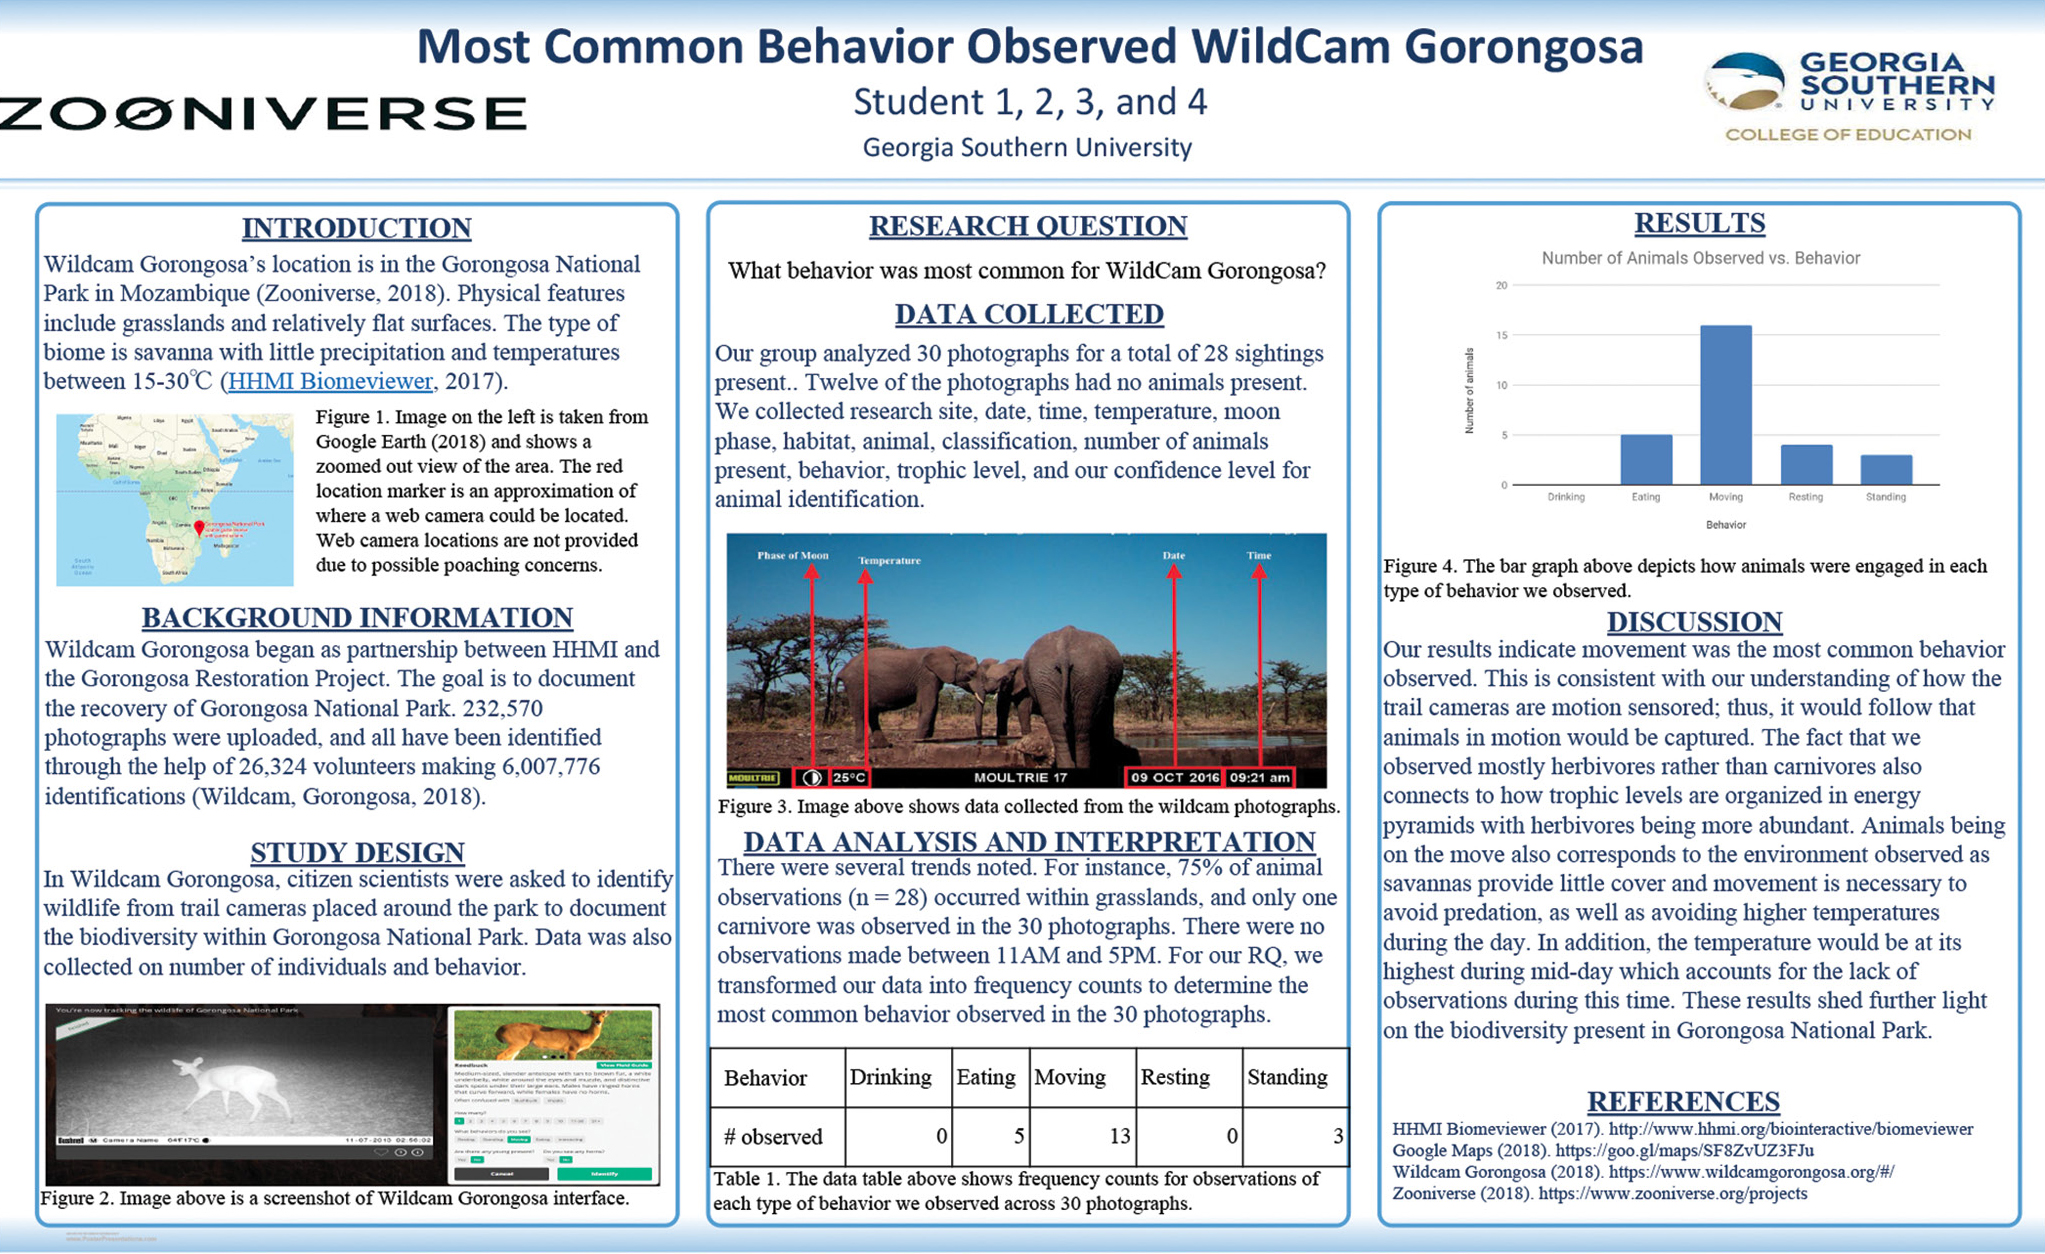
Scientific poster we provided to students at the beginning of the learning experience.
The lesson learning experience
The lesson set comprised five 90-minute class periods where students collected, analyzed, interpreted, and constructed explanations with data. It was taught in six separate high school classrooms ranging from honors to inclusion students. We placed students in groups of four, with pairs of students working together within each group. We placed students in mixed ability groups as the scientific poster assessment required writing, data analysis, and graphical representation. The lesson set requires:
- Laptops or tablets/iPads (ideally at least 1 per pair of students; if needed, students could use 1 for a group of 4)
- Internet connection
- Access to word processing, presentation, and spreadsheet tools (We used Google Documents, Slides, and Sheets.)
- Access to HHMI Niche Partitioning Click and Learn (https://www.hhmi.org/biointeractive/click-learn-collection) (Day 1)
- Access to Zooniverse (www.zooniverse.org) We highly recommend creating one class login for all classes to use. We had no issues with classes of 30–35 students using the same username and password. This also helps track your total contributions to projects. (Days 2–3)
- Citizen Science Introduction Document (http://tiny.cc/TSTCS1) (Days 2–3)
- Google Map with Featured Projects (http://tiny.cc/TSTCS2) (Days 2–3)
- Access to HHMI Biomeviewer (https://www.hhmi.org/biointeractive/biomeviewer)
- Printed copies of Data Collection Example Cards (http://tiny.cc/TSTCS3) (Days 2–3)
- Data Collection Spreadsheet for each group (http://tiny.cc/TSTCS4) (If not enough computers are available for data entry, then print copies for students to fill in by hand.) (Days 2–3)
- Data Collection Google Spreadsheet filled-in example (http://tiny.cc/TSTCS5)
- Google Slides Scientific Poster Template (http://tiny.cc/TSTCS6) (Days 2–3)
- Google Docs Student and Peer Checklist (http://tiny.cc/TSTCS7) (Days 4–5)
- Google Docs Teacher Rubric (http://tiny.cc/TSTCS9) (Days 4–5)
- Google Slides Scientific Poster Example (http://tiny.cc/TSTCS8) (Days 4–5)
Day 1
Using an HHMI Biointeractive Click and Learn activity (https://www.hhmi.org/biointeractive/click-learn-collection), we introduced students to the observational fieldwork of Dr. Robert Pringle, which led to his niche partitioning of the Kenyan savanna. This Click and Learn activity scaffolded the process of understanding why scientists conduct field observational studies; how data can be obtained from observations; how data can be analyzed and transformed to various media (maps, data tables, and graphical representations); and how data inform scientists of what is happening within populations and communities, which leads to further investigations. The first module in the Click and Learn simulates the use of observational data of herbivores in the Kenyan savanna. Module 2 simulates how Dr. Pringle used DNA metabarcoding to further study the niche partitioning of herbivore diets. Students completed this activity in pairs working through each of the two modules. We debriefed students after the activity asking questions such as
- What is observational field work?
- How is it different from laboratory work?
- How might wildlife cameras have aided the field observational work?
- What questions do you have?
Day 2
Engage: We began by engaging students with a picture of giraffes pulled from Parasite Safari on Zooniverse (Figure 2). We encouraged students to write down observations and questions they had about the photograph. After allowing students to share out what they had written, we explained how the photograph was pulled off the internet from a project that posted wildlife camera pictures for the general public to help scientists inventory the biodiversity of the park. We showed the HHMI video, Remote Trail Cameras to Study Lions in Gorongosa (https://www.youtube.com/watch?time_continue=2&v=JAQE7f3QIqo) to orient students to wildlife camera projects.
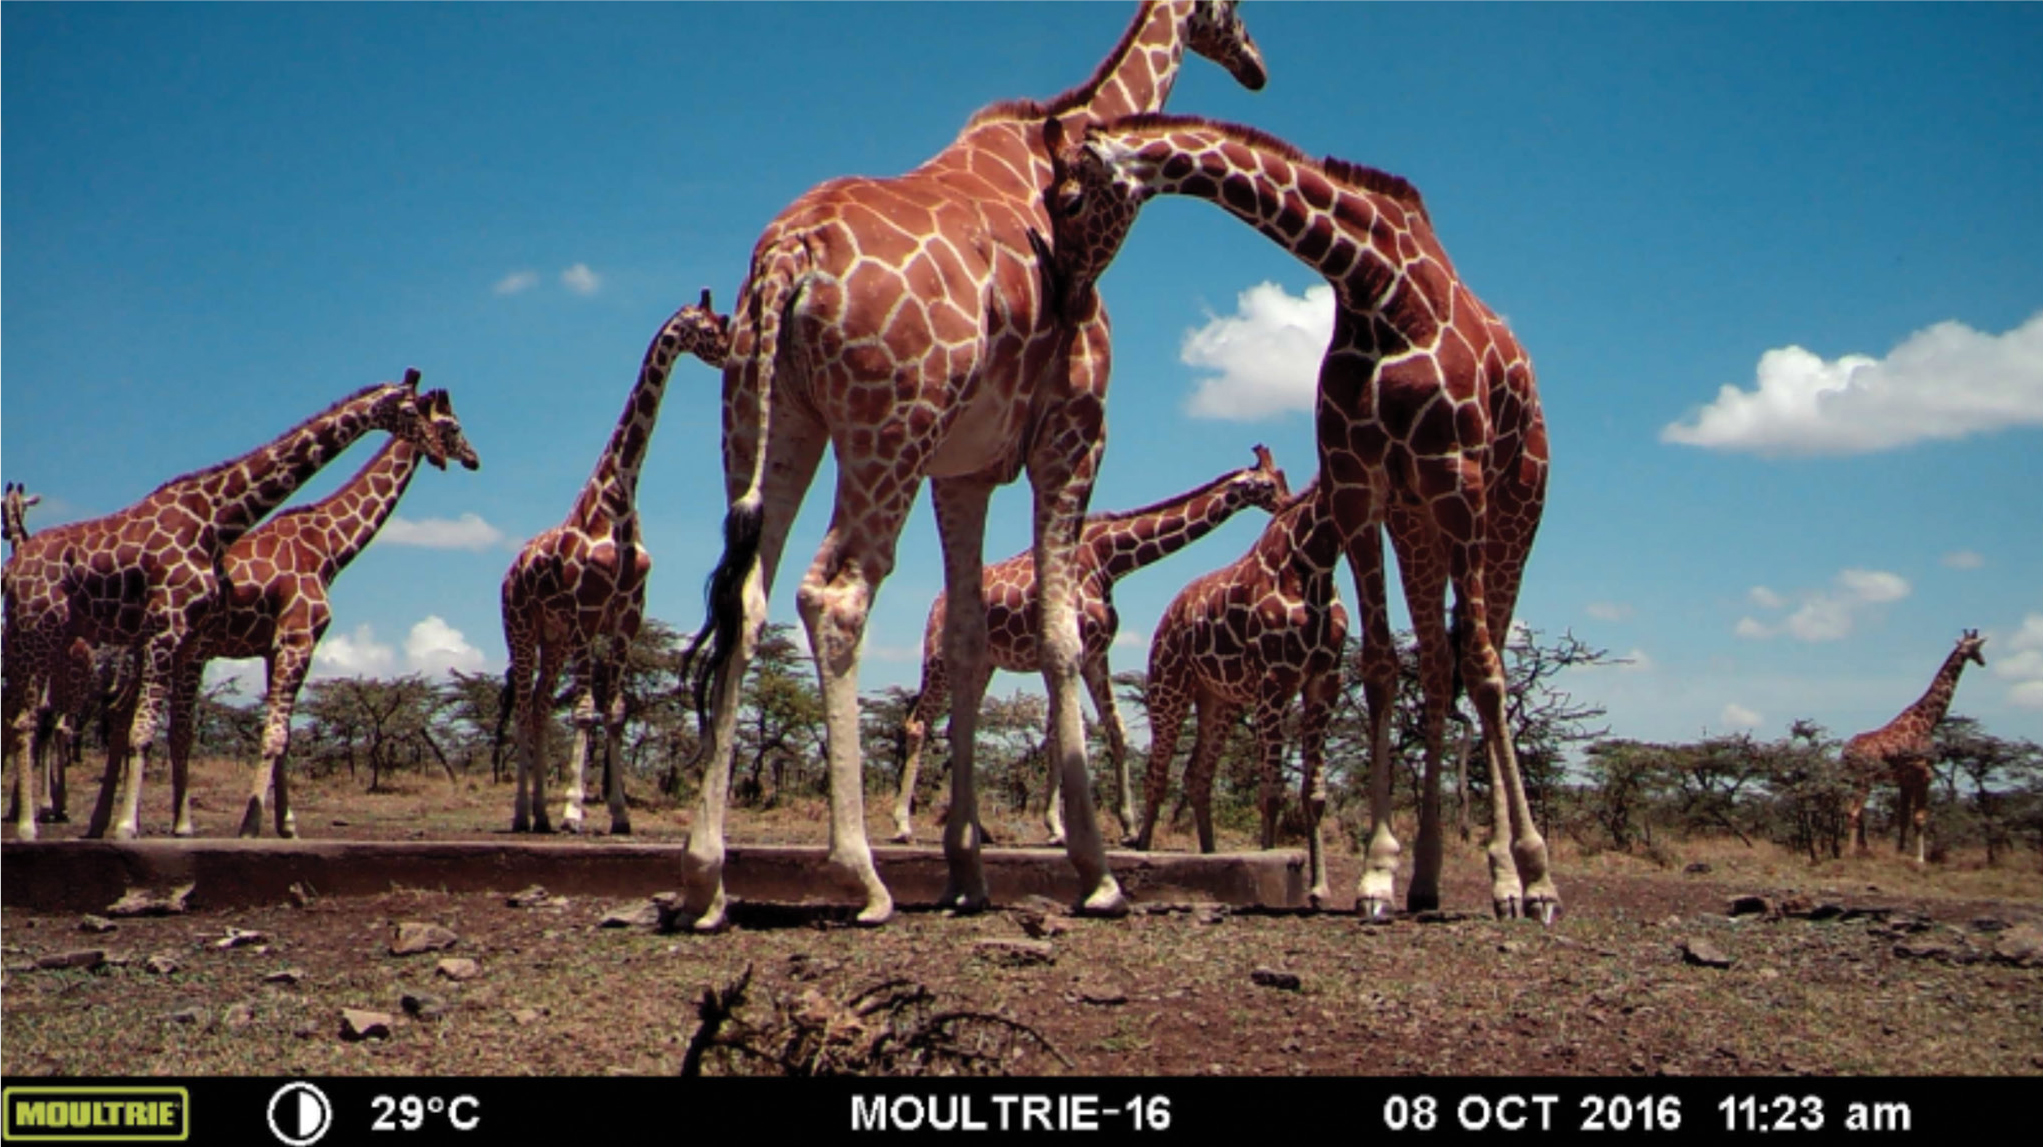
Screenshot from Parasite Safari.
After students watched the video, we told them that for the next couple of days they were going to be citizen scientists and help scientists around the world collect data from wildlife cameras. Students were excited to look at pictures of animals. Next, we showed students Zooniverse and explained that their group of four would be responsible for collecting data for one of the wildcam projects on the site. We pulled up Parasite Safari as an example project, and as a whole class, we identified organisms in three photographs.
Explore: Students then pulled up the Citizen Science Introduction Document and selected their focus project from the list we provided. Next, students answered the questions in Step 1 on the document, which would later become the text for the Introduction, Background, and Study Design sections of their scientific posters. Educators should consider the following:
- We recommend selecting Zooniverse projects that have less than 75% of the photographs completed to make sure the project is not finished by the time students select focus projects.
- We purposefully selected projects from various biomes to further discuss concepts covered earlier in the school year (HHMI’s Biomeviewer provided more information students could use for their scientific poster).
- We also selected projects that contained the same type of extra data on the photographs (e.g., temperature, time of day, Moon phase, etc…).
- The students enjoyed seeing the projects laid out on a Google map, but a new map would need to be created based on the projects one selects for student choice. (Note: Some of the projects listed on the provided Google map have already been completed or are awaiting new photographs to be uploaded.)
Day 3
Explain: At the beginning of class, each group of four shared the name, location, and research question for their project, so students could get an idea of the differences and similarities between the projects. Next, we distributed data collection protocol cards for students to reference as they collected data. Before releasing students to collect data, we shared an example project on Zooniverse and showed students step by step how to narrow down their identification using the built-in filters that used identification features (e.g., color, body shape, horns, etc.) and field guides to narrow down species options. We also emphasized that they were collecting two forms of data: (1) data for the scientists, which were submitted directly through Zooniverse, and (2) data for their scientific poster, which they entered into the Google Spreadsheets. We reminded students that the data collected on their spreadsheet required additional information compared to the data they submitted directly to the Zooniverse platform. Finally, we told students they must be logged into our class Zooniverse account to view new photographs, and they must record on their Google Spreadsheet all photographs, even those with no animals present.
As students began collecting data, a couple of groups complained that they were not getting any photographs after their first 5–10 photos. When we examined their computers, we noted they were not logged into Zooniverse. We explained to students that the login process was one way Zooniverse ensured that someone was interested in participating in the project and not just playing around. A student responded, “Wait a minute, you mean what we are doing really matters to them? Hey guys, this is for real. I’m going to take this seriously now.” This was fascinating for us to observe: As it became apparent to students that their data collection really mattered, then their level of participation greatly increased. We heard lots of comments: “This is cool.” “I want to do some more at home.” “Do we get to do this again?” After students had completed the data collection, students cleaned up the data by checking that spelling was the same and capitalization was consistent.
Day 4
Elaborate: To begin class, we displayed the scientific poster example for students to see. We asked students to comment on what information had already been completed and what information they still needed to collect for their posters. Students noted they did not have screenshots from their projects, their own research question to explore, data table and graphs, a discussion, or references.
We explained to students that we would be completing the research question development with data analysis and representation during class from their Google Spreadsheets. First, we used the Data Collection Google Spreadsheet example to complete Part 3 of the Citizen Science Introduction Document. We walked students through the Explore feature of Google Spreadsheet to analyze the sample data asking a question we generated (e.g. What behavior was most common for Wildlife Goronozoa?). Then, we had students develop their own question and perform the appropriate data transformation and graphical representation creation before they could move to the data set they had generated from their Zooniverse project.
Next, students reviewed their data, agreed on the research question they would analyze for their scientific poster, and received approval of their question. Each student group started a new tab on their spreadsheet to create a data table for their research question. For most groups, this meant they transformed the data from qualitative (e.g., animal name) to quantitative (e.g., number of times animal name appeared). Some group members returned to their Zooniverse project to take screenshots for images for their scientific posters. We showed each group how to take a screenshot and crop it on their devices. We encouraged students to look at the example poster to see what basic statistics they could provide from their data set (e.g., number of photographs completed, percentage of no sightings, highest frequency observed, lowest frequency observed). For their scientific poster, groups also had to create a data table and graphical representation to answer their research question.
Creating a datasheet with dropdown choices eliminated a lot of the data cleanup that needed to occur. It also allowed for consistency across groups if we had wanted to combine group datasheets to have a larger data collection for students to analyze. Since we used Google Suites for Education tools, students had the option to work at home on assigned sections. Some students did not have reliable access to equipment or the internet, so not all classes engaged in outside work on the poster.
Day 5
Evaluate: The final day of the project was structured differently depending on the class and teacher. Some classes used most of the class period to complete poster construction. We encouraged students to use the Student and Peer Checklist (see Online Connections, Figure 3) and teacher rubric (see link in References) to evaluate their work and make needed adjustments. Some classes finished with enough time to perform a peer review process, reviewing other groups’ posters and giving feedback based on the checklist criteria. Then, groups addressed the areas of concern highlighted by their peers. Finally, one class completed its posters outside of class time. This class ran a peer review process but also had time for groups to present their posters to the class. See Figure 4 for student poster examples.
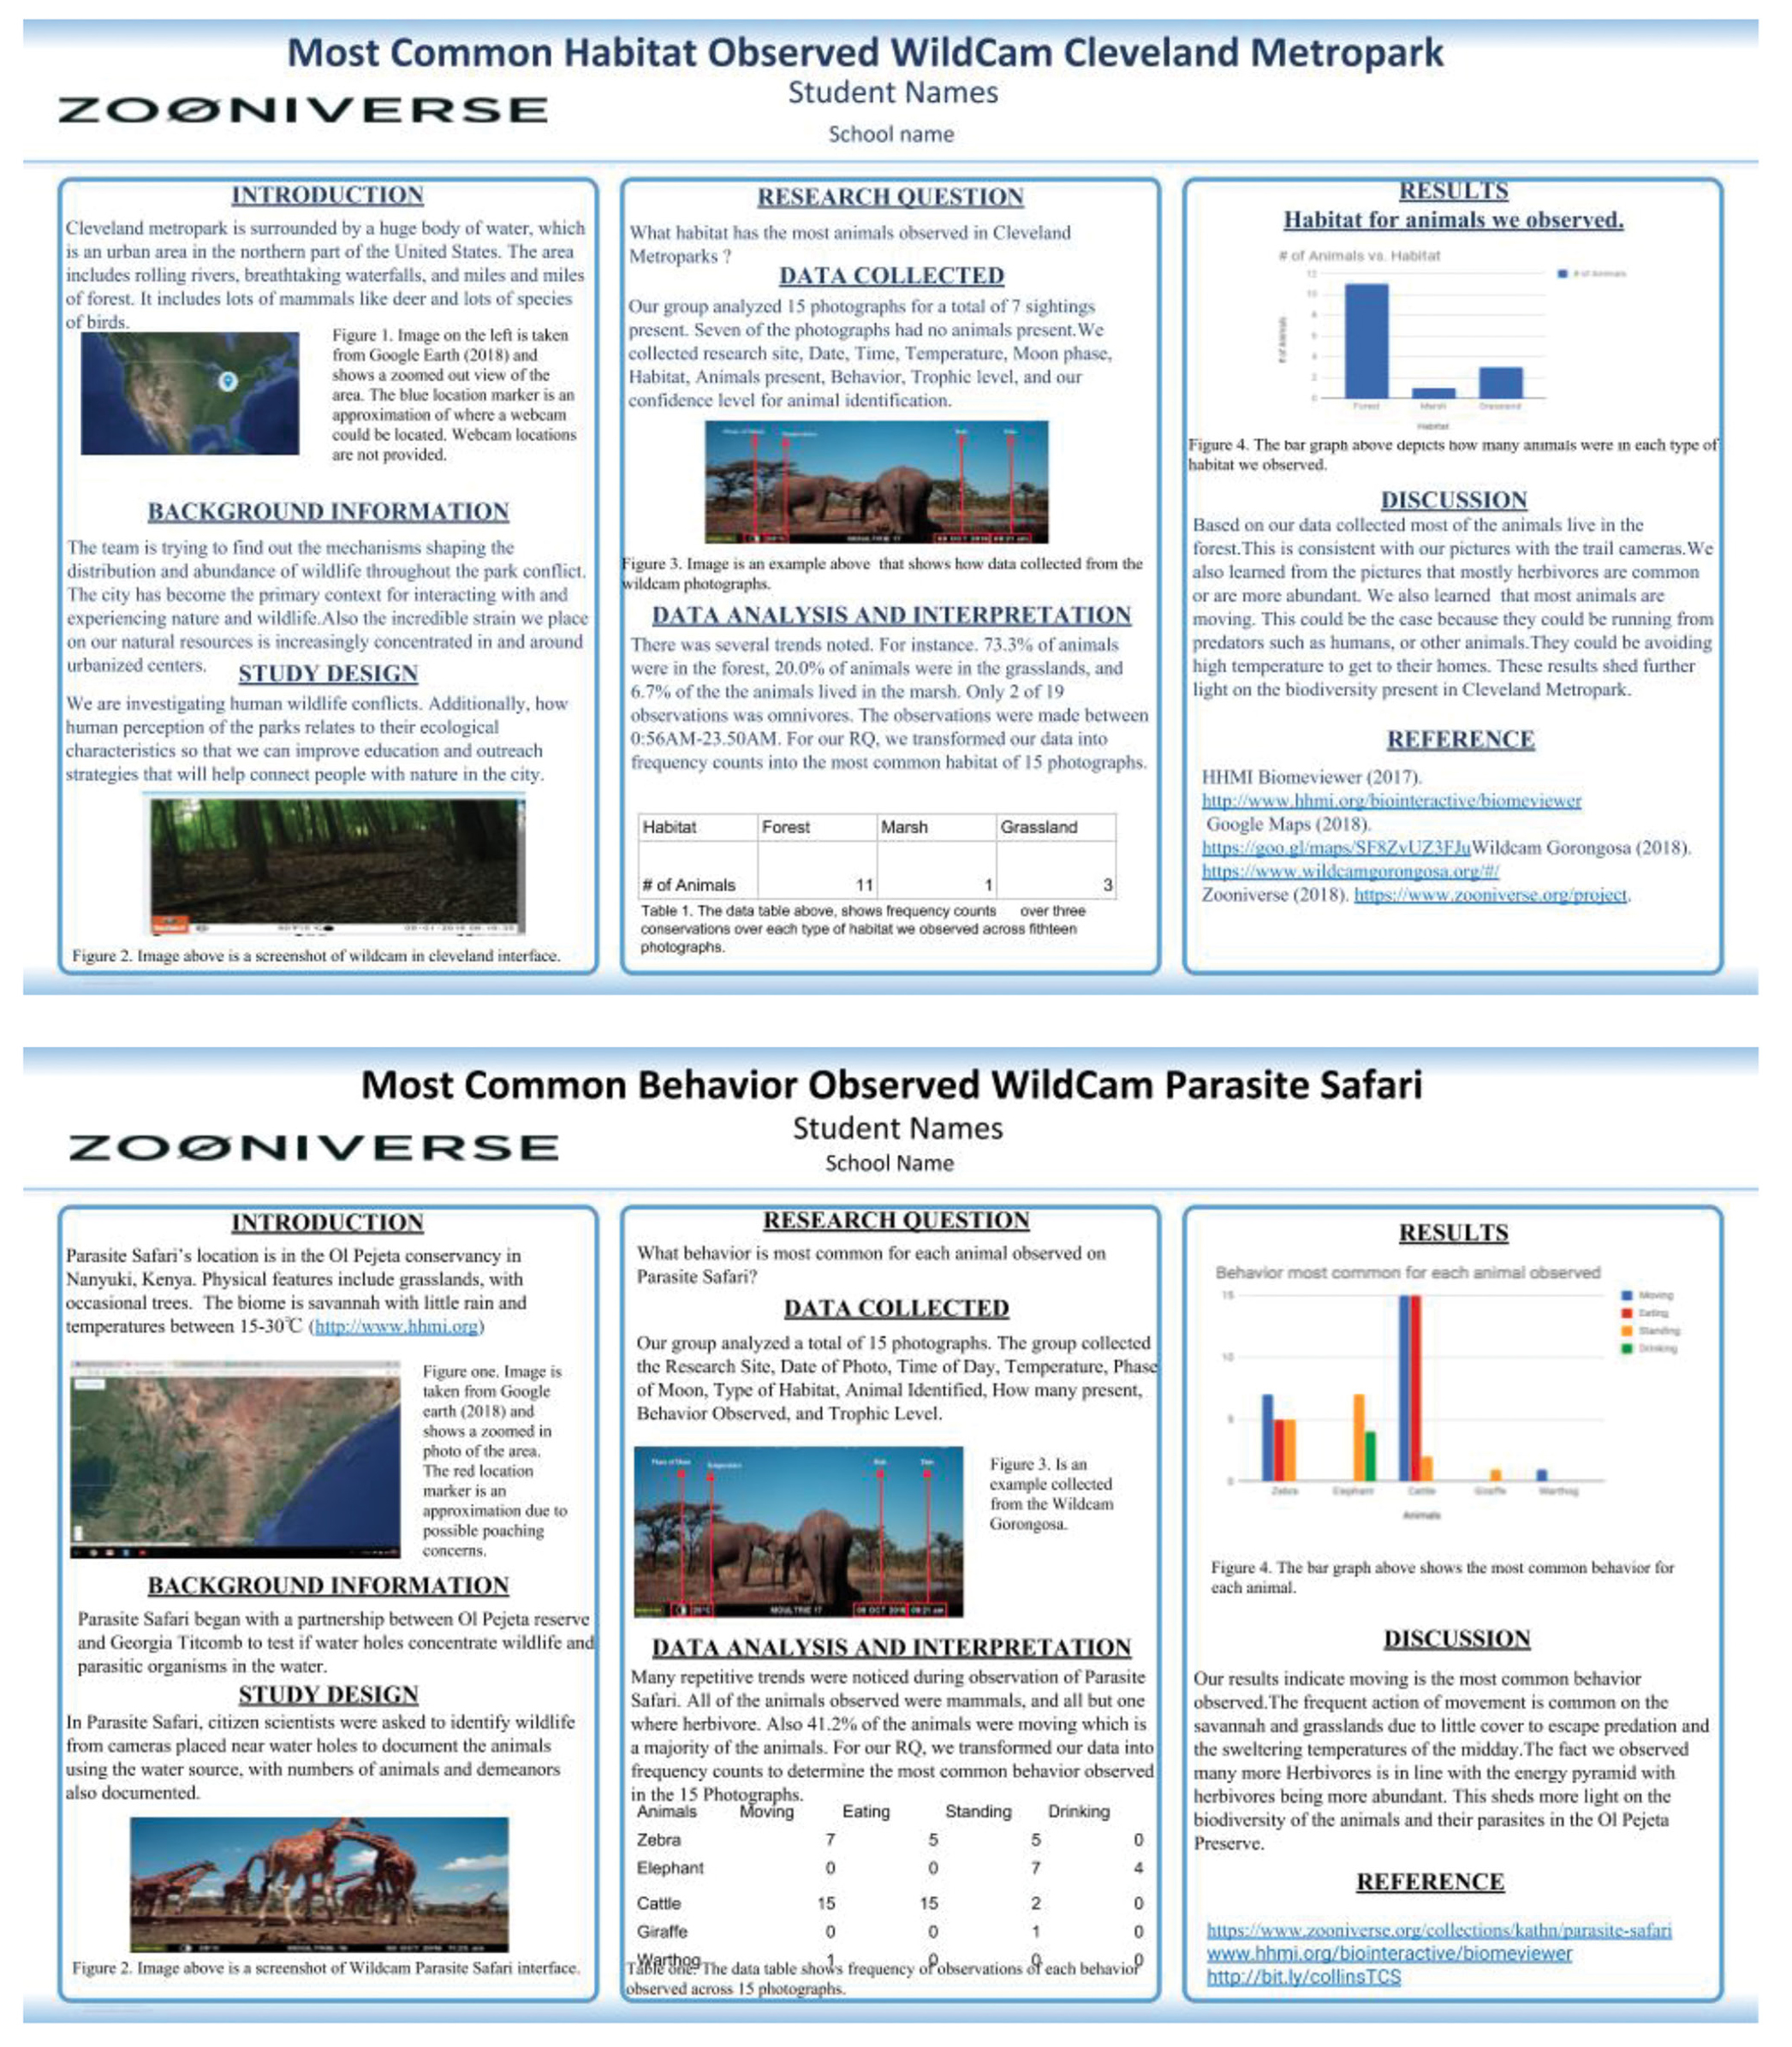
Scientific posters created by students.
Extension and Differentiation Ideas
Upon further reflection, we have generated ideas for how we can extend and differentiate this learning experience in future iterations:
- The students enjoyed sharing their posters with each other. This is an aspect that we will add for all students in the future.
- Instead of poster presentations at the front of the classroom using a screen and projector, we can print the posters (template is for legal size paper) and have a scientific poster symposium like scientists do at their various research conferences. This way we could invite colleagues or administration.
- If this lesson set is taught with multiple classes, then students could have the same project as another group, and their data could be combined into one spreadsheet for a larger data set.
- A teacher could create a large database by compiling every group’s data into one spreadsheet given the commonality of data collected. This would increase the data points, which is one way this could be differentiated for higher ability classes or groups.
- Students who struggle with writing could use sentence frames and structured paragraphs for the scientific poster.
- Students identified as gifted could conduct further data analyses with programs such as DataClassroom or Microsoft Excel statistical tests.
- The discussion section can feature key vocabulary and ecological concepts emphasized by class objectives and state standards. Student ability could also determine how much and in what detail these concepts are discussed. Different rubrics could be created based on student ability.
- The discussion could also have a requirement to focus on at least one NGSS cross-cutting concept with student ability determining the depth at which this occurs.
- Students could do an external reflection/additional narrative on why they chose to use the data and graphical representations in their poster.
Conclusion
Overall, our students were highly engaged in this learning experience and academic language acquisition (see Figure 5 for examples of where academic language acquisition can occur). At first, it was a struggle because we implemented the lesson set after state testing, so students thought we were done for the year. However, their level of interest greatly increased once they knew their data collection contributions helped real scientists working on real ecological research. Two groups in two different classrooms had projects that reached 100% completion during the learning experience, which further solidified how their contributions had made a difference.
| Figure 5. Academic language acquisition chart. | ||||||||||||
|---|---|---|---|---|---|---|---|---|---|---|---|---|
|
As educators, one of the things we noticed is that this material was accessible for all students, and all students were engaged in the data collection and analysis process. The partner work and photographs gave students common ground to discuss other facts they knew about the animals or about local animals that were similar to those in the photograph. Compared to previous writing attempts, students were also more successful in using both discourse and syntax in a robust manner. All groups completed the poster (discourse) and had accurate data tables and graphs (syntax).
In our next attempts at teaching this lesson set, we will challenge students to include a crosscutting concept in their discussion to provide deeper and richer explanations. We tied the class discussion to the disciplinary core ideas and crosscutting concepts listed in Figure 6 (see Online Connections). We hope the lesson set in this article can serve as an introductory activity for teachers looking to introduce students to citizen science. As students collect more data, more complex questions and analyses can be addressed. Even with the limited discussions some students provided, students have reported that they have engaged their friends and/or families in projects on Zooniverse. To us, this is one of the most successful outcomes we hope to achieve while helping students truly become citizen scientists. ■
Online Connections
Figure 3: https://bit.ly/3eoQ01d
Figure 6: Connecting to the Next Generation Science Standards: https://bit.ly/3l1dXNa
Lacey Huffling (lhuffling@georgiasouthern.edu) is an associate professor at Georgia Southern University in Statesboro, GA, Heather Scott is an assistant professor at Georgia Southern University in Statesboro, GA, Melissa Weeks is a teacher at Rabun County Middle School in Tiger, GA, Hayward Johnson is a teacher at Swainsboro High School in Swainsboro, GA, Britt Gantt is a teacher at Barrow Arts and Sciences Academy in Winder, GA, and Regina Collins is a teacher at Nevils Elementary School in Statesboro, GA.
Biology Citizen Science Crosscutting Concepts Disciplinary Core Ideas Environmental Science Lesson Plans Life Science Literacy NGSS Science and Engineering Practices Three-Dimensional Learning Middle School High School