
feature
Wildfire!
The Science Teacher—November/December 2022 (Volume 90, Issue 2)
By Michael Giamellaro, Elinor Wilson, and Heidi Dixon
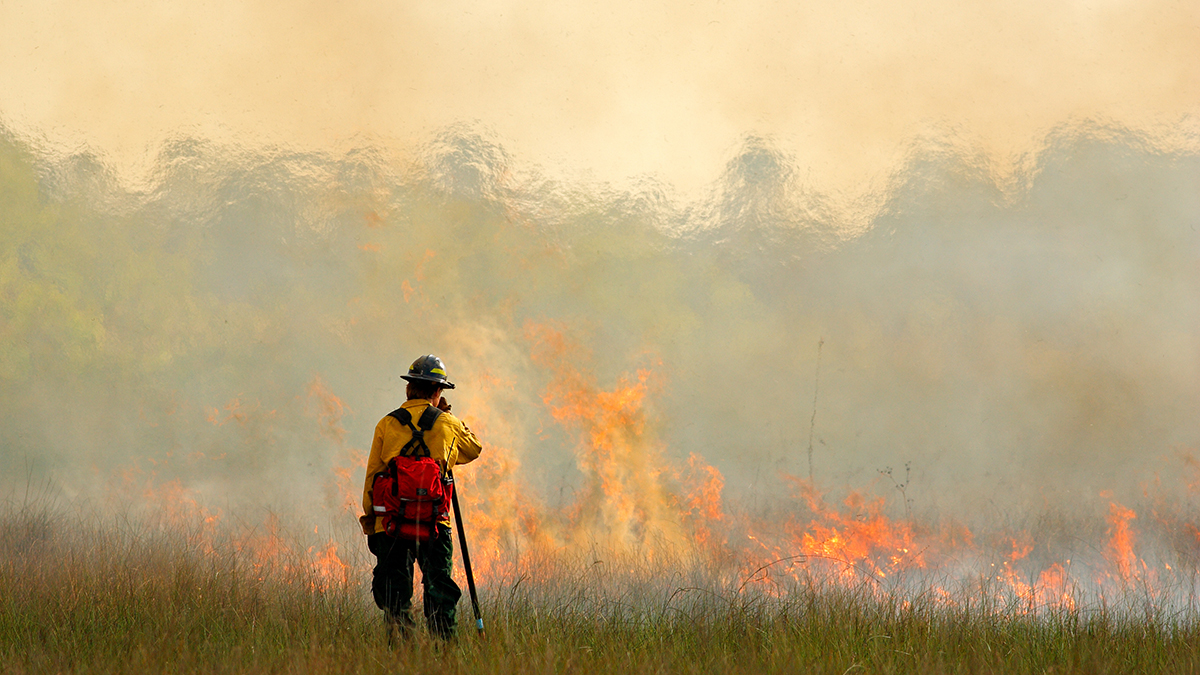
Wildland fires have become a regular aspect of life for people living in the western United States. Wildfire smoke is now impacting air quality across the United States, and there are now more wildfire smoke-related illnesses and deaths in the eastern than the western United States (O’Dell et al. 2021). Unprecedented wildfires have swept through Australia, Russia, and Portugal in the last few years. Like other natural disasters, wildland fires can have a devastating impact on communities that are directly in their paths. However, they also cast a much bigger footprint due to the smoke they release on a global scale. These smoke events can lead to health warnings, noticeable irritation to the lungs, and cancelled outdoor events. They have quickly become part of the life experience of many students around the world. Their connections to global climate change and environmental policy, juxtaposition as positive forces in ecosystem succession, and relationship to a wide variety of both simple and complex natural phenomena leave science teachers with an opportunity to frame myriad lessons within the context of wildfire. We present a series of such lessons, adaptable to various levels of physical or integrated science.
Background
Our approach asks students to make sense of natural phenomena by modeling (often drawing) their first-impression explanations and then iteratively testing uncertain parts of their explanations. Students develop an increasingly sophisticated understanding of the phenomenon as well as the facts, concepts, and practices required to explain it—the sensemaking process embedded in the NGSS. This student-centered pedagogical approach is described in Windschitl, Thompson, and Braaten’s 2018 book Ambitious Science Teaching and briefly addressed in a previous Science Teacher article (Fowler, Windschitl, and Auning 2020). Within this framework, each iterative model that the students develop is used as a formative assessment to indicate which parts of the explanation for the phenomenon students understand and suggests to the teacher how to guide next steps in building understanding. At the end of the process, student justifications of their models serve as a summative assessment of their understanding.
We taught this series of lessons in 9th- and 10th-grade physical science classes with students who are regularly affected by intense wildfire smoke. The learning sequence would also be appropriate for general chemistry and physics courses and can be easily adapted to meet the academic level of the students. The lessons were adapted for online instruction in response to the COVID-19 pandemic. While each teacher and class approached the unit somewhat differently, we present a synthesized version here.
Explanatory models
In using the Ambitious Science Teaching (AST) approach, we have found success with building the lessons around a natural phenomenon that might at first seem to have a simple explanation but that also requires increasingly advanced understanding to develop more complete explanations. We anchor this unit by asking students to consider “Where does a burned tree go?” While the phenomenon of a burning log can be explained very simply, a deeper understanding of chemical reactions, atmospheric processes, and impacts on human health requires more intensive modeling and therefore understanding. Students find the question to be very accessible and are quick to discover the limits of their understanding as they progress through more elaborate explanatory models. This spectrum of understanding also allows for various students to develop and end up with various depths of understanding and avoiding the ceiling effect often experienced by more advanced students.
To quickly and formatively assess students’ initial understanding of the phenomenon, we used Keeley’s “Burning Paper” probe (Keeley and Tugel 2009), which asks students to predict the mass of a closed jar before and after paper is burned inside it. Our students expressed a variety of justifications for the mass (A) increasing, (B) decreasing, and (C) staying the same; we found only about half the students originally believed there would be no change (Figure 1), indicating a need to review this concept. This set up the opportunity to systematically test for conservation of mass.
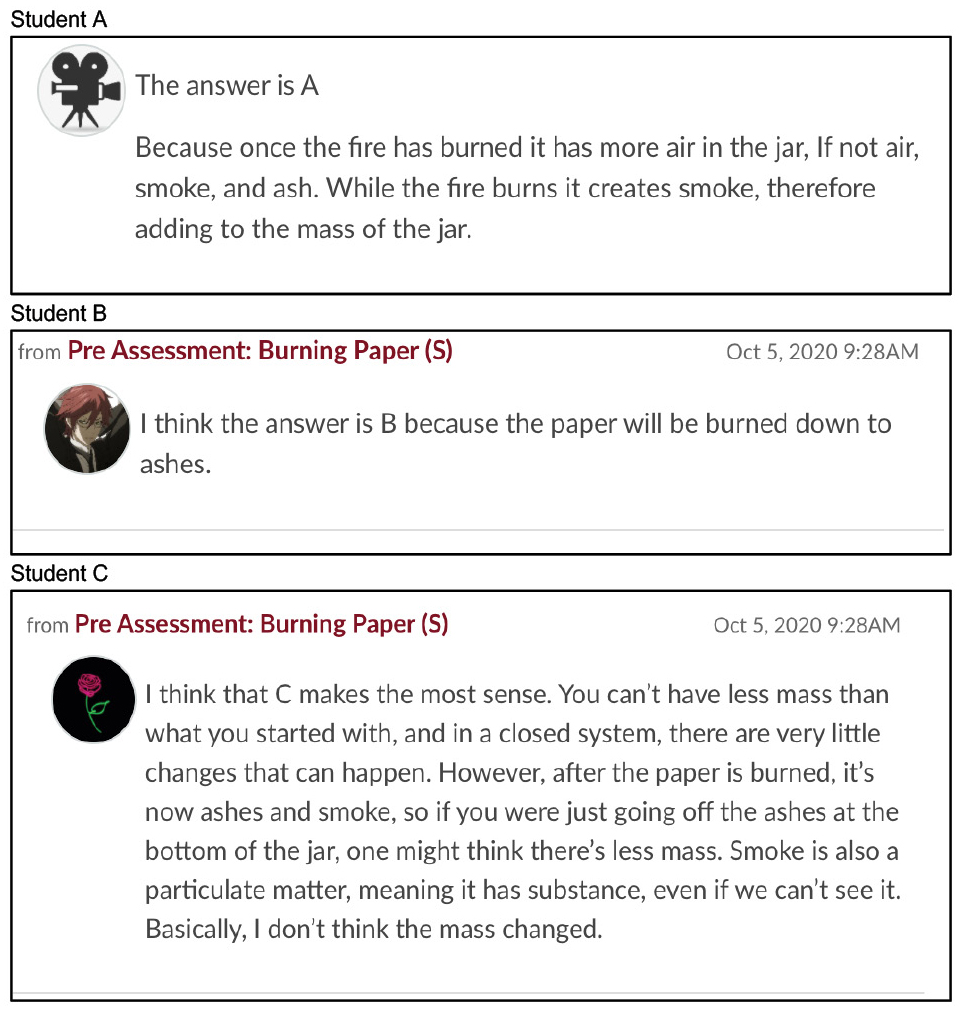
Student hypotheses.
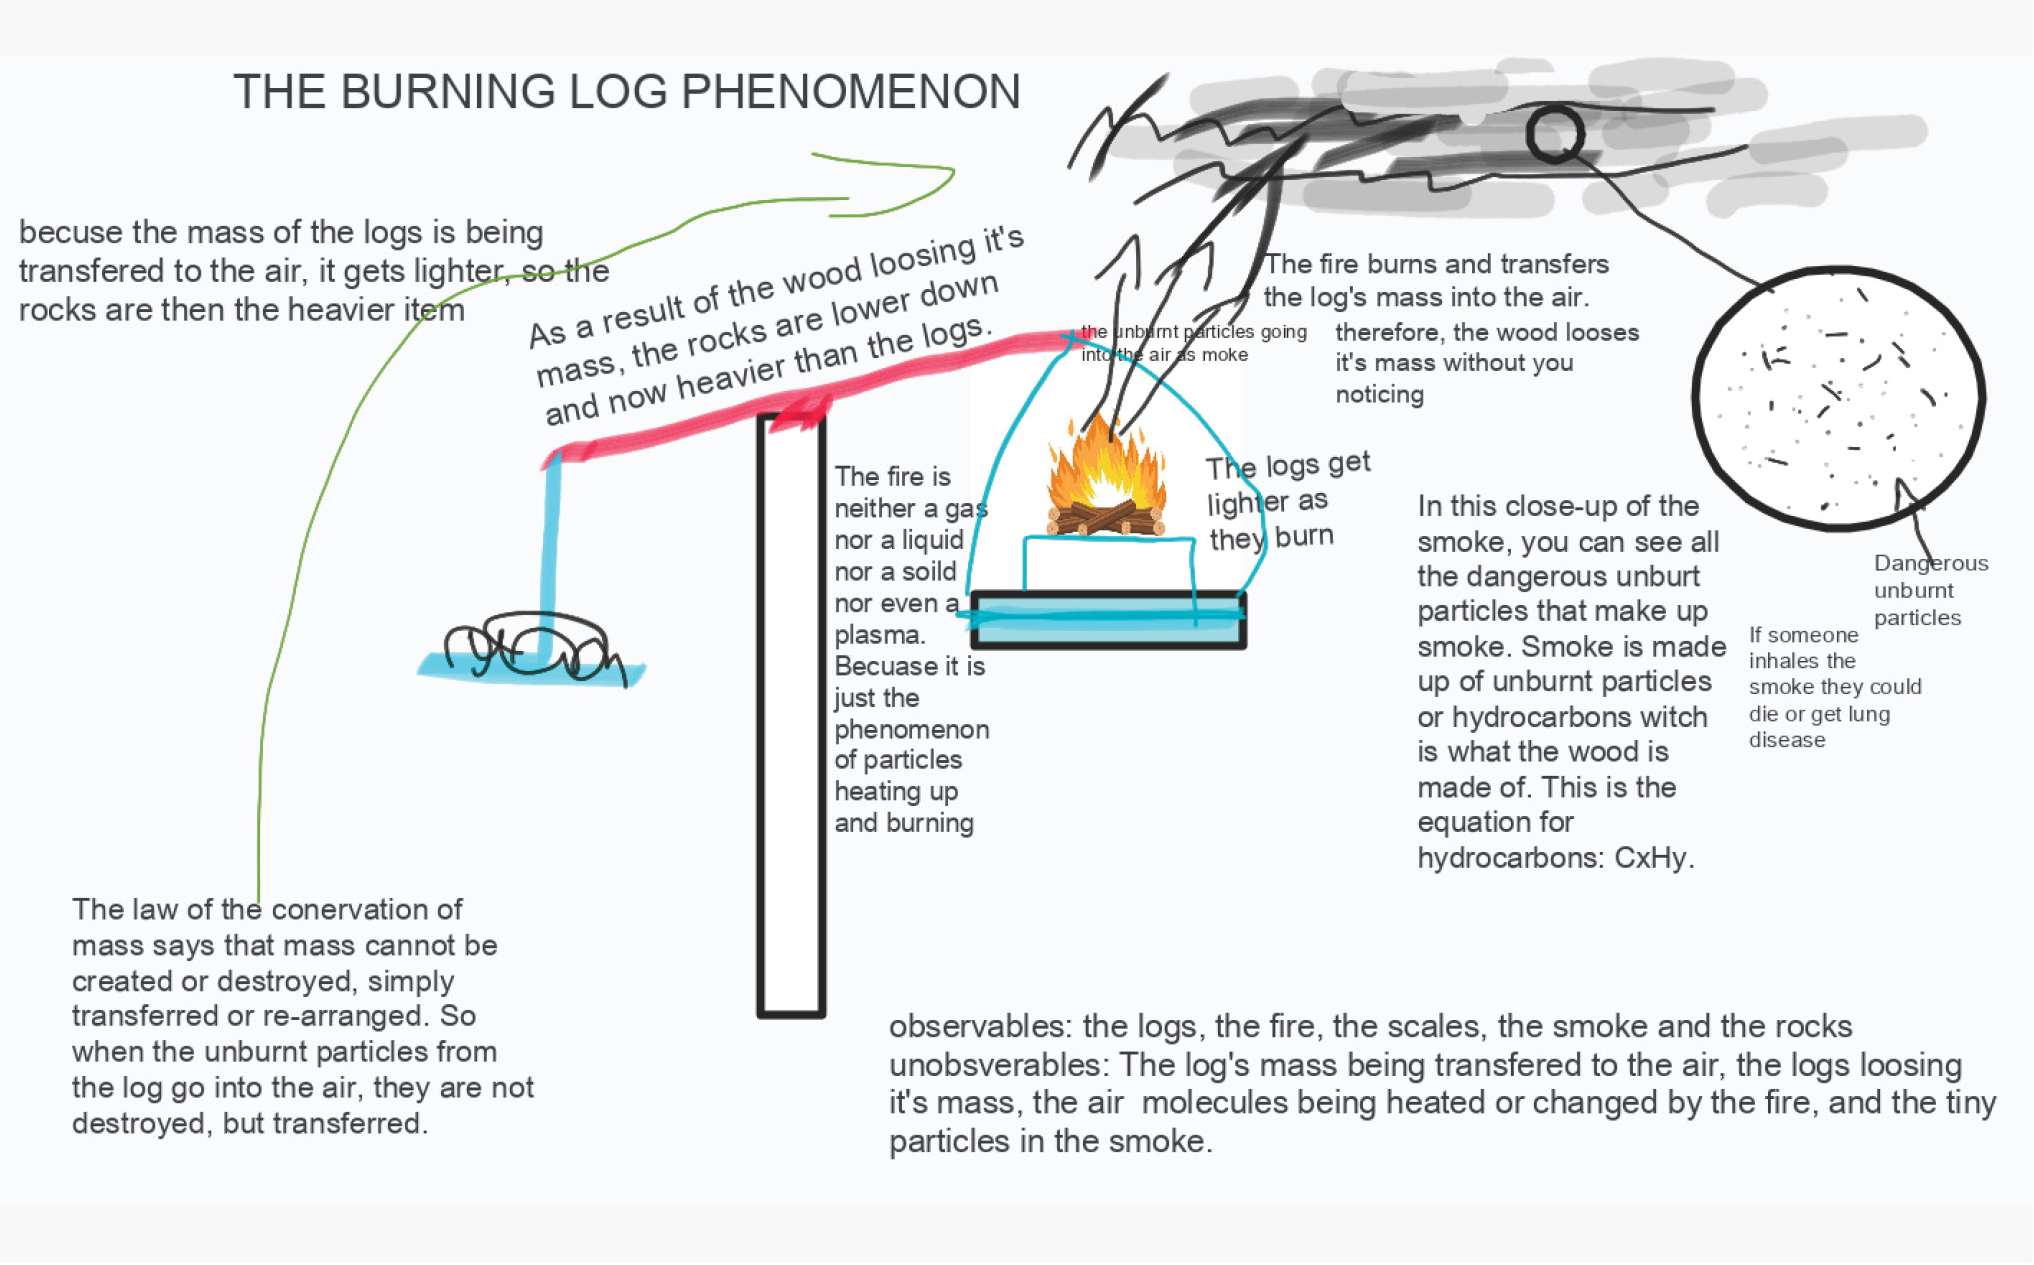
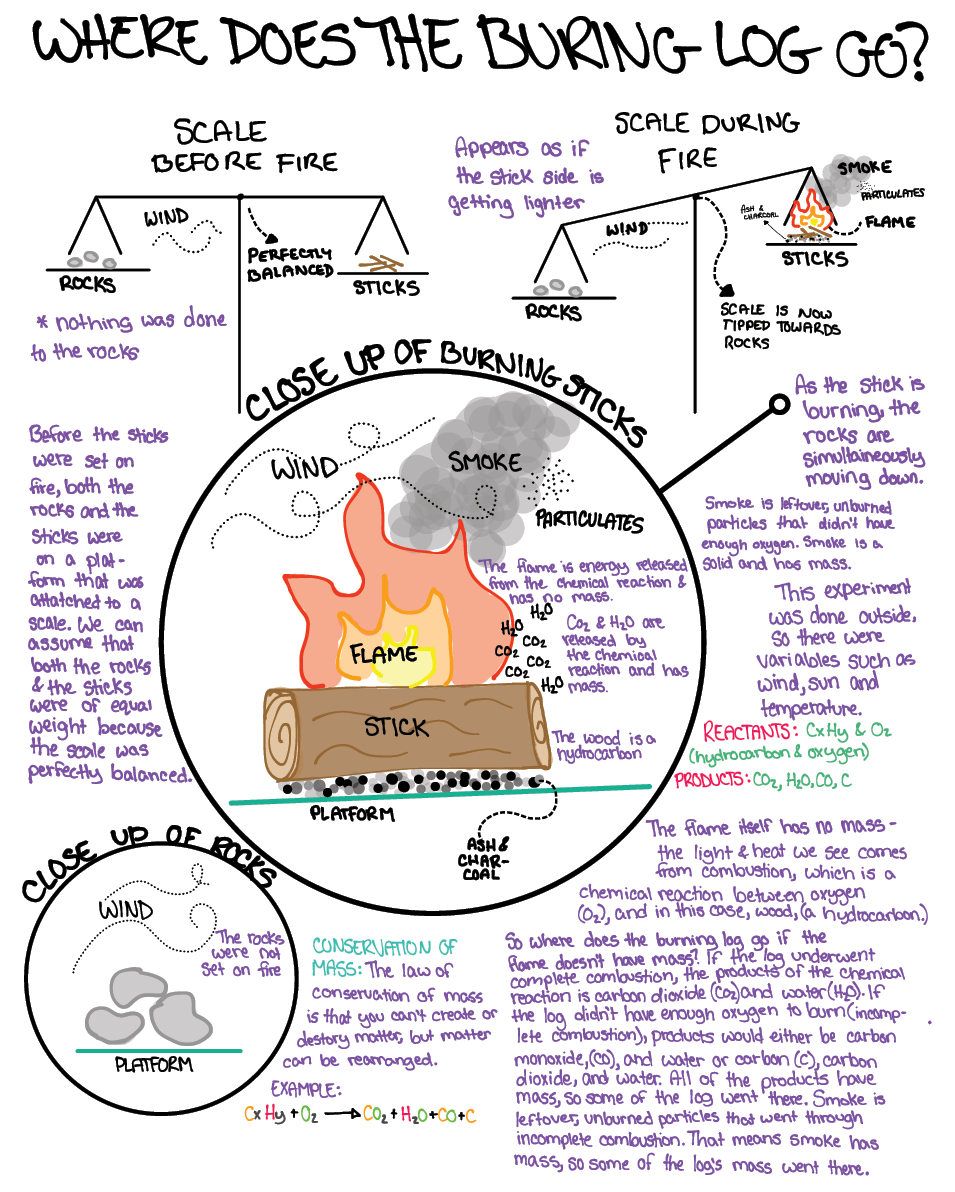
Our next step was to consider the phenomenon more directly. On a large outdoor balance, we showed some small wooden logs on one tray in balance with some rocks on the other tray. We ignited the wood and observed the tray with the burning log rising upward as the mass “disappeared” (Figure 2). Online, we showed students the video of the demonstration (https://media.oregonstate.edu/media/t/1_12lymt7s). A smaller demo could be created in a chemical fume hood. Students then annotated photos of the apparatus to illustrate their current understanding of what was happening to the log as it burned (Figure 3).
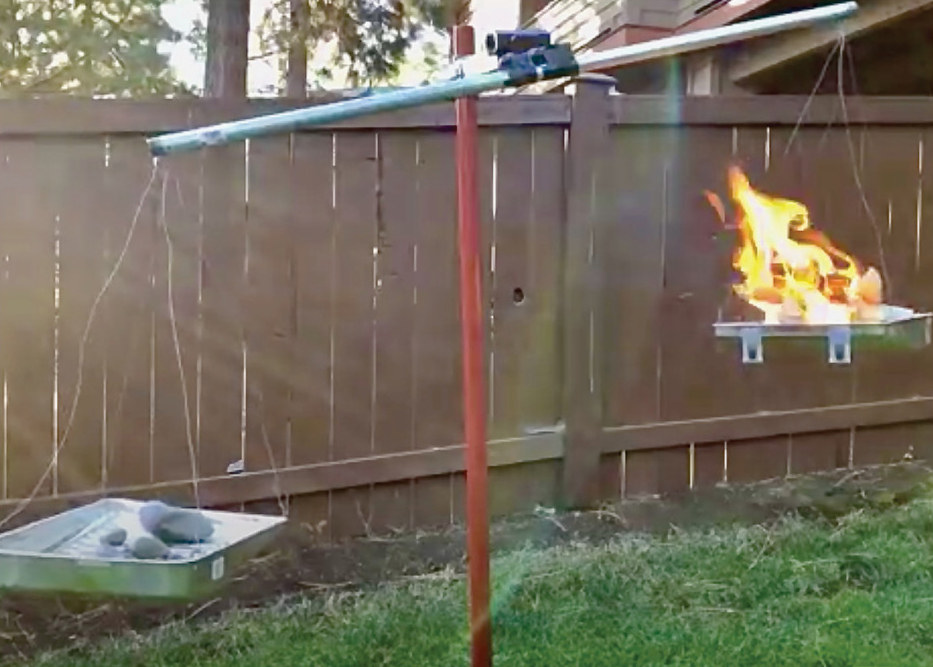
The burning log rises upward as the mass “disappears.”
Student annotations illustrate their understanding.
After drawing models to identify the edges of existing ideas, students recognized the need to understand combustion. Talking through their models, students realized that while some of the log material seemed to become ash, it clearly did not account for all of the missing mass. With this need-to-know, we led the students through the scientific consensus model of combustion, which accounts for most of the missing mass. To further illustrate the point, students predicted what would happen to ethanol ignited in a watch glass. Connecting to the simple explanation of combustion, we exposed the burning ethanol fumes to Bromothymol blue (BTB) to test for CO2 and with cobalt chloride paper to test for H2O. Students were then given physical or digital molecular models to work out C2H5OH + 3O2 → 2CO2 + 3H2O, noting if any atoms were leftover.
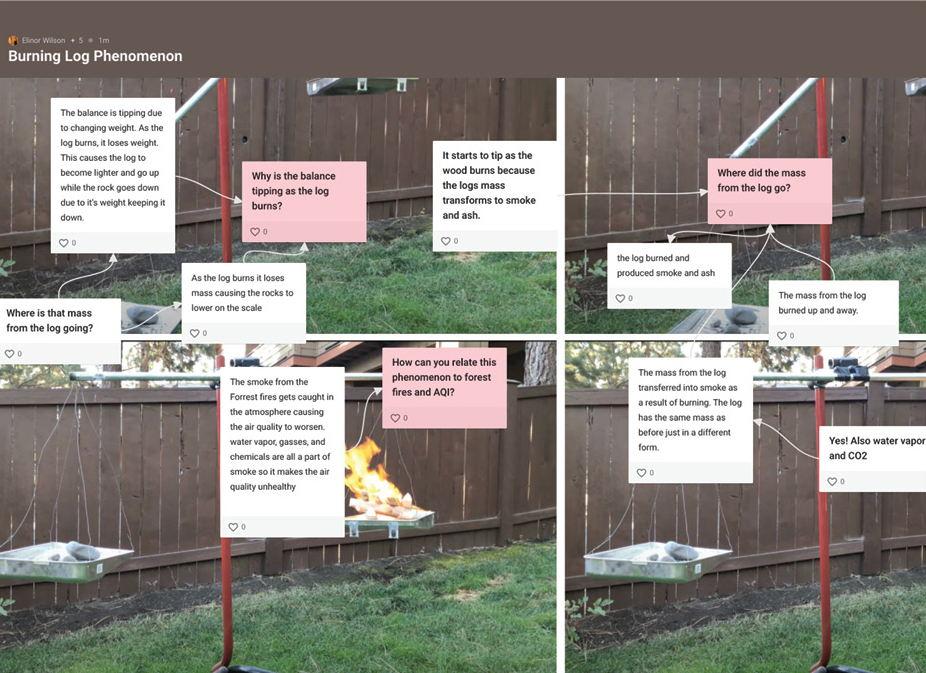
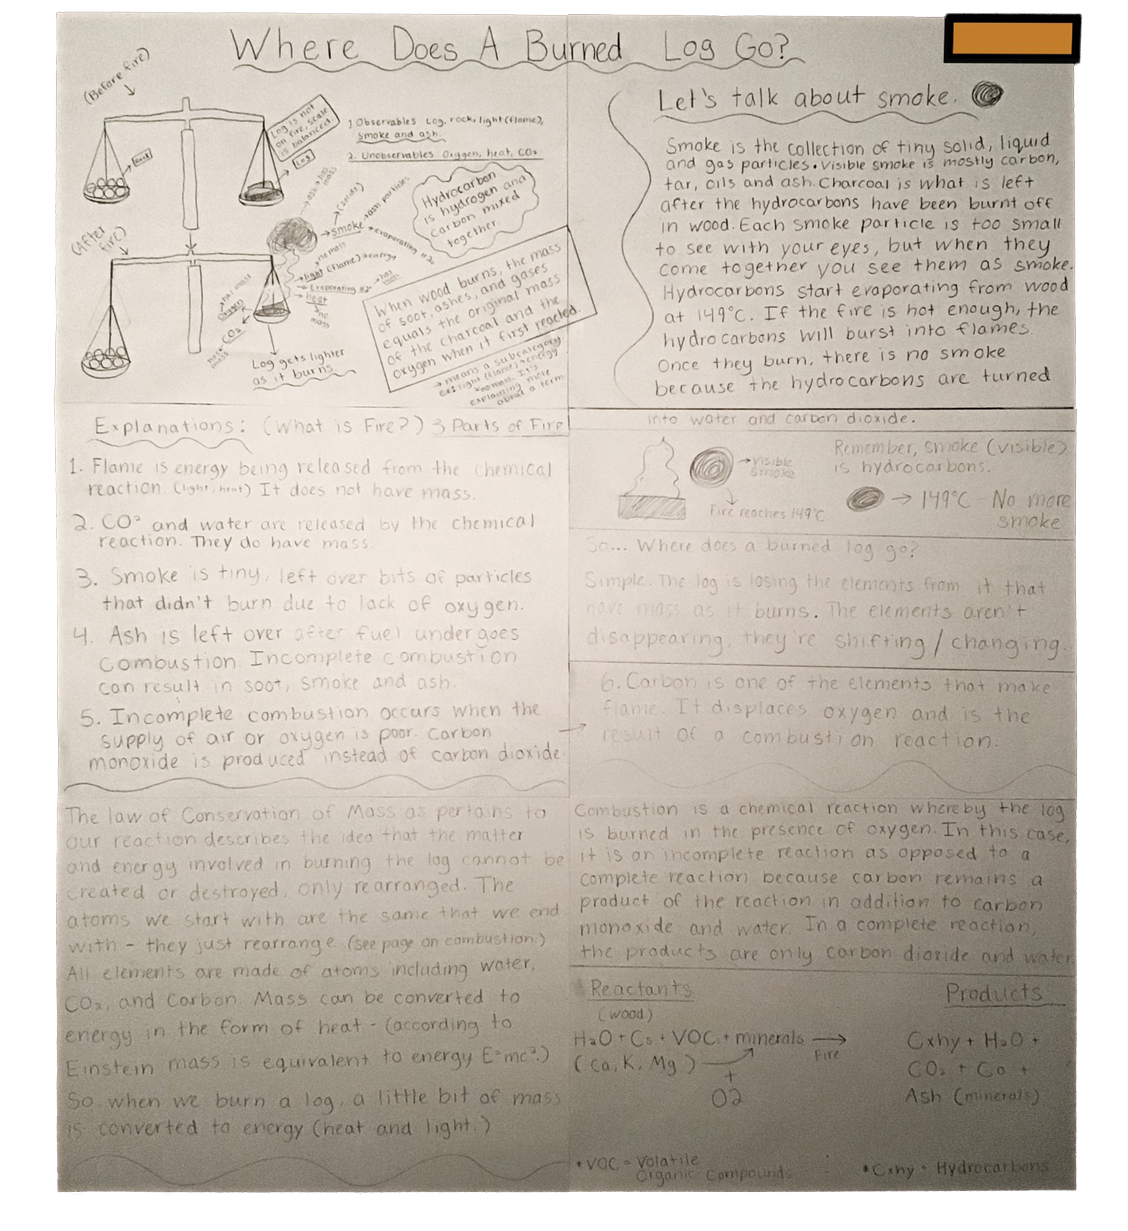
In the classroom, we would use more formal physical models; at home we asked students to use coins representing different atoms or prepared Google Slides they could manipulate to digitally represent the compounds. Transitioning from the simple combustion of ethanol to combustion of compound ratios closer to generalized wood (approximately 50% C, 42% O, 6% H, 1% N, and 1% other elements), we asked students to consider what products might result. They identified a greater number of leftover atoms, particularly carbon, which we identified as the soot and particulate matter (PM) that is measured in air quality indices. Students revised their own models to account for this new information, and checking models allowed us to formatively assess if students had an accurate, if incomplete, understanding of “Where does a burned tree go?” Examples of students’ developing explanatory models are shown in Figure 4.
Student exploratory models.
Students continued to expand and develop these models as the investigation branched out to wider Earth systems. As a group formative assessment, we adjusted a summary chart to track our progress (Windschitl, Thompson, and Braaten 2018). It is important that students understand the limits of this model, particularly because an actual tree or forest is more molecularly complex than the simplified molecular models we used. While our students were not prepared to delve into the complex chemistry of the many low-level compounds in vegetation, this could certainly be a launching point in advanced chemistry courses. We also return to these models later in the year when we discuss carbon cycles and climate change.
Further investigation
The revised models then begin to drive additional questions about what happens to a burning log. Students wrote down questions related to the cycling of nutrients in the forest and the composition of the smoke and gases being released into the atmosphere. Students were particularly interested in the impact of those compounds on the environment and humans, something they have experienced in their own lives. While these models and new questions could take off in many productive directions, the teacher can honor the importance of all ideas while using just a few to focus the next investigations aligned to standards or curriculum that needs to be addressed.
In considering the burning logs pan balance and molecular models, students realized that the mass must have gone somewhere else and quickly identifying the atmosphere. Working from the smoke depicted in the students’ drawn models, we showed students images of two different wildfire smoke plumes (Figure 5), launching a conversation about what is in wildfire smoke as students realized it must not always be the same. Ideally, we would simulate complete and incomplete combustion in a chemical fume hood and also burn three different wood splints (hickory, juniper, and pine) and ask students to note the different smells. Our students were able to do this from memory, noting how juniper campfires smell quite different than others. This observation led to a supported discussion around volatile organic compounds (VOCs) and other compounds that are present in a wildfire smoke plume. More advanced classes could investigate the cycle of VOC, NOx and ozone (O3) production in the atmosphere (Figure 6).
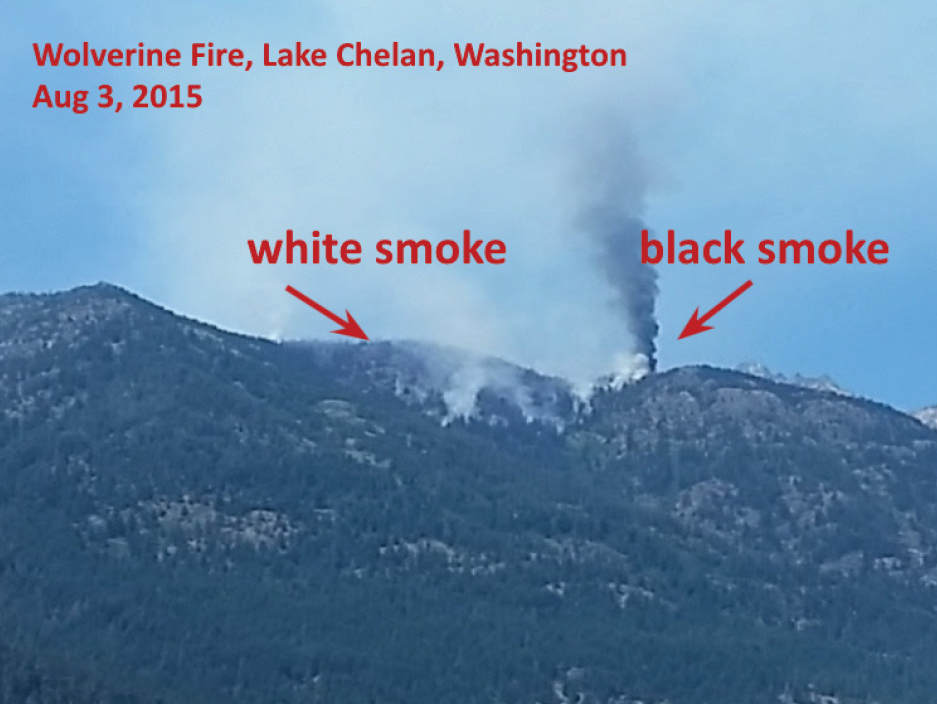
Two different smoke colors from a single fire.
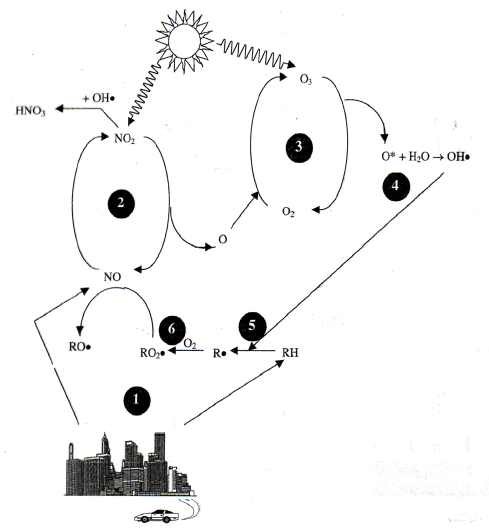
The nitrogen oxides (NOx) to ozone (O3) cycle.
Online data
To better understand the wildfire smoke itself, we turned to online data repositories. We have found that the Environmental Protection Agency’s (EPA) AirNow Network (https://www.airnow.gov/) and the Purple Air citizen science (https://www2.purpleair.com/blogs/blog-home/community-scientists) network are the best options for classroom use. The sensors can be found in most municipalities and neighborhoods throughout the United States. They report levels of 2.5 micron particulate matter, the size dangerous to human health as an Air Quality Index (AQI). Both websites allow for easily readable data tables and graphs that can be exported. We asked students to analyze these data to compare sites and wildfire events.
We also prepared graphs from the Mt. Bachelor Observatory (MBO) data so that students could compare other pollutants (O3, NOx, VOCs, CO2, CO) at baseline with wildfire events and add to their models of the burning logs. We asked students to use data to predict the number of days the EPA would consider dangerous due to ozone pollution if the number of wildfires doubled in a given year. This led to student deliberations as to whether that would be a linear relationship due to wildfire seasons. The MBO data also helped students identify the global scale of atmospheric pollution, as specific air pollution events at this mountain in Oregon can be traced to events adjacent to the mountain or thousands of miles away with carefully annotated data displays. An advanced physical science or chemistry class could segue this discussion into a spectroscopy lab, either online or in the lab.
Once students understand the components of wildfire smoke, they are poised to understand that the plumes change over time and in reaction to other natural phenomena by looking at data sets of plume composition over time. Dan Jaffe, a professor of atmospheric chemistry at the University of Washington, maintains several publicly available data sets that reveal such changes in wildfire plumes. His data have been collected at monitoring stations on the tops of mountains, in planes, and in several other key places.
The balance between ozone O3 and NOx, catalyzed by sunlight, is a contextualized example of an oxidation reaction that can be modeled to practice molar ratios. Atmospheric O3 production follows a perfect normal distribution (bell curve) as NOx increases. Using molecular models and/or Lewis structures, students can explain why this pattern occurs and then begin to connect this back to the changing levels of NOx in a smoke plume over time. This can also lead to a discussion of O3 as helpful in the upper atmosphere and toxic in the lower atmosphere where life is concentrated.
Effects on health and ecology
Early in the modeling process, students identified the smoke as something they have experienced, noting that the smoke enters living things, and leading them to consider health effects. We asked students to write about a time they experienced wildfire smoke, including what they observed and felt, and then to imagine living in a place that experiences similar air quality every day (e.g., Hotan, China). Our region had just experienced terrible air quality (AQI 400–500) for many days. We connected this back to the particulates in smoke and students noted that the EPA supplies data on different particle sizes, issuing health warnings with PM2.5 rather than with PM10. Students’ multifaceted models explaining where a burning log goes now included human beings inhaling the particulates and students began to hypothesize why the different particle sizes might have different effects on human health. This point in the modeling of the burning log phenomenon provides another opportunity for formative assessment and a natural transition to a new unit on pathology, anatomy and physiology, or molecular biology.
In their modeling and exploration of the burning tree phenomenon, students inevitably identified that some of the burned material goes back into the soil. To connect wildfires, ecology, and indigenous peoples, we asked our students to read a chapter of Robin Wall Kimmerer’s book Braiding Sweetgrass. In the chapter “Burning Cascade Head,” the author describes the historical (but now suspended) practice of controlled burns by Native Americans to replenish soil nutrients for the benefit of plants and animals. Our discussions allowed us to connect cultural tradition with conservation of mass and cycling of nutrients within biological as well as physical Earth systems.
Conclusion
As students suspended their modeling process of the burning logs, each student ended the process with differing highlights to their understanding, and these were reflected in the continuously iterated models. In concluding the unit, we ensured through structured conversation that each student understood that all of the models could be correct, and collectively, they were stronger in explaining the complexity of a log burning and becoming part of the atmosphere. As summative assessment, we checked each model for a clear foundation of conservation of mass, illustrated the systemic connections between wildfire and both physical and biological systems at a global scale, and assessed whether students understood the role of both chemical and physical reactions as rearranging matter in the environment.
Enacting this learning sequence required an average of three weeks. However, this approach allows for considerable flexibility as the teacher can align the end of the modeling process to the student understanding they wish to achieve. A simplified version could be enacted within two class periods. At first the modeling process can feel time consuming. However, students then continually iterate on their existing models, saving considerable time. Subsequent conceptual additions move much faster than they would without the existing model as students are expanding on existing conceptual and contextual frameworks, and are motivated to discover the next piece of the explanatory puzzle.
Web Resources
Mount Bachelor Observatory context and data : https://blogs.uw.edu/djaffe/mt-bachelor-observatory
Burning log pan balance phenomenon video: https://media.oregonstate.edu/media/t/1_12lymt7s
Purple Air Network data: https://community.purpleair.com/c/data/7
EPA: Environmental Protection Agency’s (EPA) AirNow Network: https://gispub.epa.gov/airnow/index.html?tab=3
Concord Consortium Wildfire Modeling: https://wildfire.concord.org
Ambitious Science Teaching resources: https://ambitiousscienceteaching.org
Michael Giamellaro (giamellm@oregonstate.edu) is a professor in the College of Education, Oregon State University–Cascades, Bend, OR; Elinor Wilson is a teacher at Redmond Proficiency Academy, Redmond, OR; and Heidi Dixon is a science teacher at REALMS High School, Bend, OR.
Chemistry Climate Change Earth & Space Science Environmental Science Interdisciplinary Lesson Plans Phenomena Physical Science