
feature
Hair-Raising Fun!
Making sense of student-generated diagrams
The Science Teacher—September/October 2022 (Volume 90, Issue 1)
By Sherab Tenzin, Mihye Won, and David Treagust

Van de Graaff generator safety notes
The Van de Graaff generator must be inspected in the same way as other equipment and must be determined that it is safe before using it. While a short shock can be experienced by coming in contact with Van De Graaff generator, there are no reports of serious injury caused by it. Though the risk is small, due to difference in the sensitivity and potential medical issues, some persons may experience the shock to be very unpleasant or painful. After the hair-standing-demonstration, a sudden discharge should be avoided by touching objects made from wood (such as a wooden ruler). It is best to avoid contact with metal fittings.
Before allowing a volunteer to physically come in contact with the Van de Graaff, shut off the generator and discharge the sphere. Once their hands have been placed on the sphere, the generator can be turned on and off in short bursts to slowly build up the charge. Once the subject’s hair is fully extended, the generator can be shut off, though the charge will slowly drain away as long as the generator is off. If you leave the unit running, the effect is much more pronounced—but more importantly, sparks may begin jumping from the volunteer’s body to nearby objects and/or the floor which could create a potential hazard and resulting safety risk.
It is strongly recommended that anyone with medical issues involving medical equipment implants like pacemakers; insulin pumps; hearing aid or any medical-related electronic devices; and also anyone prone to heart issues, nerve disorders or seizures, avoid an operating Van De Graaff generator.
People with heart conditions and medical equipment implants should be discouraged from taking part in the experiment. Electronic devices should be kept away from the generator as it is known to damage electronic circuits.
Van de Graaff generators can also present a real potential hazard to electronic devices with electronic chips or circuit boards such as cell phones, cameras, watches, computers, clocks, headsets, TVs, modems, routers or phones plugged into the same circuit as the generator. Therefore, electronic devices should be kept at least 20 feet away just to be safe.
Also, do not operate near electrical equipment such as computers, televisions, or magnetic recordable devices (VCR tapes or floppy disks). Make sure no flammable gases are present.
Do not use a Van de Graaff generator near water, grounded water faucets, or other grounded objects such as doors or walls.
The motor produces a lot of heat over time and can damage the belt or motor itself. Do not run the van de Graaff for long periods of time to prevent potential overheating.
Lastly, never allow students to use a Van de Graaff generator unsupervised!
- For additional safety information relative to safely operating a Van de Graaff Generator, see: “Van de Graaff Generator Safety” by Flinn Scientific at: https://www.flinnsci.com/api/library/Download/55117bbd809b4730a34e5c3c2335fc31
- “Van de Graaff Generator Safety” by Nuffield Foundation at: https://spark.iop.org/van-de-graaff-generator-safety#gref
Science diagrams are an integral part of science because they are an important means of conveying and visualizing abstract science content (Kozma 2003). In recent years, researchers have demonstrated the educational benefits of encouraging students to draw their own conceptual diagrams, rather than focusing on interpreting diagrams given to them (Tippett 2016). Drawing conceptual diagrams not only helps students’ sensemaking process but also their construction of deeper scientific understanding (Ainsworth et al. 2011).
To help students utilize this powerful learning strategy, teachers need to be aware of how to support and guide students’ drawing diagrams. However, there are no practical resources for teachers to adopt to interpret students’ diagrams and provide students with constructive feedback for conceptual and representational knowledge development.
In this article, we explain the method that researchers developed after many rounds of evaluating student-generated diagrams. We start with an explanation of the lesson and the importance of teachers having hands-on experiences drawing the diagrams before the lesson. Then, we suggest that teachers explore the concept to gain a deeper understanding and ensure that the clarity of the concept is evident. Then during and after the lesson, we look at four overarching procedural features of analyzing students’ diagrams: the importance of focusing on the big picture as well as on details by zooming in and out, use of representational conventions, reading the written text, and scrutinizing the diagram multiple times.
The lesson
To illustrate the diagram analysis, we chose one particular lesson from a ninth-grade science class on static electricity using a Van de Graaff generator with 21 students. In the beginning of the class, the teacher performs a short demonstration. A student, standing on a rubber mat, touches a positively charged Van de Graaff generator (see Safety Note). After the student’s hand touches the generator, his hair slowly rises and stays up even after removing his hand from the generator. His hair falls only when the student steps off the rubber mat and touches the floor.
After a short class discussion, students draw a diagram of their understanding of what happened in four stages of the demonstration and explain why they occur:
- Before touching the dome (no contact)
- While touching the dome (in contact)
- After touching the dome (after contact), but before jumping off the insulating mat
- Off the insulating mat and touching the ground
Before the lesson
Draw your own diagrams
Before asking students to draw conceptual diagrams, it is important for teachers themselves to draw the diagrams. This activity not only provides a clear sense of what the teacher is aiming for students to draw, such as a causal explanation in relation to the key science concepts, but also helps understand the conceptual and representational challenges that students would face while drawing diagrams. The diagram will also serve as a reference point. Figure 1 shows the sample diagram the first author drew and the description of the key concepts.
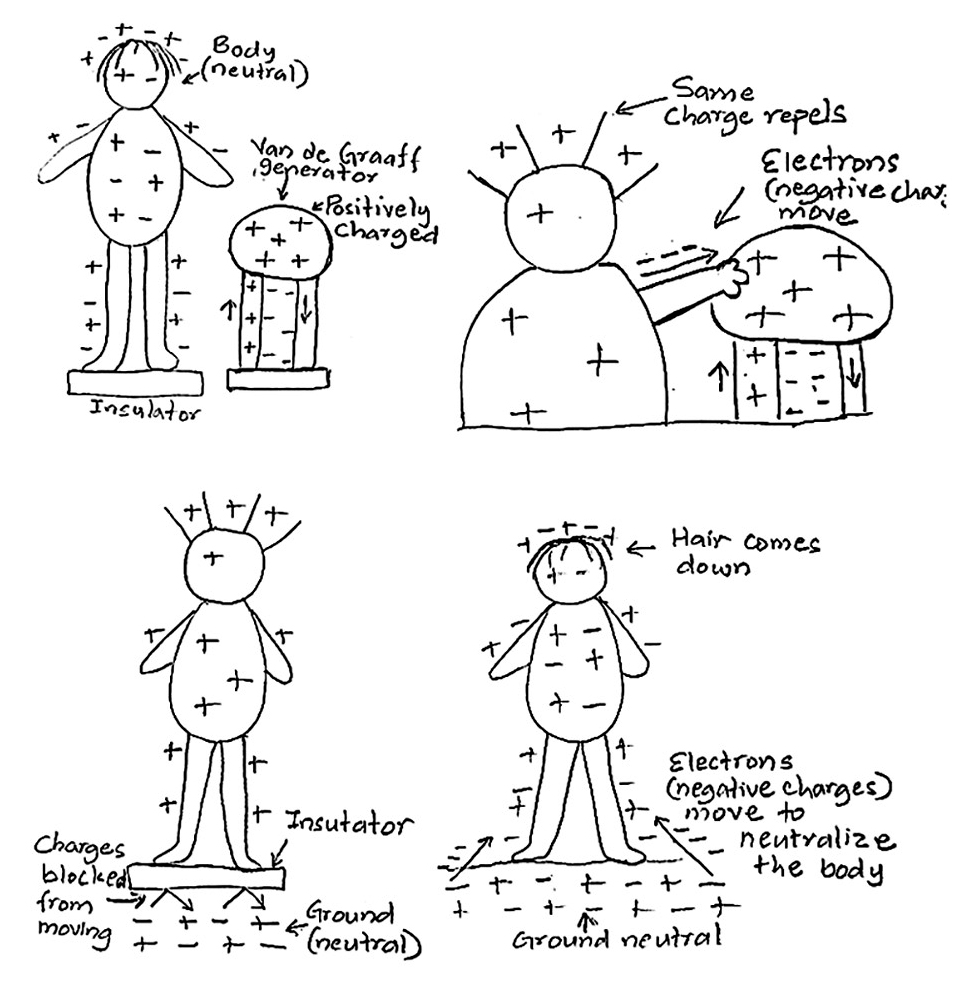
Sample diagram by the first author (Van de Graaff generator experiment).
The first diagram shows the setup of the experiment—a person with neutral charge (positive and negative equally distributed throughout the body), the Van de Graaff generator (positively charged metal dome and rubber/glass belt moving positive and negative charges), and insulator/rubber mat (blocking a flow of charge from and to the ground). The second diagram shows the flow of electrons from the person to the metal dome. The person becomes positive and hair stands up because the same charges repel. The third diagram shows the insulator stopping the flow of electrons from the ground to the person. In the fourth diagram, electrons move from the ground to the person and neutralize the positively charged body. And hair falls as it becomes neutral.
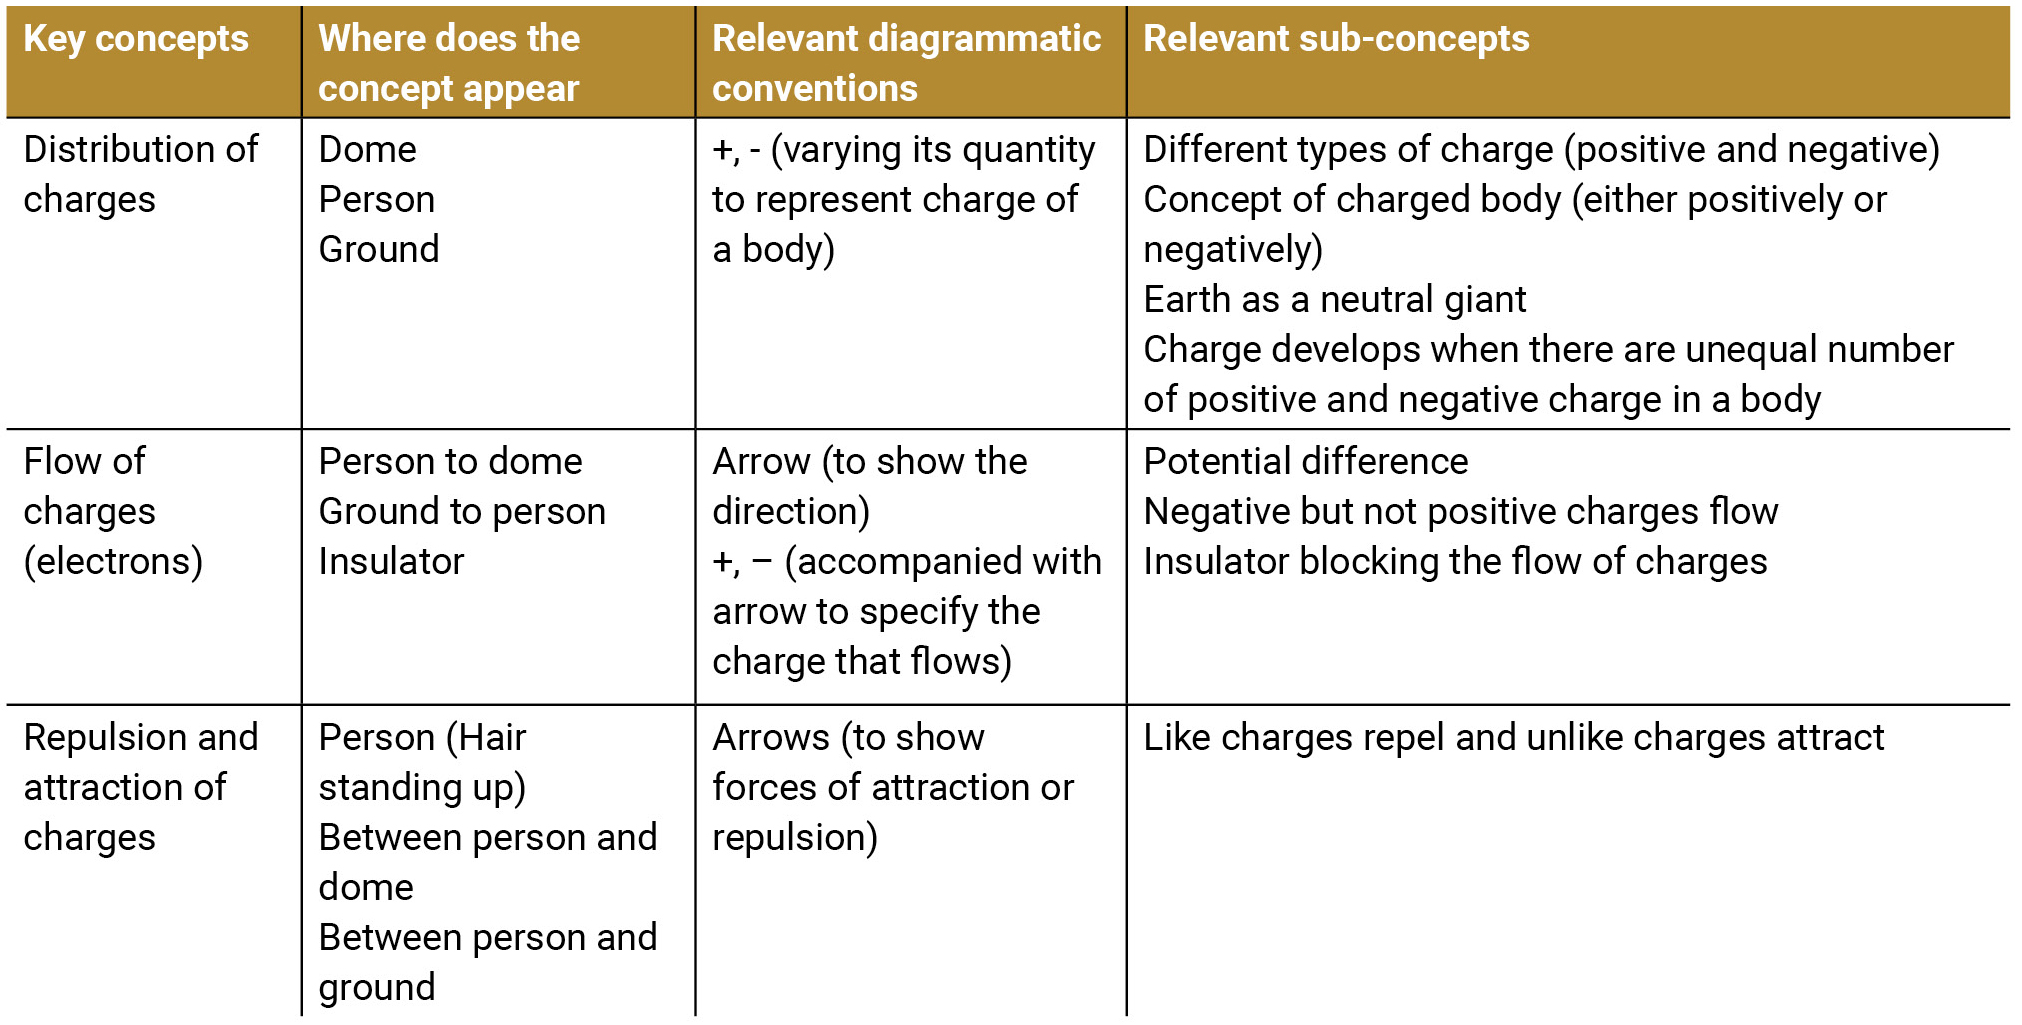
Organize the science concepts and the use of representational conventions
This activity is linked to the previous one. Drawing a diagram will help in identifying and organizing the concepts involved in the experiment. This process ensures clarity in what the teacher is looking for in the diagrams. For instance, in the Van de Graaff hair raising experiment, many different keywords were identified initially, but this list did not really capture what the students were supposed to do in relation to their level of understanding. Instead of looking for the key words, it is best to look for key science concepts and examine how these concepts are represented in the entire diagram. In the Van de Graaff experiment, after multiple iterations, three key concepts were identified as shown in Table 1.
During and after the lesson
The big picture
While analyzing a diagram, it is important to look for the key concepts that were previously identified in the diagram. For instance, based on Table 1, teachers would want to look for how students are representing distribution of charges, flow of charges, and forces between charges. Doing this gives a general idea of what concepts are represented and what concepts are missing. Then look at the details of how students are representing their diagrams. If there are any good ideas or alternative concepts, take note of this and look for the ideas or concepts in other diagrams. After analyzing multiple diagrams, go back to the diagram and try to verify the earlier interpretation and see if it is still valid or not.
In Figure 2, we can see that the student has shown the key concepts—distribution of charges, flow of charge, and forces between charges. The student has captured the key concepts and has a good understanding of the content.
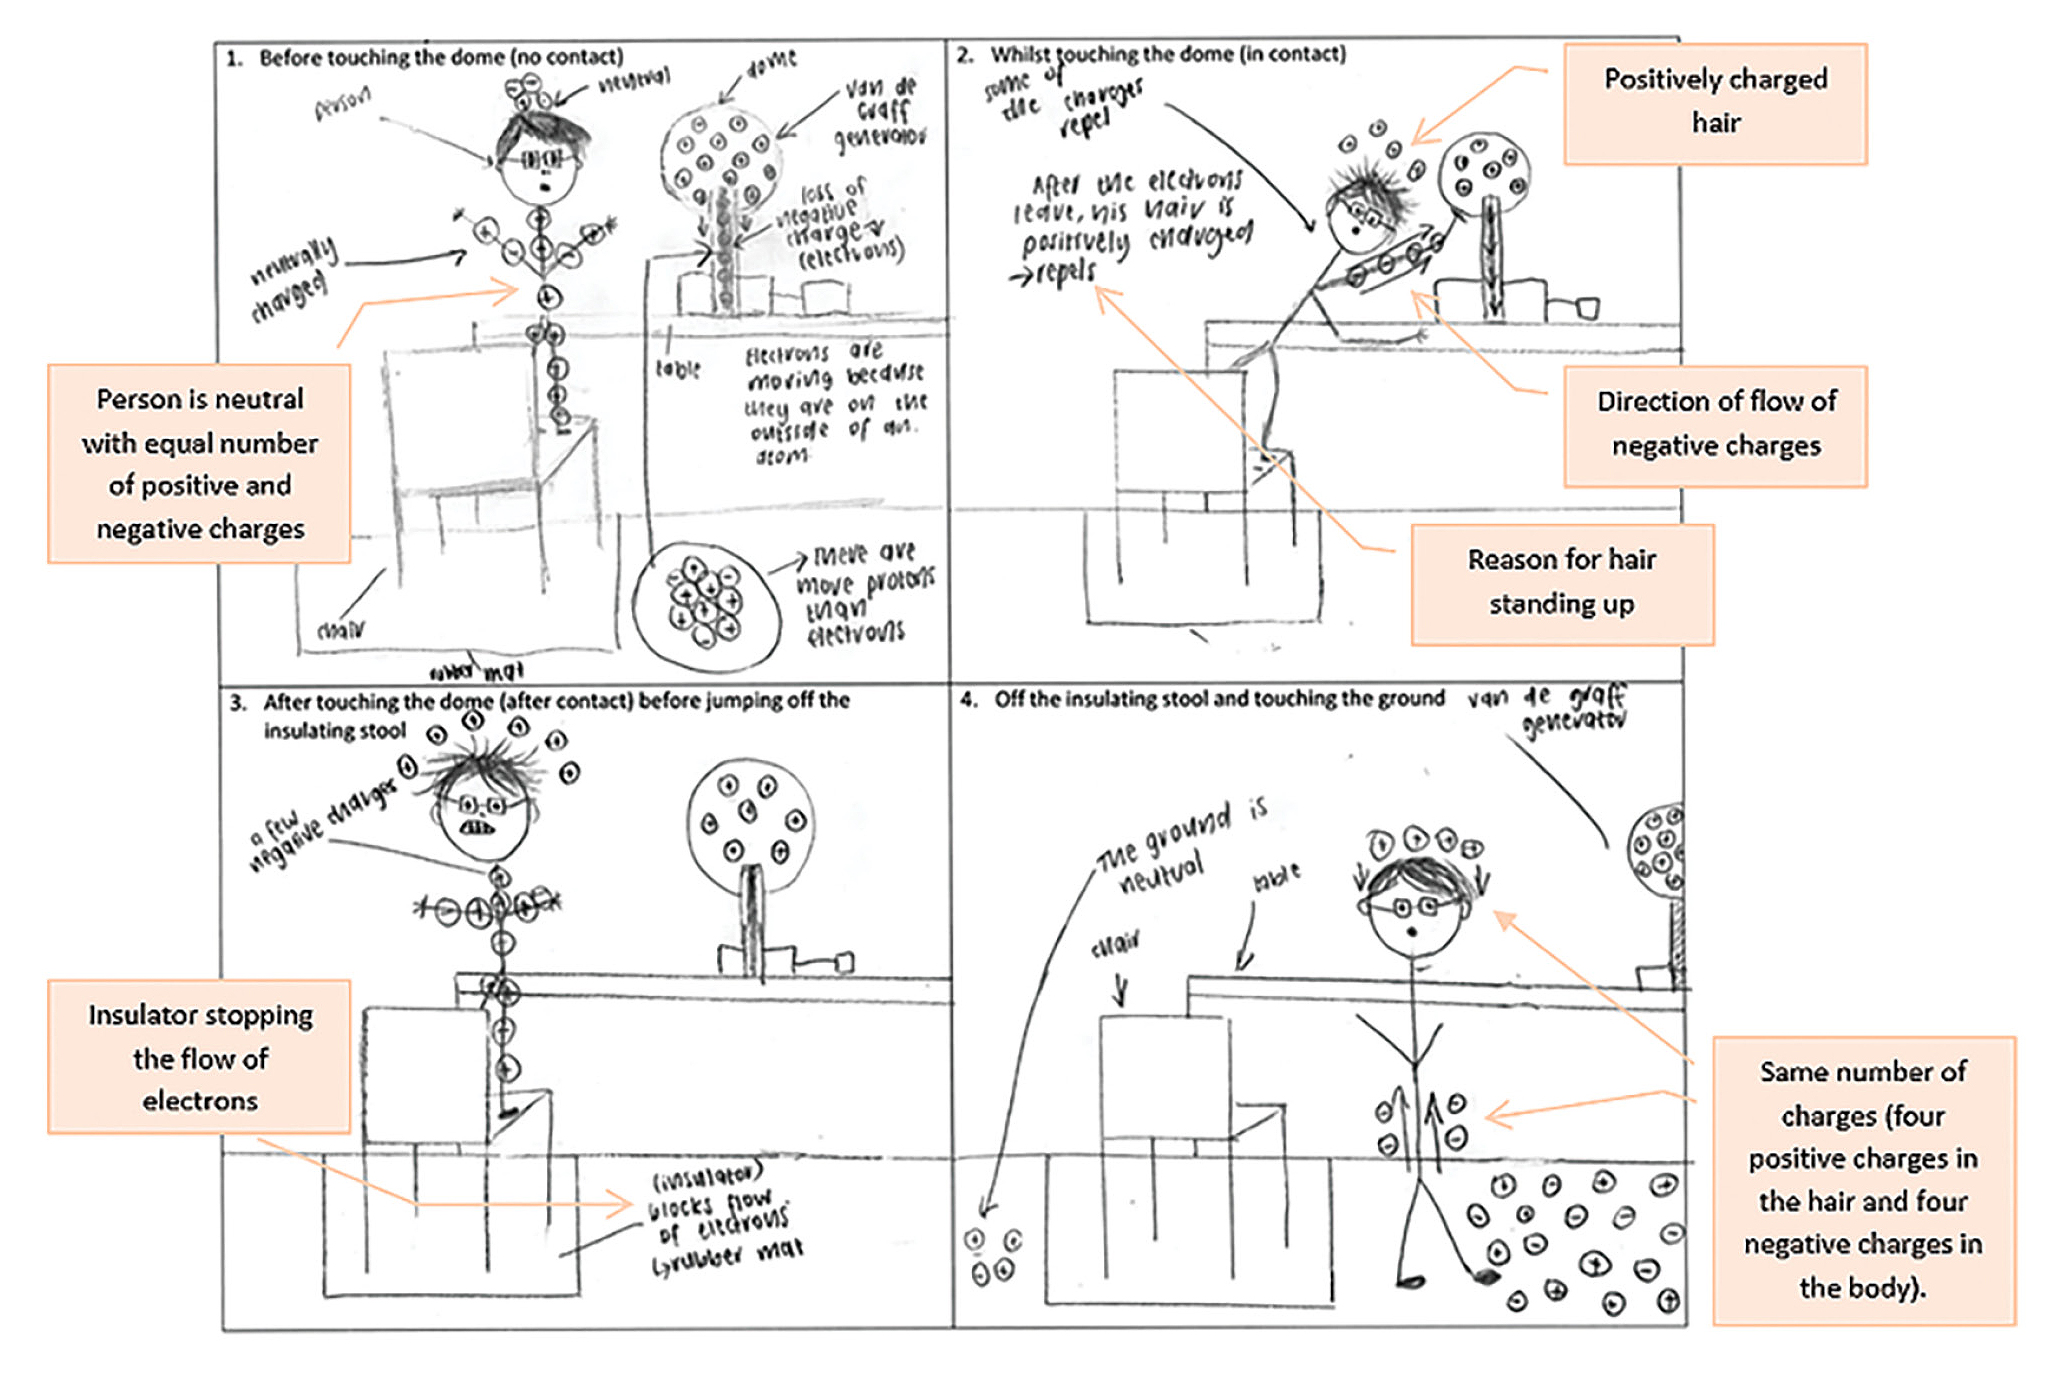
A student’s diagram that shows comprehensive understanding of the experiment (by Student #21).
Zoom in and out
After getting an overall idea of the concepts represented in the diagram, it is important to go through every part of diagram in detail. This task enables a teacher to see the coherence and consistencies in the diagram. A student may show scientific understanding of a concept in one instance but make mistakes or display misunderstanding in another instance. For example, in Figure 3, charge distribution in the first three frames is correct. However, in the last frame, the student has shown the person’s hair positively charged but fallen back to normal. As the student did not show the flow of charges from the ground to the body after touching the ground, it is not clear how she understood the flow of charges or the charge distribution concept. However, the student is aware of the insulator stopping the flow of electrons.
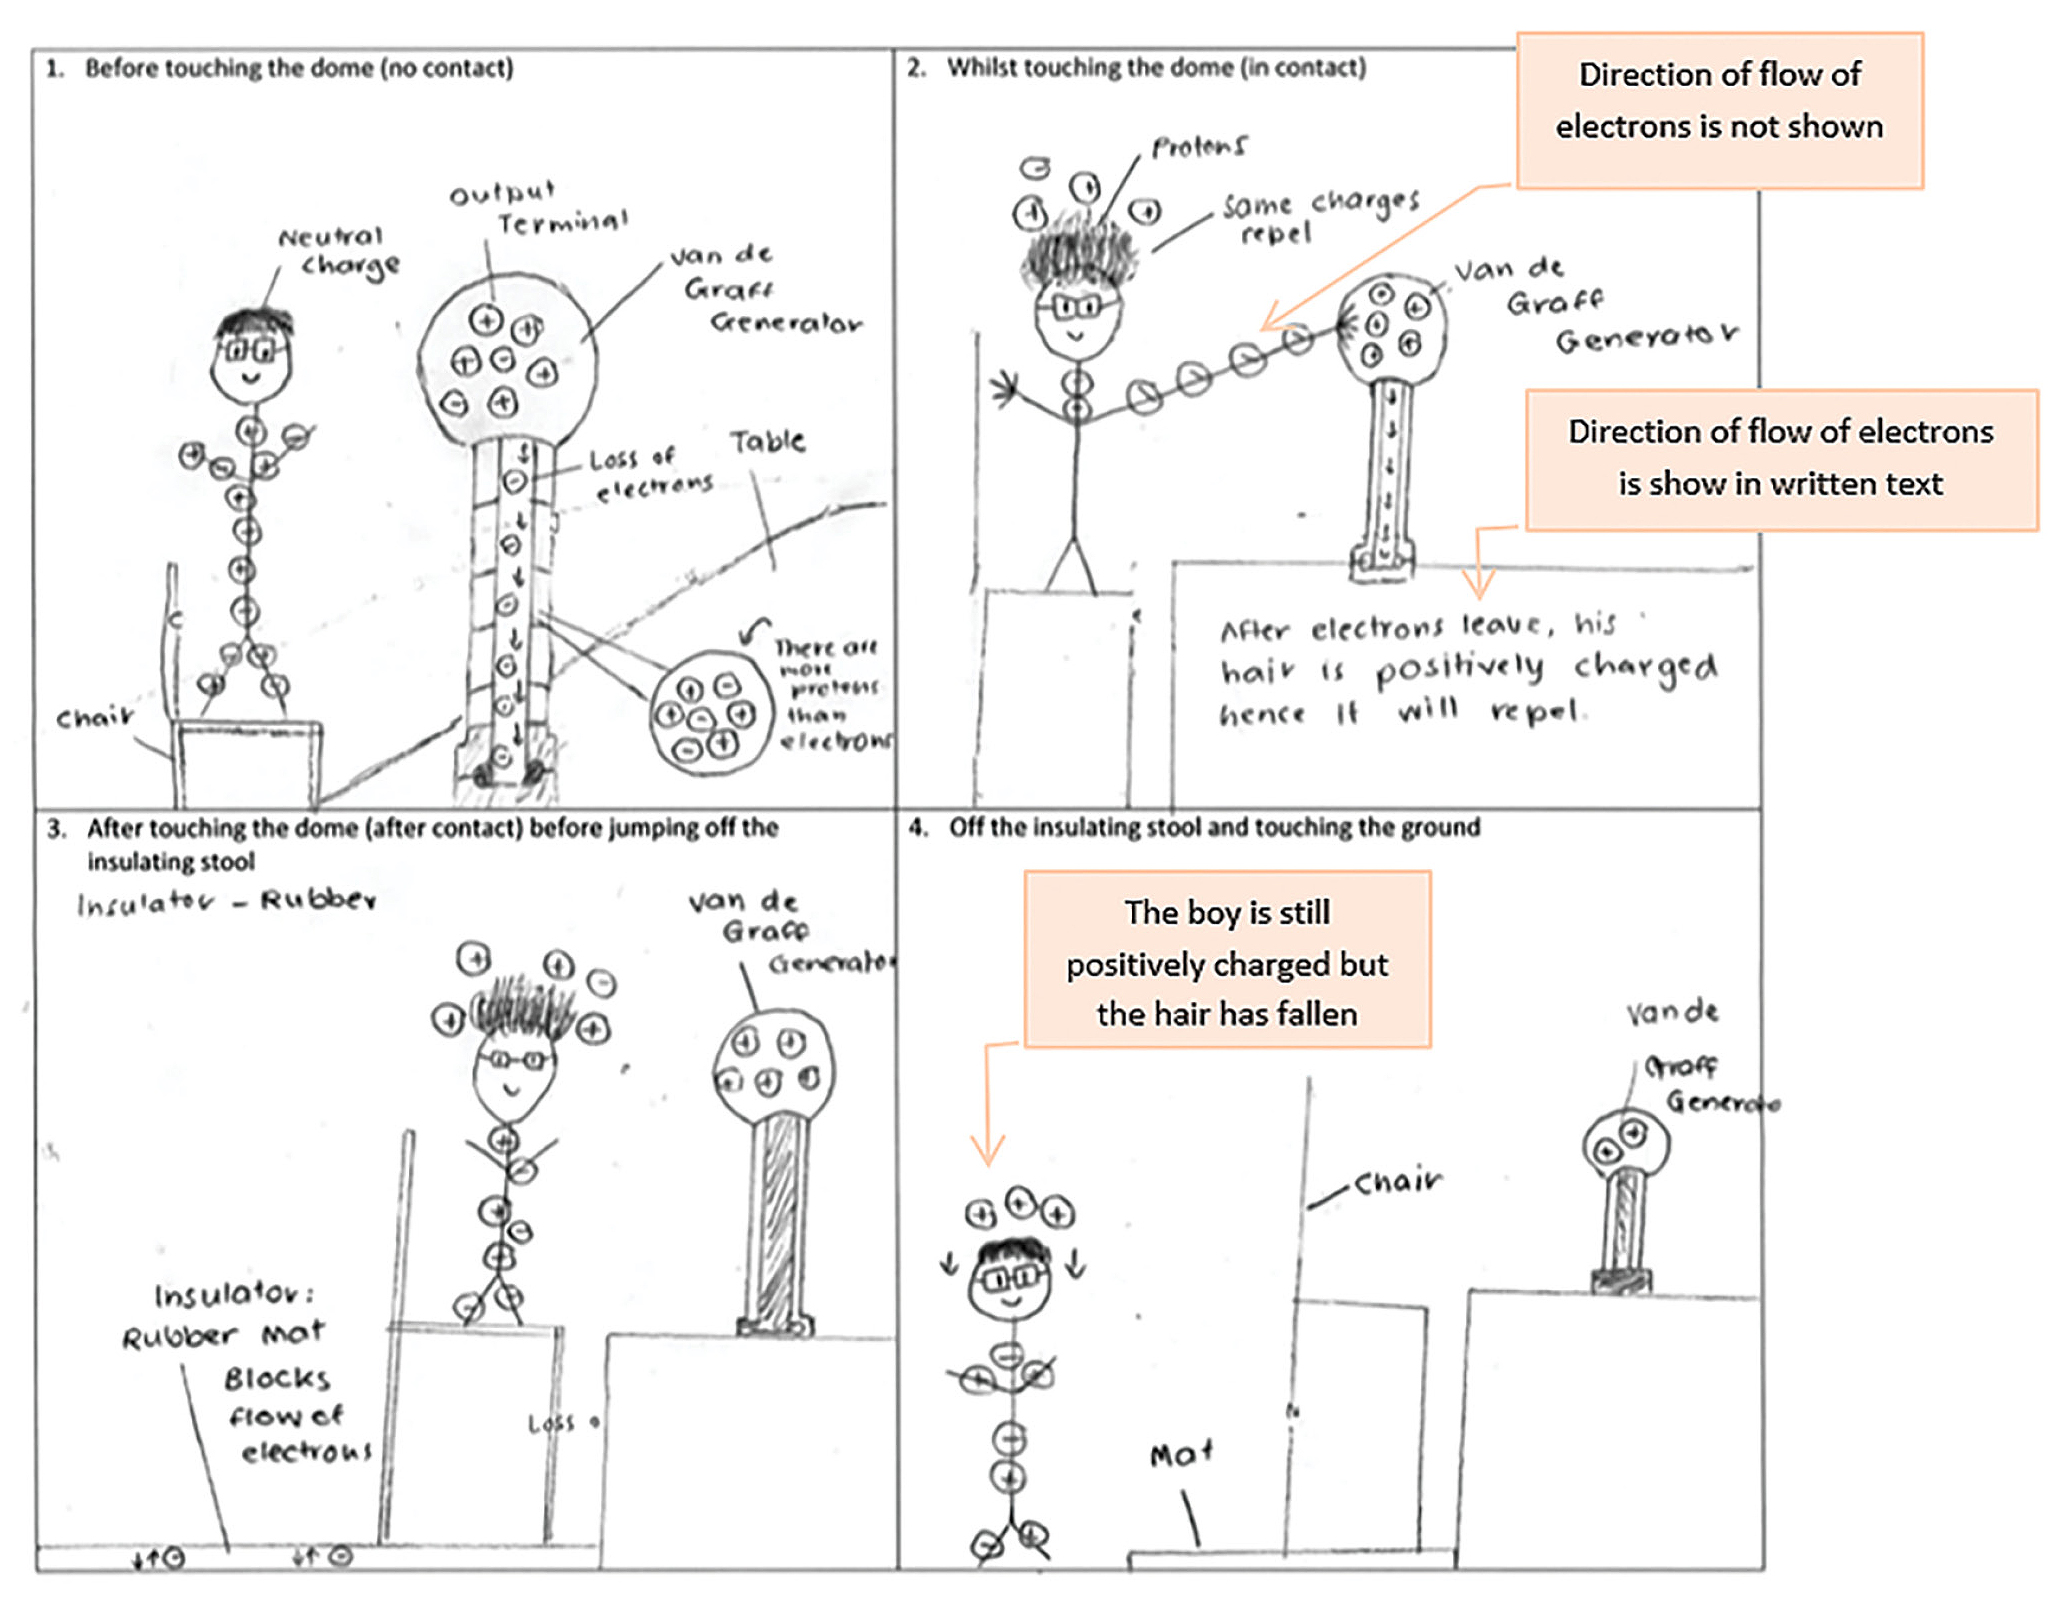
Another student’s diagram displaying some inconsistencies (by Student #18).
Overview of all the diagrams of the class
The other reason for zooming in and out is that while it is important to look at an individual diagram, it would be good to have a view of the broad picture of what all the diagrams of the class show. From this broad picture, we can see the common weaknesses and strengths of the class or of the taught lesson. In the Van de Graaff experiment, the most common weakness is representing the flow of charges. Many students are aware that charges flow, but the type of charge that flows or the reason that makes the charges flow is not very clear to them, with more than 65% of the students having made some form of mistakes in representing the concept related to the flow of charge.
Use of representational conventions
Diagrammatic conventions, such as labels, arrows, captions, and text boxes, are considered helpful in interpreting diagrams (McTigue and Flowers 2011). Figure 2 shows good use of conventions and organization making it easier to interpret. For each diagram, all the charges are shown to be enclosed in a circle. Arrows are used for labeling, to show the direction of flow of charge, and to show hair falling back in place. Though used for different purposes, the purpose of each arrow is clear. All the text is associated with an object in the diagram either by using arrows, proximity, or through inclusion (enclosed within the object).
Also read the written text
Students’ diagrams combined with written explanations tend to capture the concept better than that diagrams without written text. Some concepts are difficult to draw, especially for students with limited diagrammatic representational skills or experiences. It is important for students to develop these skills, but before acquiring them, students will naturally use written explanation that has been part of their prior learning. It is therefore important for teachers to read the written text in the diagram to see what the student is trying to express. For example, in the second frame of Figure 3, the direction of flow of electrons upon touching the dome is not shown. However, this is clearly reflected in the written explanation.
Scrutinize the diagram multiple times
It is necessary to “read” the students’ diagrams multiple times and from different angles to understand what students attempted to represent and how. It enables the teacher to see additional information, connections, and links between different parts of the object, which were missed in the earlier viewing. An example of this is the initial reading of the diagram in Figure 2. In the last frame the student showed positively charged (not neutral) hair falling back. However, following analysis of other diagrams, it became apparent that students tend to focus on the total number of negative and positive charges in the whole body to represent the neutralization of the body, rather than evenly spreading the charges to show neutralized hair. This led us to reevaluate the diagram, where the student in fact drew the same number of charges (four positive charges in the hair and four negative charges in the body).
Conclusion
Though using student-generated drawings is associated with positive science learning outcomes, there are challenges in using the strategy in the teaching and learning processes. There are many aspects to this teaching approach, such as selecting appropriate activities for drawing conceptual diagrams, and guiding students’ thinking through constructive feedback. Just as with developing the skills to evaluate student-generated diagrams, many aspects of this teaching approach demand continuous effort of reflection and practice to maximize the educational benefits. However, without trying and experimenting with the teaching approach firsthand, it will be difficult to develop the necessary skills and improve on them. Hopefully, teachers may find this short article useful and encouraging as they embark on their journey to adopt the teaching approach and make sense of student-generated science diagrams.
Sherab Tenzin (sherab.tenzin@postgrad.curtin.edu.au) is a PhD student, Mihye Won is an associate professor, and David F. Treagust is John Curtin Distinguished Professor at Curtin University, Perth, Australia.
Assessment General Science Lesson Plans Pedagogy Physical Science Physics Research Teaching Strategies High School