
Global Thinking Inside and Outside the Classroom
By Cindy Workosky
Posted on 2018-06-27
Dynamic Equilibrium. These two words represent what is essential in teaching Earth science: the idea that forces are constantly working against one another, but often do so in ways that nearly counteract one another.
In a river, deposition and erosion, as central concepts, can be used to explain a range of phenomena, such as meandering rivers and the richness of floodplain soils. For all of the crust being created at mid-ocean ridges, an almost equivalent amount is being destroyed in subduction zones. Stars are constantly affected by the equilibrium of a fusion reaction tearing them apart while gravity tries to shrink stars under its own immense mass.
In all of these situations, something approaching dynamic equilibrium is typical, but also some very interesting phenomena happen when equilibrium is no longer met. Indeed, Earth science offers so many examples of the NGSS Crosscutting Concept of Stability and Change, yet it is so easy to consider it as a law of averages: If the end result is close to zero, then why do the individual forces matter?

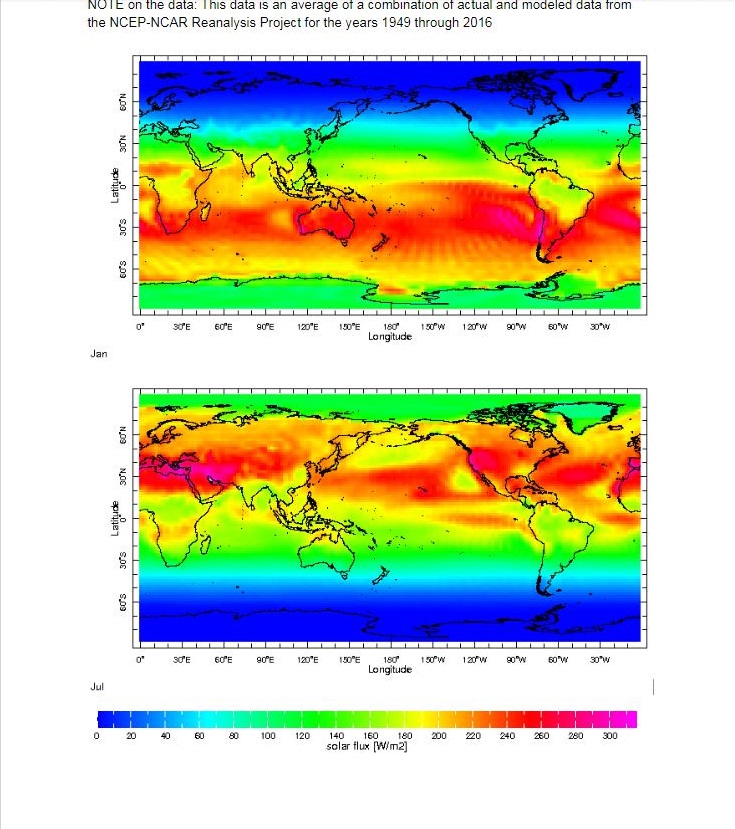
One instance of this idea occurs when teaching about Earth’s Energy Budget, the idea that our climate results from the balance of energy coming in from the Sun as shortwave radiation and escaping through a mix of long and shortwave radiation (shown in the chart above top). But this chart doesn’t tell the full story.
For shortwave radiation, the chart on the top gives a global average of 341.3 W/m2. But is it the same all across Earth? How do any differences unfold seasonally?
Climate models from NOAA show a very different picture of incoming shortwave radiation across seasons, where the tilt of the Earth changes the position of maximum insolation. This combined with regional differences, such as the large amount of cloud cover over the Amazon rainforest and a lack of it over deserts, causes subtle differences in how much radiation enters. Two maps showing seasonal differences in January and July using one of NOAA’s modeling projects (data set pulled from Lamont Doherty’s Climate Library, found here) are shown below the energy budget diagram. The question becomes this: Which chart should we use when teaching about climate? And if we choose the one on the bottom, how do we support students in constructing arguments and explanations for the differences they see?
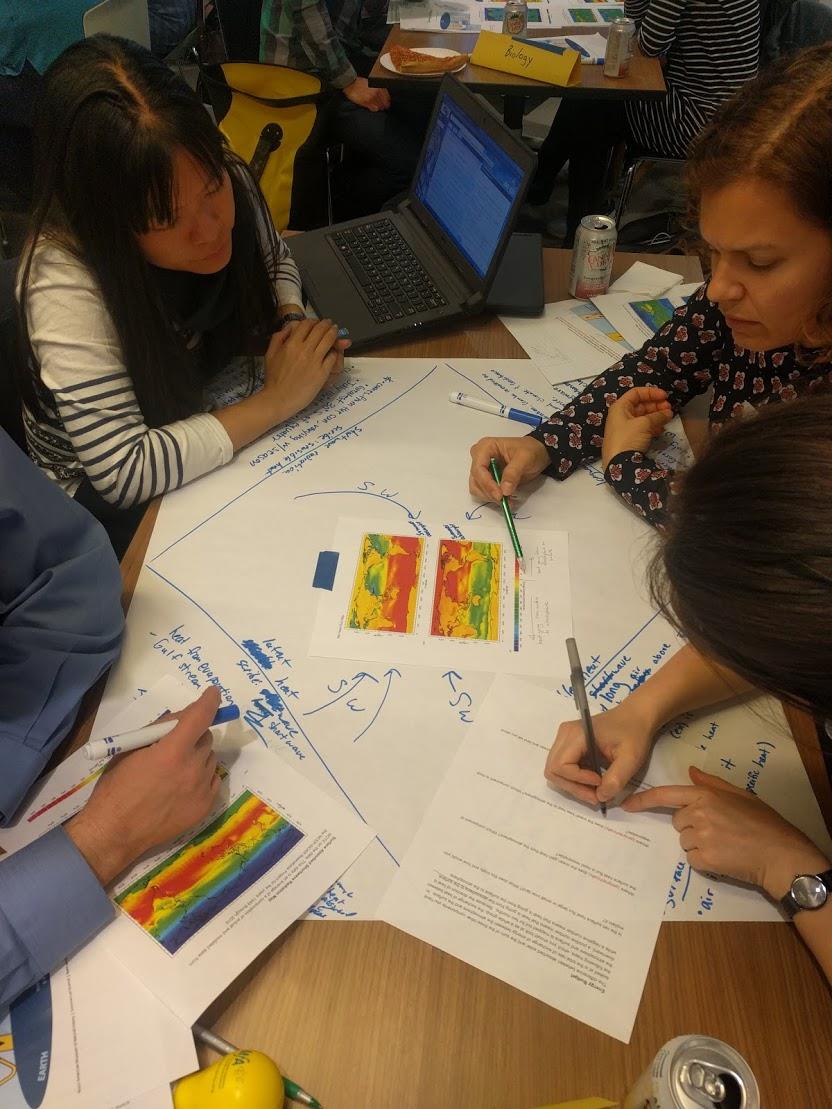
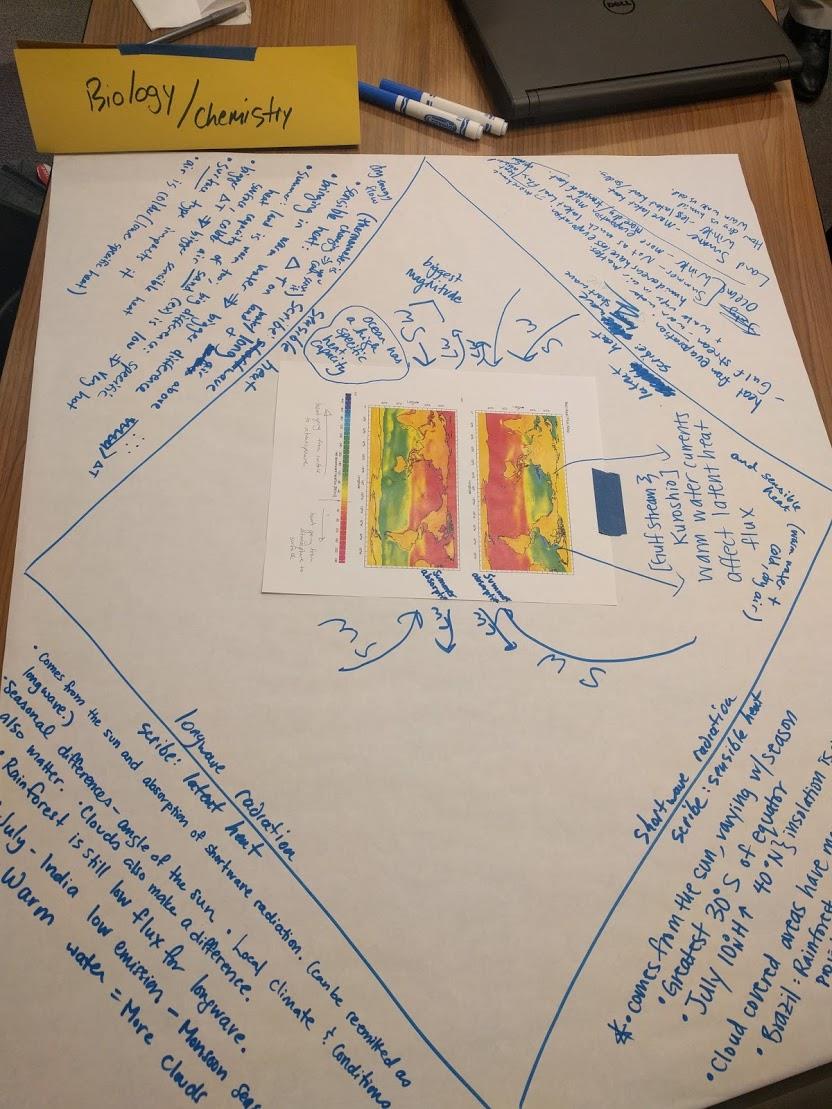
As part of our recent collaboration between the American Museum of Natural History’s Seminars on Science and science teachers at Math for America (MƒA), we explored the use of discussion protocols through various charts covering different segments of the Earth’s Energy Budget (specifically longwave radiation, shortwave radiation, latent heat flow, and sensible heat flow). As we explored each chart individually, then in groups looking at the same map, and finally as a jigsaw using the discussion diamond, we realized the wealth of concepts that could be explored—seasonal differences, evapotranspiration, warm and cool ocean currents, specific heat, the water cycle—in a way that elicits a more global understanding of concepts that simply could not happen with the standard way of thinking about this work. (The two pictures below show this work in our classroom, and the set of materials can be found here.)
Afterward, we examined other resources, especially those from NASA’s Earth Observatory, in which global maps across a myriad of variables can be plotted month to month. (Think a connection exists between precipitation and primary productivity? Throw the two maps on the same screen and see them month to month!) What became apparent is not only the power of thinking of Stability and Change as more than a law of averages, but also how considering this data together, with a group of teachers, is incredibly important for engaging in this work in the classroom.
The idea of dynamic equilibrium is a powerful one in Earth science because it encourages us to explore how change comes not merely from one force, but how that force is positively or negatively reinforced throughout a system. The idea of dynamic equilibrium is important in our classrooms as well! Looking at rich content, such as that found in the Seminars on Science program, with a group of experienced science teachers, such as those in your school or in fellowship programs like MƒA, can be the positive reinforcement system that helps grow your classroom into a model for NGSS.
If you have any thoughts on Stability and Change and how it can be deeply taught in Earth Science, or want to share a similar story of deepening your classroom by working on rich content with other teachers, please share below in the Comments section!
 John Russell taught middle school science in New York City for 10 years, and is a program officer at Math for America, a New York City nonprofit that is building a community of accomplished mathematics and science teachers who make a lasting impact in their schools, their communities, and the profession at large, through collaboration and continued learning.
 Dave Randle taught middle and high school science in New York City for 15 years, and is a senior manager of professional development at the American Museum of Natural History, working closely with the museum’s Seminars on Science online courses.
This article was featured in the June issue of Next Gen Navigator, a monthly e-newsletter from NSTA delivering information, insights, resources, and professional learning opportunities for science educators by science educators on the Next Generation Science Standards and three-dimensional instruction. Click here to sign up to receive the Navigator every month.
Visit NSTA’s NGSS@NSTA Hub for hundreds of vetted classroom resources, professional learning opportunities, publications, ebooks and more; connect with your teacher colleagues on the NGSS listservs (members can sign up here); and join us for discussions around NGSS at an upcoming conference.
The mission of NSTA is to promote excellence and innovation in science teaching and learning for all.
Future NSTA Conferences
2018 STEM Forum & Expo
Dive into Three-Dimensional Instruction Workshop
2018 Area Conferences
2019 National Conference
Follow NSTA
 |
 |
 |
 |
 |
Disclaimer: The views expressed in this blog post are those of the author(s) and do not necessarily reflect the official position of the National Science Teaching Association (NSTA).
Chemistry Climate Change Crosscutting Concepts Curriculum Disciplinary Core Ideas Environmental Science Inquiry Learning Progression Life Science NGSS Science and Engineering Practices STEM Middle School High School