Diversity and Equity
Data Investigations to Further Social Justice Inside and Outside of STEM
Connected Science Learning January–February 2021 (Volume 3, Issue 1)
By Josephine Louie, Jennifer Stiles, Emily Fagan, Soma Roy, and Beth Chance

The underrepresentation of Blacks and Latinxs in STEM fields is an ongoing concern for educators, public policymakers, and people who care about social justice. These fields lose out when they are deprived of the talents, perspectives, and energy of groups underrepresented in STEM. Individuals lose out on social and economic opportunities when they do not or cannot participate in growing job markets and the higher average earnings that STEM fields offer (Funk and Parker 2018). An emerging STEM field that will continue to provide strong workforce opportunities into the future is the realm of data science (Manyika et al. 2011). Advances in technology are making large streams of data available to inform progress and decision making in all sectors of society, increasing demand for people with the skills to analyze and make sense of “Big Data” (Kitchin 2014). Unfortunately, mirroring longstanding trends in STEM, Blacks and Latinxs are entering data science fields at disproportionately low rates (Priceonomics 2017). New strategies and concerted efforts are needed to attract and encourage young people from these groups to learn about and enter these emerging fields.
One potential approach to address this need is to offer well-supported learning experiences where students can investigate social justice issues with authentic, large-scale social science data. For members of groups that continue to struggle for equal access to social and economic opportunities, examining the historic and current conditions of varied groups in society can be particularly meaningful and compelling (Gutstein 2003; Ladson-Billings 1995). The availability of rich and publicly accessible data on topics such as U.S. employment and income, immigration, poverty, public health, and education make such investigations possible. By facilitating such data investigations, educators can help build young people’s statistics and data analysis practices—practices that are fundamental to data science—as well as deeper understandings of their social and economic worlds. Students may become more motivated to learn important data practices when exploring questions of direct relevance to themselves, their families, or their communities (Lesser 2007).
A learning intervention
The Strengthening Data Literacy across the Curriculum (SDLC) project, funded by the National Science Foundation, has been developing and testing sets of hands-on data investigations that explore social justice topics, targeted primarily toward public high school non–Advanced Placement (AP) mathematics and statistics classes with large populations of Black and Latinx students. Led by education researchers and curriculum developers at Education Development Center in Waltham, Massachusetts; statistics educators at the California Polytechnic State University in San Luis Obispo, California; and technology developers at the Concord Consortium in Emeryville, California, the SDLC project has been collaborating with high school mathematics and social studies teachers in both formal high school and summer school settings to develop learning modules that can be flexibly integrated into existing curricula and can promote students’ interests and practices in statistics and large-scale data analysis. The project has developed and tested in a variety of classrooms two prototype learning modules: Investigating Income Inequality in the U.S. and Investigating Immigration to the U.S. (Sample materials for the module Investigating Income Inequality in the U.S. are available here. Sample materials for the module Investigating Immigration to the U.S. can be found here.) Because the project aims to reach students who have lower incomes and may be first- or second-generation immigrants, the modules’ topics and the social justice issues they raise are likely to relate directly to students’ lives both inside and outside of school.
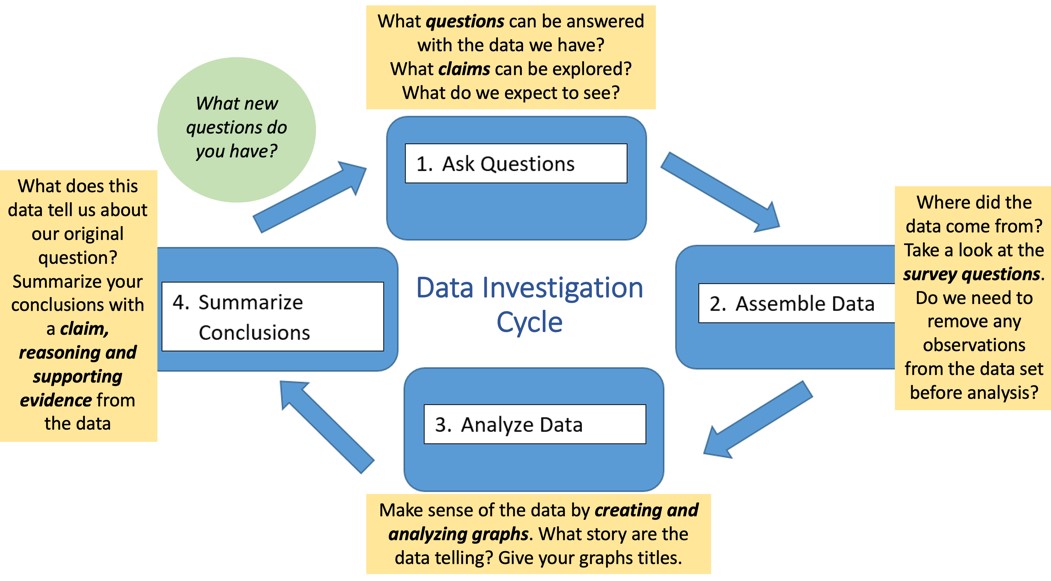
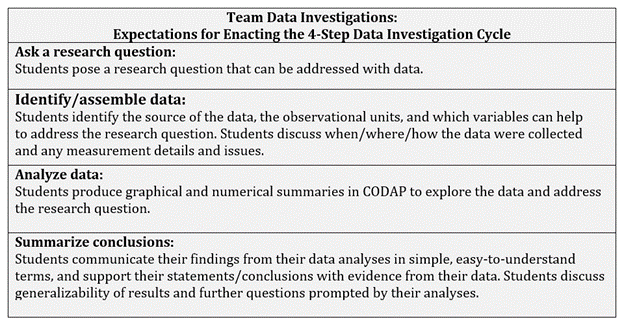
In each module, students examine patterns of income inequality or immigrant socioeconomic outcomes using person-level microdata from the American Community Survey (ACS) and the U.S. decennial census. They are guided by lessons in which they work through the four steps of the data investigation cycle (Ask Questions, Assemble Data, Analyze Data, and Summarize Conclusions; see Figure 1) (Franklin et al. 2005). They complete activities designed to strengthen conceptual understandings of core statistical concepts, such as measures of center and variability within quantitative distributions; the impact of outliers and skewness on these measures; sampling variability and margin of error; conditional proportions and percentages within categorical data; and comparisons of quantitative as well as categorical data. As recommended by the Common Core State Standards for Mathematics and the American Statistical Association (Franklin et al. 2005), these concepts are important to learn in middle school and in high school. Using SDLC modules, students also learn to recognize and explain interaction effects within multivariable data—practices that are critical for working with large-scale data yet are not currently emphasized in pre-college curricula (Engel, Gal, and Ridgway 2016). Students analyze data with the Common Online Data Analysis Platform (CODAP), a free browser-based tool that supports data visualization and conceptual understanding of statistical ideas over calculations. Lessons encourage collaborative inquiry and embed frequent prompts for students to discuss and make sense of data with their peers. All of these approaches follow recommendations for learning and teaching with statistics and data (Franklin et al. 2005; Garfield and Ben-Zvi 2008). This article focuses on discussion and preliminary findings from classroom testing of the SDLC module Investigating Income Inequality in the U.S.
An SDLC Module and Example Data Investigation
One of the SDLC project’s modules, Investigating Income Inequality in the U.S., is composed of seven lessons organized around guiding questions for each lesson, followed by a final Team Data Investigation. The module is designed to take approximately 15 hours (or up to three weeks of one-hour daily instructional class periods) to implement in full. Students begin in Lesson 1 by considering “What is income inequality?” and discuss what they think might be actual and ideal income distributions in society, what “fair” and “unfair” distributions might look like, and the types of questions that can and cannot be answered with data. In Lesson 2, students examine how income data are collected by the ACS and the U.S. decennial census and how incomes from random samples of individuals from these data sources can be cleaned and visualized in tables and graphs using CODAP. In the next three lessons, students work with peers to investigate how much incomes (measured in constant dollars) of lower-, middle-, and higher-income individuals have changed over the past hundred years, and the extent to which the “rich are getting richer and the poor are getting poorer” using dot plots, time plots, and measures of mean and median incomes over time.
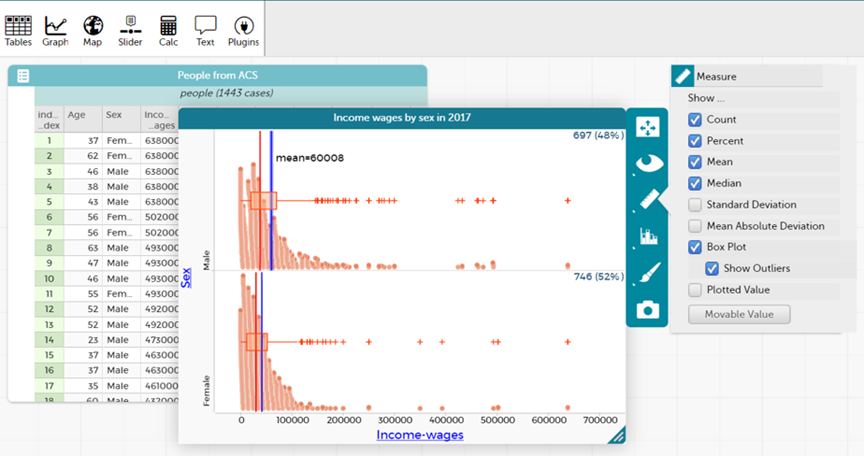
Students then proceed in Lesson 6 to examine the question “How much income inequality exists between males and females?” They begin by making predictions about the average incomes of males and females in the United States, as well as how variability in incomes might differ between the two groups. Using a data set of over 1,400 randomly sampled individuals from the 2017 ACS, students make a graph of male and female incomes and use tools in CODAP to compare mean and median figures as well as the shape and variability of each group’s incomes (Figure 2). They discuss their findings and speculate about the factors that may explain differences in incomes of males and females.
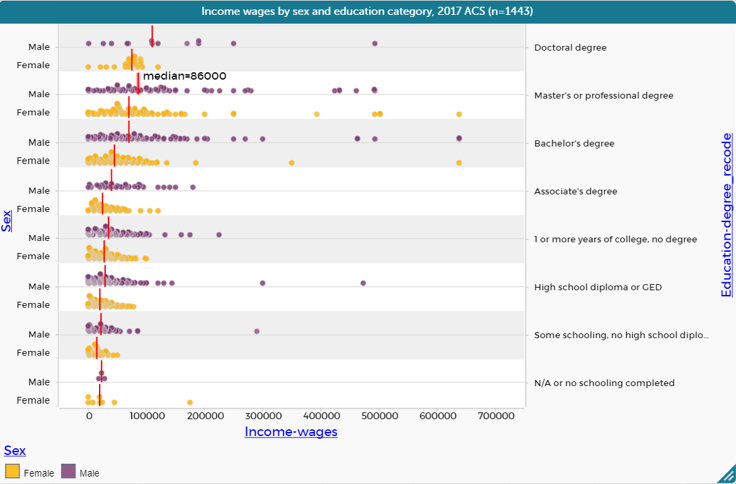
Because at least some students may surmise that different levels of education among males and females may explain the wage gap, students explore in Lesson 7 whether the data support this hypothesis. They predict and then investigate how typical incomes compare among people with different educational attainment levels, and then investigate how male and female incomes compare within different categories of educational attainment, building a graph such as in Figure 3. Their investigation should lead them to the conclusion that the male-female wage gap persists even after controlling for education, and the gap in fact grows with higher levels of educational attainment.
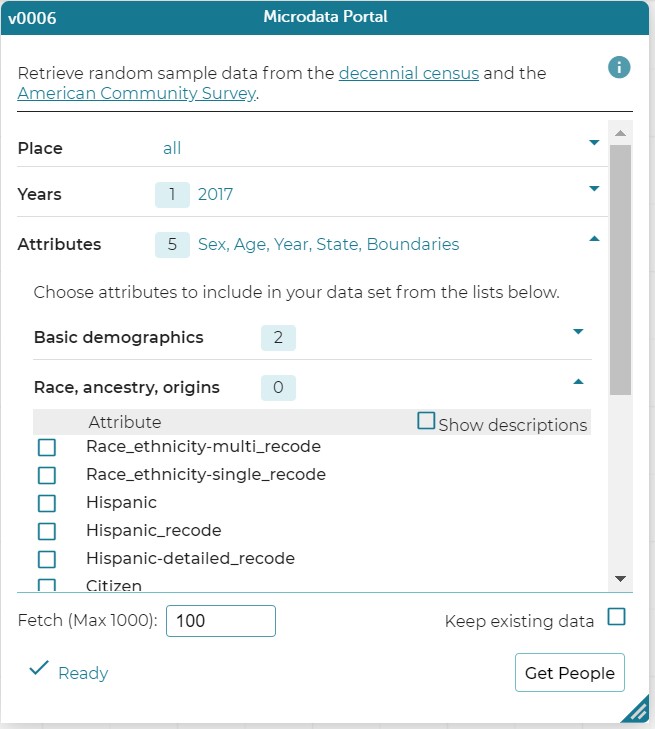
The module ends with a Team Data Investigation, in which students work in small groups to choose another variable that they think might explain the male-female wage gap, identify the research question they will address, and explore the data and present their findings on whether the data support their hypothesis. The developers of CODAP built a student-friendly Microdata Portal that allows students to create their own data extracts of individuals sampled randomly from the ACS and U.S. decennial census data, dating back to the 1860 census. Using the Microdata Portal, students choose variables such as race or ethnicity, age, marital status, occupation, industry, region, and usual hours worked per week to explore in their final investigation (see Figure 4; the Microdata Portal is accessible to the public as one of the plugins in CODAP). Figure 5 displays expectations of students’ final work.
Research and Initial Findings
Over a period of two years, the SDLC project has conducted iterative development and testing of its prototype modules. An early version of the Investigating Income Inequality in the U.S. module was tested by five grade 12 non-AP statistics teachers in seven Massachusetts high school classrooms in spring 2019, as well as in a grade 11 summer school U.S. history class in California that same year. A recent version was tested by 10 Massachusetts mathematics and statistics teachers in 18 high school classrooms in the fall and winter of 2019–2020. Participating schools have had student populations that were 55%–91% Black and Latinx, 15%–25% English learners, and 38%–65% percent economically disadvantaged.
The project team collected a variety of data from students and teachers during module implementation, including from student focus group interviews, teacher post-module debriefing interviews, and student pre- and post-module surveys. Early analyses of these data suggest that the SDLC project’s materials hold promise for promoting interests and skills in statistics and data analysis among target Black and Latinx student populations.
Growth in interest in statistics and data analysis
In the most recent classroom implementation of the income inequality module, 210 students completed a 23-item pre- and post-module survey measuring their interest in their statistics lessons as well as their interests in the broad domains of statistics and data analysis. Adapted from existing instruments, example items include “Our statistics lessons over the past couple of weeks sparked my interest in investigating data” (measuring students’ interests in their statistics lessons) and “Investigating data is one of my favorite activities” (measuring students’ interests in statistics and data analysis more broadly). Based on paired-sample t-tests, students’ interests in their statistics lessons did not change between the start and end of the income inequality module, but their interests in statistics and data analysis more broadly grew significantly between the pre- and post-surveys by 0.25 of a standard deviation (a small effect size).
Interests in investigating real and important social issues
Additional insights into students’ perceptions of the income inequality module come from responses to an open-ended prompt on the post-survey: “Tell us how much you liked the Income Inequality data lessons compared to your other statistics lessons. Please tell us your reasons.” Based on an analysis of responses using a consensus coding process by two project researchers, about 86% of students made a positive comment about the module, whereas 5% provided a neutral or unclear response and 13% provided a negative comment (see Table 1 in Supplemental Resources). Of the students who provided a positive response, 81% used the words “fun,” “liked,” “enjoyed,” “engaging,” or “interesting” in reference to the module. Almost a third of respondents said that they found the topics of income and income inequality interesting, and 32% also said that the issues discussed were real and relatable. For example, one student wrote: “The income inequality data lessons were very fun and informational about the actual world around us, whereas other statistical lessons are about made[-up] situations.” In a focus group interview, a student described a more typical statistics class and how that work felt more artificial:
"What we’re doing right now [in class] or all the time is comparing like GPA to height or different sexes, and it’s so boring. But then just to have the topic of like income wage and comparing it to factors in our daily life I thought that was something we could relate to, so I thought it was more interesting."
Another focus group student voiced appreciation for learning data analysis in the context of studying important social topics that are current and relevant to everyone’s lives. He explained:
"I will say I enjoyed [the module] more just because it was more akin to the real world and it had more to do with stuff that you see on the news or that you hear, you know? Everyone needs to know about income and what you make and what you expect to make and how you need to live off it, so that was very helpful… I thought it was just really interesting compared to the regular put numbers on paper and see what comes out."
Ability to connect classroom learning with their outside lives
Many students found the income inequality module engaging because they could connect and deepen their learning about the social topics with people and experiences outside of school. In a focus group after completing the module, a student explained that the content was helpful for thinking about her own future:
"For me, I think it was very eye-opening because I have family that lives all over the country. So, when we did that project where we got to choose the region and the income from there, I think it was very eye-opening, ’cause I was, like, oh, I'm planning on moving. So, that helps me decide where I'm going to go."
One of the project’s collaborating teachers, Laura (a pseudonym), also described some of the conversations that emerged in class when using the income inequality module. Laura works at an urban public school serving young adults who have not been successful in other schools within the city. She said that students would discuss topics from the module with family members, and in the process, learn more about their families as well as the social issue at hand. She observed: “Students reported having conversations at home about some of the content of the class.” For example, “One student said she talked to her mother about why women earn less than men.” As another example, “One student reflected in class about his own family situation, describing how his mother was a member of a union and how she participated in a recent hotel workers’ strike to protest current wages.” Laura also described how students’ views on the topic of income inequality evolved as they worked through the module and connected the content to news related to the U.S. presidential primaries in fall 2019:
"Students generally started out viewing the issue of income inequality as fixed or inevitable, but the project pushed them a bit to seeing income inequality as fixable. They were very interested in proposals by candidates to forgive student loans. The class ended up having conversations about the importance of voting!"
Better understanding of statistical concepts and the data analysis process
In response to the open-ended item on the survey administered after the income inequality module, multiple students said they developed a better understanding of statistics content, analyzing data with graphs, and the data analysis process. One student commented on the benefits of the visual and interactive nature of analyzing data in CODAP, which allows users to see the links between data in tables and points on graphs and to manipulate graphs to help make sense of the underlying data. She said: “I liked being able to interact more with the graph and making our own. It helped me understand the data more and analyzing graphs more.” The combination of CODAP’s features with frequent opportunities for classroom discussion and peer support was helpful for another student:
"I feel that the income inequality data lessons provided more hands-on learning with the teacher and classmates. Making it very easy for everyone to learn and understand. As well as giving a very good visual representation of the data. I really like learning this way, which is why I've enjoyed this statistics class [more] than my other statistics classes I've taken before."
Analyzing data with a meaningful context also appeared to help deepen students’ understandings of the underlying statistical ideas. In a post-module survey response, one student explained:
"I enjoyed the lessons that discussed current issues such as income inequality between men and women and people with different levels of education. It connected the lesson with the real world and helped me understand both statistics and society in more in-depth ways."
The process of working through the data investigation cycle with authentic data also helped some students feel empowered in working with data. One student wrote: “This was more of an interactive lesson where you are more engaged into the data and you are really doing and analyzing data.” Another student expressed hints of a new identity as a capable data analyst: “I liked the income inequality data more than the statistics lessons we usually do because of the fact that it felt like we were our own statisticians analyzing data.”
An example of a student’s statistical thinking
Although more in-depth analyses of students’ work will be the focus of future articles, this article provides an example of a student’s final data investigation to illustrate the kind of student thinking that is possible when using the income inequality module. In Laura’s class, Solange (a pseudonym) worked on the final investigation individually, with strong support and rounds of feedback from Laura. Solange chose to look more deeply at the relationships among sex, income, and race by posing the research question: “What does the income gap between females and males look like among people of a particular racial background?” In a series of slides, she laid out her thinking for each step of the Data Investigation Cycle. She explained her interest in looking at race by saying: “I chose race because I know that people can be discriminated based on their race and that could be why there is such a large gap,” but then put forth a hypothesis: “I predict that the income wage gap will not change between gender when we account for racial status because I think the gender pay gap solely has to do with gender and not something to do with race.”
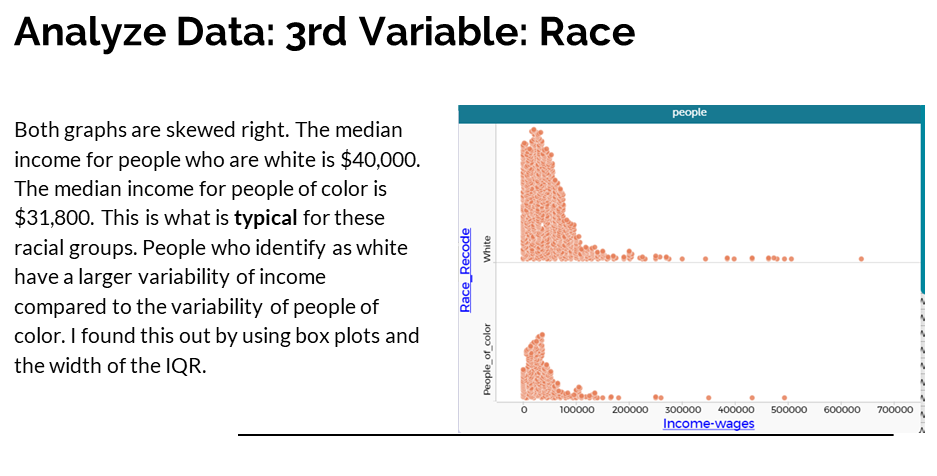
To assemble data for her analysis, Solange explained that she created a data extract of 3,000 randomly selected individuals from the ACS using the Microdata Portal in CODAP, and after setting aside people who were unemployed, continued to work with a data set of slightly over 1,400 employed individuals. Having included the attribute of race and ethnicity in her data set, she then recoded this attribute (which includes multiple categories such as non-Hispanic White, non-Hispanic Black, Hispanic, among others) into a variable with two categories: white and people of color. It is likely that she created this recoded variable to simplify her analysis and to create a contrast that is meaningful to her: “I recoded the data in order to include people who identify as Hispanic into the category of people of color.”
For her analysis, Solange identifies the median incomes and describes the variability in incomes for whites and people of color (Figure 6a). She then examines the gender gap in wages by sex, calculating the ratio of female to male wages for whites and people of color (with a minor arithmetic error in her latter calculation) (Figure 6b). Following a suggestion from Laura, she also examines the gap in median incomes between females of color and white males. Although the arithmetic error in her analysis affects the precision of her conclusion, and although she neither explicitly connects her findings to her original hypothesis nor states questions for further exploration, she is able to argue that the gender gap in wages persists after disaggregating the data by a third variable (Figure 6c).
Areas for further module improvement
As shown in Table 1, a portion of respondents (n=28, or 13%) indicated that there were aspects of the income inequality module that they did not like, or they preferred their other statistics lessons more. Seven respondents said that they found the materials difficult or confusing (e.g., “This lesson wasn’t as interesting or fun, it dragged on a lot and was very time consuming and stressful at times.”). Three students said that working with CODAP was frustrating (e.g., “The site often crashed or ran extremely slow.” “Setting up the graphs to analyze was a long process and at times I found myself losing track.”). For one student, the project-based nature of the data investigations was not to her liking: “I would rather do paper and pencil work (taking notes and doing worksheets).” For another student, the lessons were too structured: “The lessons were easier to follow because the modules had a step-by-step guide. However, I personally enjoy learning a concept and actually applying it on my own rather than being given a set outline.” These responses provide the SDLC project team with useful feedback for refining the materials for future learners.
Conclusions
Implementation and further testing of the SDLC project’s modules are occurring this academic school year, under remote schooling conditions as the pandemic continues to disrupt in-person education. Through this work, the SDLC project is pursuing an ambitious set of goals related to furthering social justice inside and outside of STEM. The project aims to promote equity in STEM by broadening the participation of underrepresented groups in rapidly growing fields that involve data science. To do so, it is exploring a conjecture that focusing data investigations on issues that deal directly with social justice issues can help inspire interest in data analysis fields among high school students from groups that face ongoing barriers to equal treatment and opportunities in society. Although quantitative and qualitative survey results from initial testing suggest that the modules may not appeal to all students, a large proportion of students in the project’s study (many of whom are Black and Latinx) have indicated that they found the modules and the data investigations compelling. Data also suggest that many of these students felt that they developed a better understanding of the statistical concepts covered by the modules and how to analyze data. Although it is beyond the scope of this project to track whether students who have used SDLC modules decide to pursue data science in future study or careers, indications of increased interest in statistics and data analysis are positive steps in this direction.
In addition, the project aims to support social justice outside of STEM. Gutstein (2003) describes teaching for social justice as having three objectives: building awareness of social and political inequities in society; promoting a sense of personal agency and the belief that one can contribute to meaningful social change; and fostering a positive sense of one’s own social or cultural identity—particularly among members of groups that historically have faced social marginalization. By design and based on initial research data, the SDLC modules may contribute to all three of these objectives. Initial findings from classroom testing of both modules suggest that the materials are helping students develop a deeper awareness (rooted in investigations of national data sets) of income inequality and different group outcomes in the United States. Some students suggest that they have gained a better understanding of statistics and greater agency to analyze data. Although the focus of the SDLC modules is on data analysis rather than extensive explorations of the history or backgrounds of specific social or cultural groups, the modules invite students to bring their out-of-school family and community experiences into their data analysis classes—and to share their data analysis findings with people outside of school—in ways that engage learners and deepen the relevance of their work.
Because difficult conversations may arise when investigating social justice issues with data, STEM educators who are interested in teaching with these types of materials may find it helpful to review suggestions from other fields on how to prepare for and facilitate sensitive conversations. During the SDLC project, participating teachers have asked for such suggestions, and the project has compiled resources (see Supplemental Resources) to provide a measure of support.
To guide students who wish to dive deeper into the data available through CODAP’s Microdata Portal, STEM educators may wish to spend time exploring questions using the portal and becoming familiar with the available data themselves. The SDLC project has provided collaborating teachers with at least 24 hours of professional learning sessions to become familiar with ACS data, to learn to use CODAP, and to prepare to use each SDLC module. Additional work in the future may focus more squarely on supporting educators to help students conduct more open data explorations with a social justice focus, and to develop additional modules that address other social justice issues (see Appendix A in Supplemental Resources). Initial project findings suggest that ongoing efforts in this arena hold promise for promoting stronger social justice outcomes both inside and outside of STEM.
Acknowledgment
This study is supported by the National Science Foundation, grant No. 1813956. Any opinions, findings, and conclusions or recommendations expressed in these materials are those of the author(s) and do not necessarily reflect the views of the National Science Foundation.
Josephine Louie (jlouie@edc.org) is a senior research scientist, Jennifer Stiles is a research associate, and Emily Fagan is a senior curriculum design associate, all at the Education Development Center in Waltham, Massachusetts. Soma Roy and Beth Chance are professors of statistics at California Polytechnic State University in San Luis Obispo, California.
citation: Louie, J., J. Stiles, E. Fagan, S. Roy, and B. Chance. Data investigations to further social justice inside and outside of STEM. Connected Science Learning 3 (1). https://www.nsta.org/connected-science-learning-january-february-2021/data-investigations-further-social-justice-inside
Equity Inclusion Multicultural STEM High School