
feature
Ocean Influences Climate
Modeling to understand the interdependence of Earth’s systems
Background Science
The ocean plays a key role in Earth’s climate and is an important driver of our changing climate. It absorbs lots of the Sun’s heat. Without it, Planet Earth would bake! Because water heats and cools more slowly than air, the ocean plays a moderating effect on climates, warming or cooling the air that blows across water and onto land. That’s why coastal areas usually have more moderate climates than those inland. In addition, when water molecules are warmed enough, they transform from liquid to gas and evaporate, providing the engine for the water cycle. Winds carry the resulting rain clouds over land. Almost all rain that falls on land was formed over the ocean (NOAA).
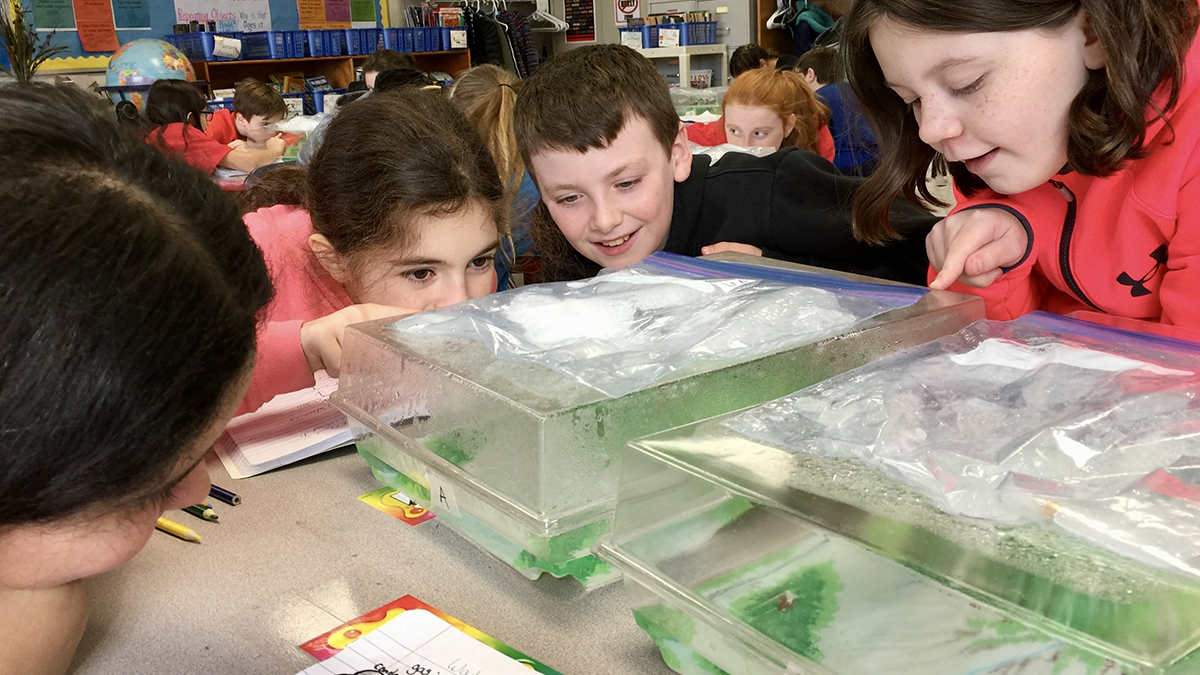
Picture this. Your students have just walked into the classroom. On seven desks around the room sit seven physical models—each a clear plastic box enclosing a miniature coastal town, complete with real water in the “ocean.” Let me amend that. By the time your students arrive, only one model still appears clear to see through the plastic to the inside. The other six have so much condensation on the inside that it’s difficult to see through (see Figures 1A and B). How would your students react? What questions would they ask? How would they go about figuring out why one model is behaving differently from all the others? Could they draw models of the scientific phenomena appearing before their eyes that would explain what’s happening inside these miniature worlds?
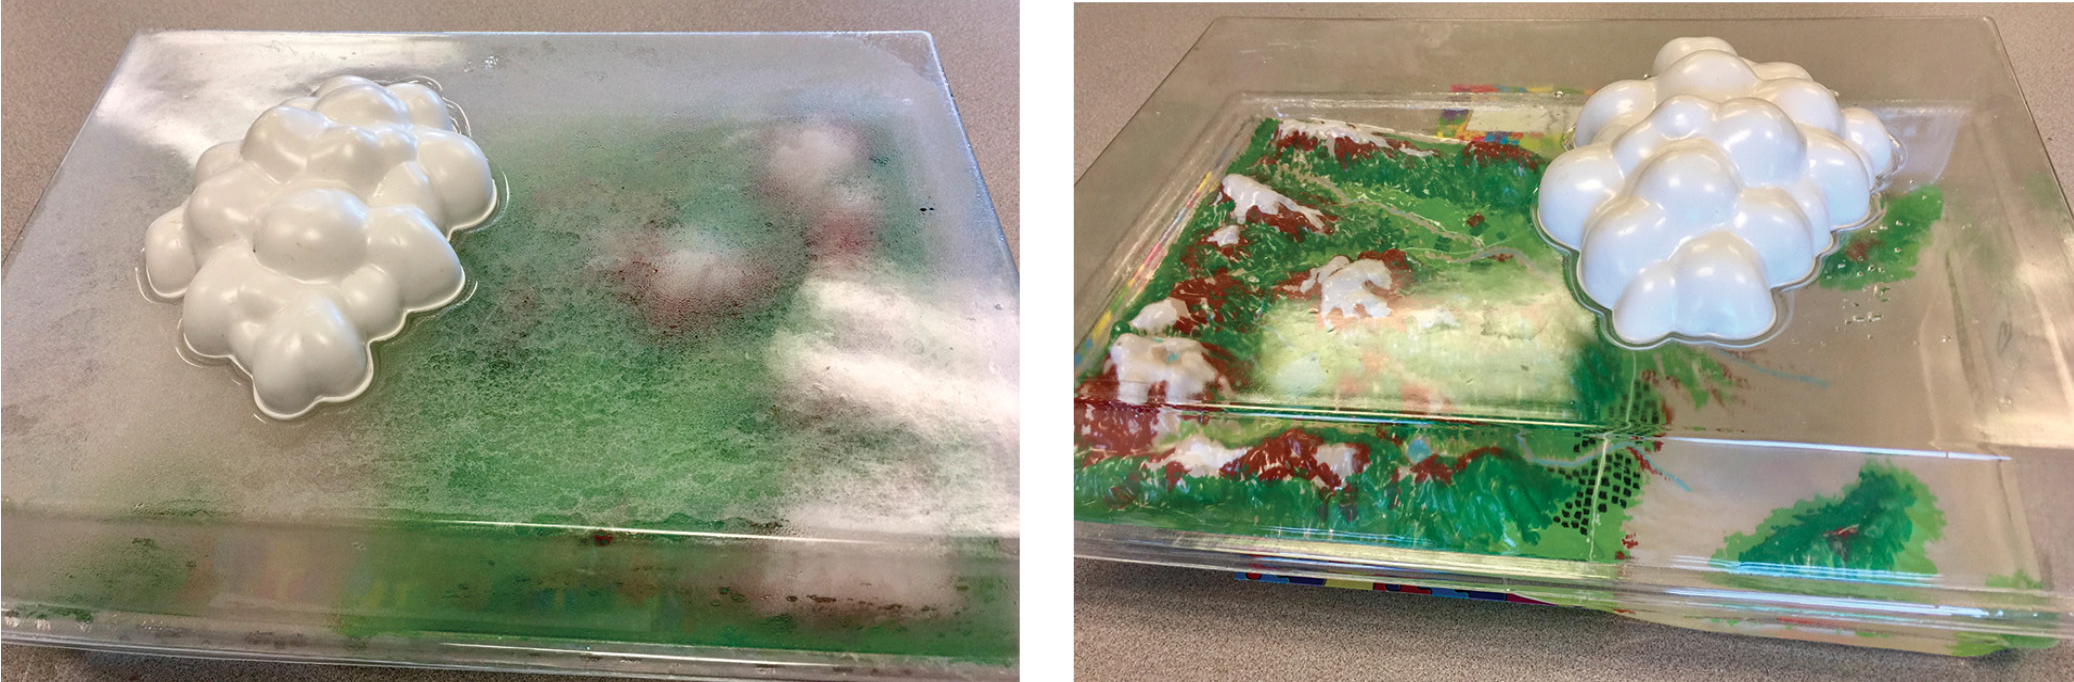
Model setup (Model A, left; Model B, right).
Beyond the fun of seeing the water cycle in action, this is an important lesson to help children understand how Earth’s systems interact. This activity shows them a natural cause-and-effect relationship that is scientifically simple, yet even many adults don’t grasp the worldwide implications: When one system changes, it causes a change in other Earth systems. When the temperature of Earth’s ocean changes, it alters the water cycle in predictable, yet underappreciated ways.
I’ve taught this investigation when addressing the Next Generation Science Standard Earth’s Systems. It demonstrates one way the hydrosphere, atmosphere, and biosphere impact each other. As students discover the ocean influences climate, they use the good science and engineering practice of using models to explore and explain.
Engage
I had six table groups of four students, so I used six models set up to actively condense. One extra model, which is not showing as much condensation, is placed on a table in the back of the room, and is not observed by the students at this point in the lesson. See Supplemental Resources online for directions to prepare the models.
When students first enter the room, have them join you on the rug, away from the models, to set expectations.
Teacher: “Today, you’re going to use physical models to look at a closed system at work. Keep the lids on. Look through the sides and the top. There’s real water inside, so be careful not to bump it. Grab your science notebook and pencil and go to your table group. There you will find Model A. Talk about what’s happening inside the box with the people in your group.”
As you circulate around the room, listening in on conversations, ask probing questions of the groups as to why it’s hard to see inside, why the inside of the plastic box looks wet, how the water got there.
Explore
Guide a whole-class discussion asking students to share their observations. When students note that it looks all wet on the sides and top of the plastic inside, ask them to explain how the water got there. Follow up by having them tap gently on the lid while looking through the sides of the box. Students will find that it’s difficult to see inside due to the condensation on the inside of the plastic, but some children will connect what they’re seeing with the water cycle they’ve learned in previous years. If not, provide the bridge to their previous learning.
Teacher: “Who remembers learning about the water cycle? What is it? How does it work? What does that have to do with what you’re observing in the model?”
Provide support as needed, and emphasize the scientific vocabulary of the water cycle. Evaporation is when water turns from a liquid into gas. It floats upward because it’s lighter than air. As water vapor rises, away from Earth, it gets colder and attaches to bits of dust and debris in the air. This causes it to condense into clouds, turning back into a liquid state. When it becomes heavier than air, it falls back to Earth, pulled by gravity. This is called precipitation, whether its rain, snow, or hail. If it falls onto land and flows downward, it’s called runoff (USGS). Similarly, as the water evaporated from the ocean in the model, it floated upward and bumped into the plastic box, condensing on the plastic.
To move students from observing to understanding, continue to ask probing questions about what gets the water “cycling” in the water cycle. Fifth graders usually remember the water cycle, but haven’t thought about the initial driver of the process. If nobody suggests temperature difference, encourage students to touch the outside of the physical model at ocean level, as well as at “atmosphere level”—the top of the box. When they touch the box at ocean level, the plastic feels warm. Conversely, when they touch the lid, it’s much colder.
Help students realize the cycling begins with the water in the ocean as it evaporates: the warm gaseous water molecules then condense onto the cold plastic, transforming from gas back into liquid, clinging to the plastic until they get so heavy they fall down, or until a student tapping on the lid forces the water droplet to release its hold. If this “precipitation” falls onto land, the runoff flows downhill.
Ask students to use what they’ve seen in their physical model to draw a conceptual model of the water cycle in the real world. Remind them that a conceptual model illustrates the scientific concept in a clear way, in this case showing the water cycle. Solicit ideas for what a good model should include. As students remind everyone that models need labels, graphics, and arrows, note these reminders on the front board for all to see. Remind students that arrows indicate movement and cause and effect. List scientific terms students suggest they will need for their models: evaporation, condensation, precipitation, runoff, and heat source.
Formative Assessment: Ask students to check the model drawings of the others in their group for accuracy and completion. Have students explain each part of the water cycle to each other, pointing out the corresponding section on their conceptual and physical models. Encourage students to revise their model drawings for accuracy and clarity. Circulate, assessing who needs extra guidance.
You may want to enhance the explanatory modeling by asking students to write an explanation for the diagram, in addition to discussing it with their peers. When students relate the observable (in this case, a humid atmosphere) to the unobservable (warm water evaporating) through pictorial representations, discussion, and writing, their brains are actively working to make sense of this scientific phenomenon. Explaining, listening, and revising are all critical to the learning process, and an essential science practice (Teaching Channel).
Moving to the next part of the lesson, invite students to bring their science notebooks and pencils, and gather around the table to observe Model B, the one model that hasn’t been used by the students yet. Place chairs around the table so several students can sit. Other students stand behind them.
Have students talk with the person next to them, comparing what’s happening in Model B with what they saw in their own Model A, and quickly draw a conceptual model of what is happening in this new model. Students notice right away that it appears to be the same setup as Model A: same closed plastic model with water inside. What baffles them is that there is little or no condensation on the inside of the plastic. They can see through it clearly.
As they begin making conjectures and asking questions to solve this incongruence, ask them about their line of reasoning. After a few minutes, redirect them if necessary to focus on the water cycle. Typical student responses include that there’s more or less water in the ocean, that something was put in the ocean (i.e., salt), or that you removed the lid and dried it off. Assure them you put the same amount of water in each, no other ingredients in the ocean, and that you have not dried off the lid. Give students a few minutes to revise their conceptual models.
If a student does not suggest a difference in the temperature of the oceans, give a hint in that direction by asking them how they explored the first model. If necessary, remind them that in addition to observing what was happening in the box, they touched the plastic and discovered there was a difference in temperature between the ocean and the air. Suggest temperature might be playing a role again to explain the different reactions in Model A and Model B.
Then ask a few volunteers to touch the outside of the plastic model at ocean level on Model B and to do the same with Model A. The volunteers will report to the class that the ocean in Model B is cold, but the oceans in the A Models are warm. (Note: It’s important that those who do not have a chance to do a comparison temperature touch now, have the opportunity at the end of this mini-lesson so they will remember how the oceans feel.) The only variable that has changed from Model A to Model B is the temperature of the ocean. Give students another few minutes to revise their conceptual models.
Explain
Ask volunteers to share their conceptual models and to give a scientific explanation for the disparate levels of humidity and condensation in the models. Help students understand that as water warms, evaporation increases. They observed this phenomenon with their own eyes! Remind them that when the gaseous water molecules are cooled on the cold plastic lid, or in the cold upper atmosphere in the real world where they condense on dust particles, they are creating humidity in the air and clouds in the sky. This results in increased precipitation.
Ask students to apply what they’ve learned here to the real world. How would the temperature of the ocean affect the amount of rain we get? Help students make the connection that the warmer the ocean, the more evaporation, the more clouds, the more rain. There’s always some evaporation from surface water, but evaporation increases as water temperature increases. Explain that around the world, there are some areas that tend to get quite a bit of rain because the wind blows clouds formed over the ocean onto the land. As Earth’s climate continues to warm, the ocean is warming as well. And with over 70% of the planet covered by ocean, scientists predict that areas that tend to get lots of rain now will get even more rain in the future. Some areas will get the same amount of rain as usual per year, but more rain will come at a time, creating torrential downpours. (Meanwhile, dry areas will get even drier). The ocean influences the climates of countries around the world (USGS).
Ask students to return to their desks and revise their models to show what the water cycle would look like in a world with a warmer ocean. Note that the amount of water in the ocean remains the same. Students label this conceptual model, “Warmer Ocean Water Cycle”, and the previous model “Cooler Ocean Water Cycle,” (Figure 2).
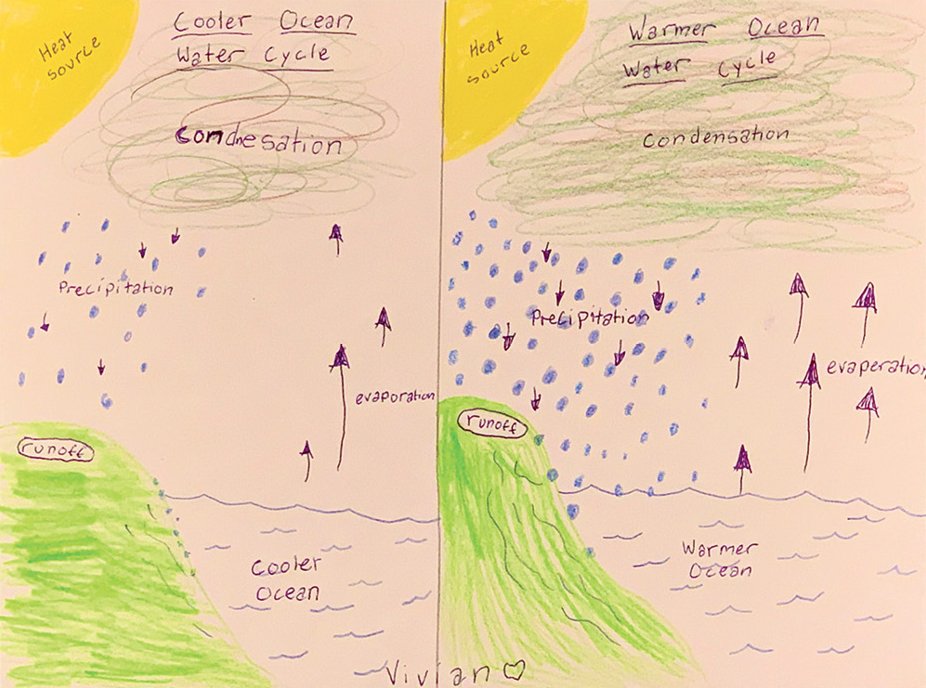
Student conceptual model considering temperature.
Then ask students to use their model to explain their thinking to another student sitting in their group, and to ask if there’s anything that needs to be changed or added. You may also want them to write a description of the phenomenon below their diagram. Everyone should be able to see clearly that there’s increased evaporation, condensation, precipitation, and runoff when compared with their first model. All parts should be labeled, with arrows indicating cause and effect. Allow time for students to revise their models. Then join together for a whole-class discussion.
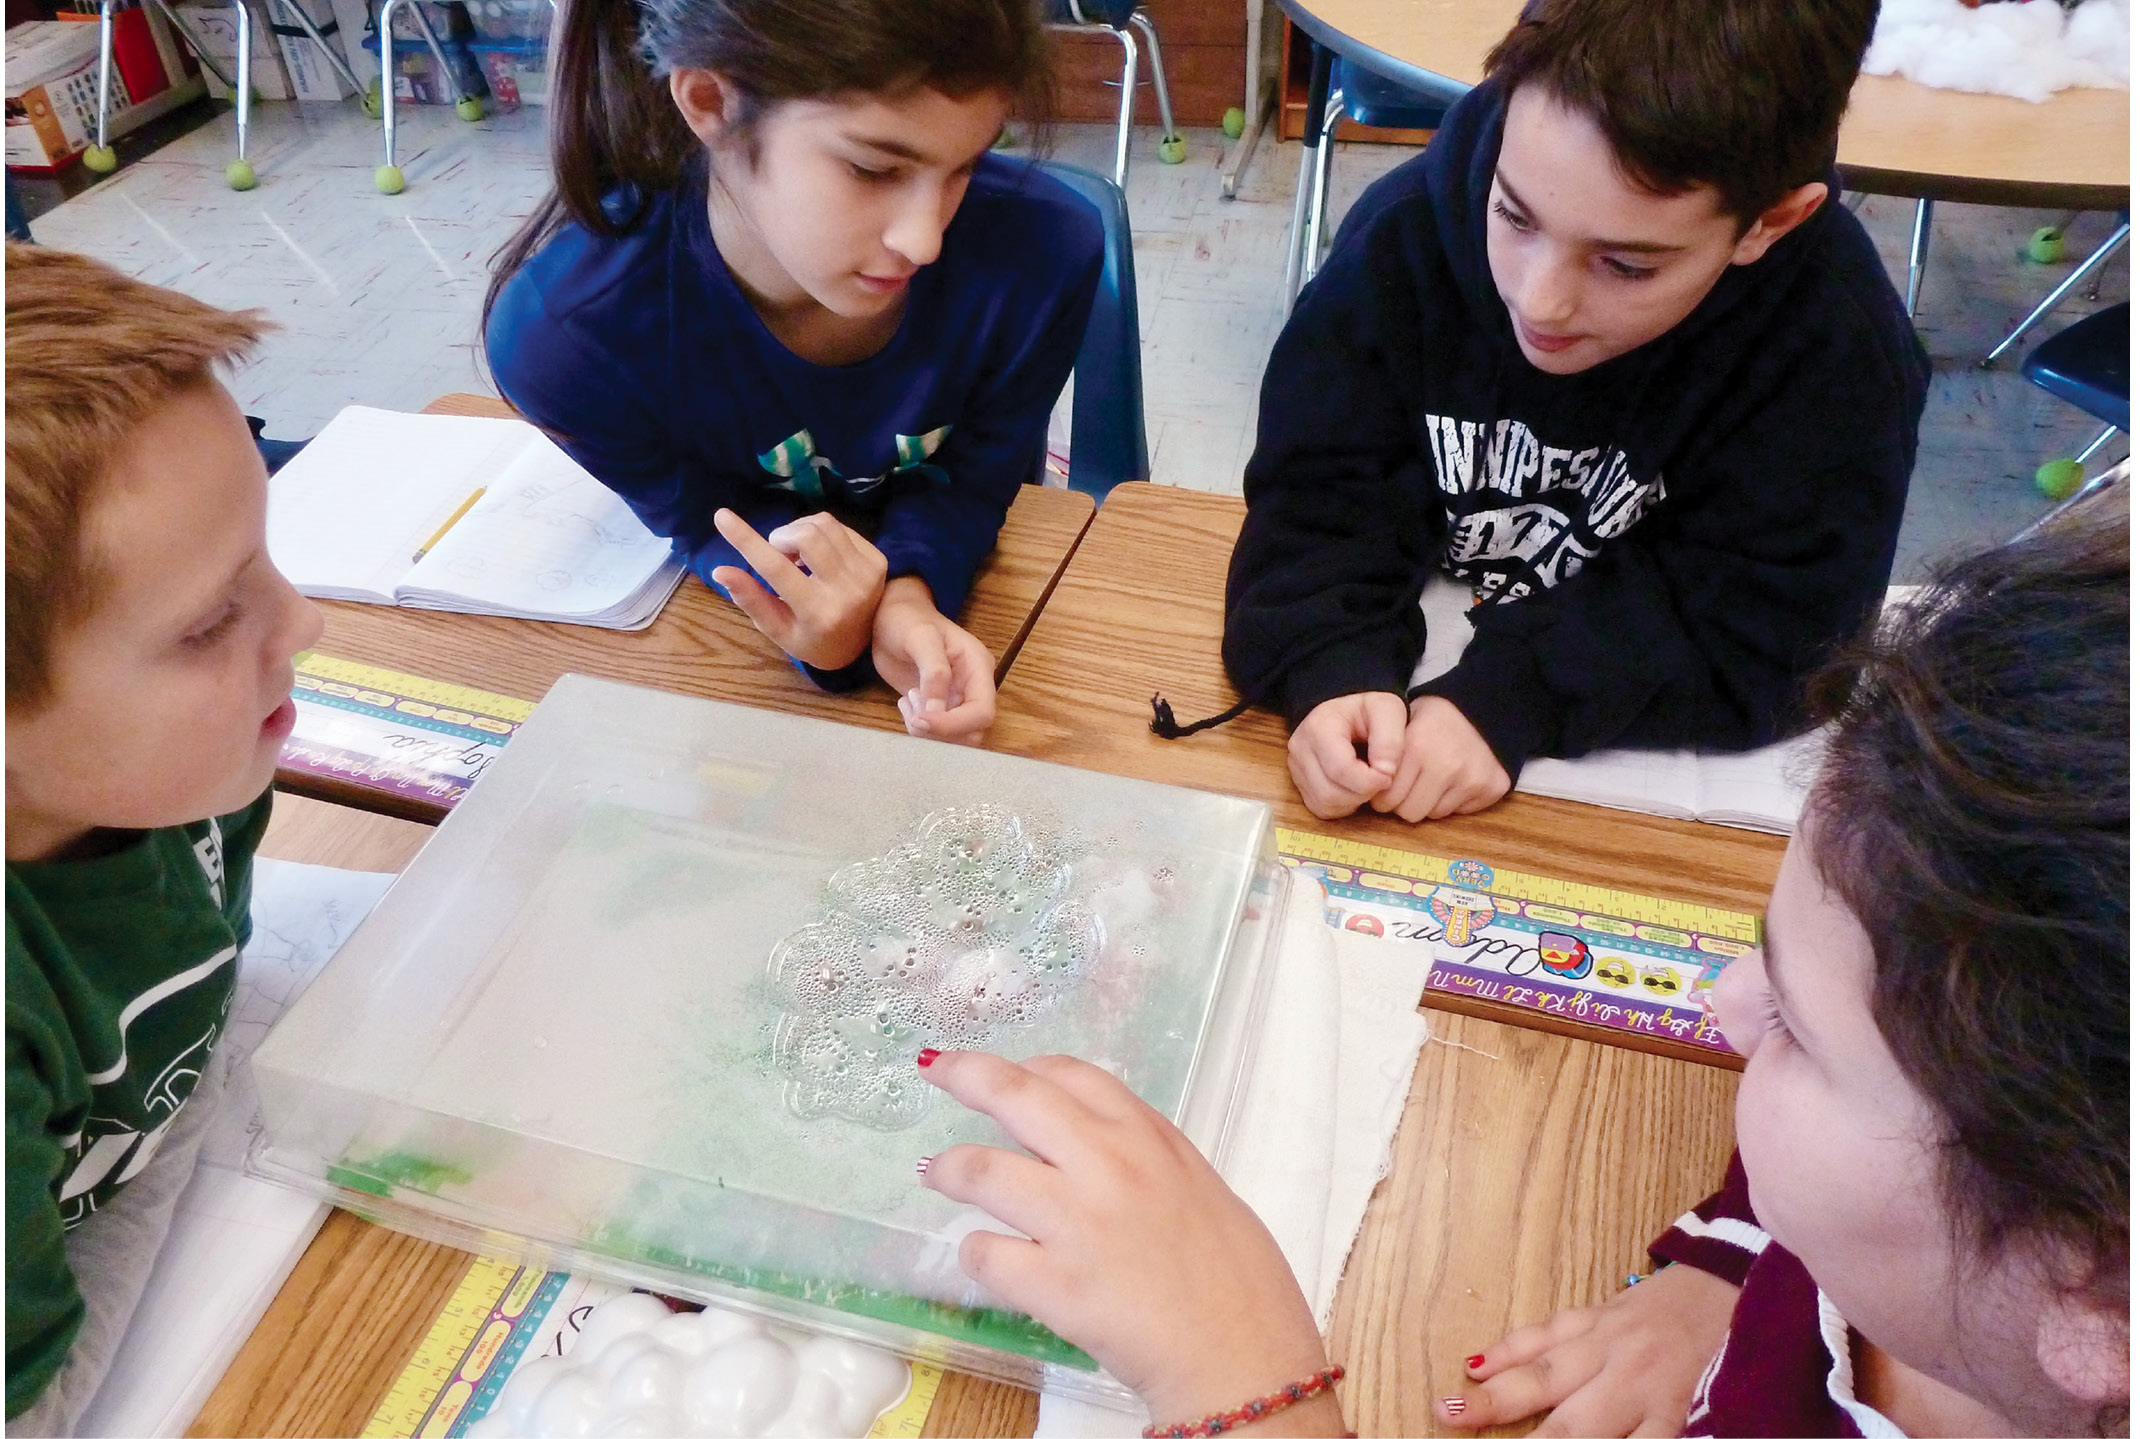
Students examine water cycle models and suggest ideas to explain the condensation.
Teacher: “Who can explain how your drawn models relate to the physical models? How do these models relate to what’s happening in the real world?” Students should understand that using models is a way to take a very big scientific phenomenon in the real world and reduce its size to make it more understandable. Reducing it to model size and drawing each component they’ve seen (as well as the unseen) helps them internalize what’s happening and why it’s happening.
Together, view and discuss NOAA’s video on flash floods, Bite-Sized Science: Improving Flash Flood Warnings. It connects the hypothetical to the real-world issue of flooding, while demonstrating a good use of computer modeling. GlobalChange.gov provides graphs and graphics showing an increase in extreme precipitation events due to an increase in water vapor in the air (see Online Resources). You may also want to show photos of “flooding rains” from Bing Images. If you use video clips from newscasts, preview to make sure the scenes aren’t too upsetting for your students. One good video is “Historic Flooding Devastates Houston Area,” (see Online Resources). These resources will help connect the science to everyday life, helping students understand the implications of the science: Warmer water increases evaporation and therefore precipitation.
Teacher: “What does it matter if rainy areas get even more rain? How might increased rainfall change life for people in those areas?” Help students realize there are a number of effects, from more indoor recess days to more devastating effects such as flooding or crop damage.
Elaborate
So that students appreciate the cause and effect of this scientific phenomenon, it’s important to address the cause of a warming ocean.
Teacher: “We also need to work to slow down these changes to the environment so they don’t become too overwhelming.” Explain that climatologists (scientists who study Earth’s climate) tell us Earth’s land and ocean are warming because of an increase in air pollution that’s trapping the Sun’s heat near Earth. We need to look for ways we can cause less air pollution. Children can talk to adults, and write to government officials and other people in power, expressing their concerns over air pollution and asking them what they’re doing to help decrease the amount of pollution being put in the air. Students can also get ideas about ways to pollute less, and share ideas for taking care of the planet, on the teacher-monitored website Kids Against Climate Change (see Online Resources). These provide great opportunities for multidisciplinary activities and project-based learning.
Evaluate
Have students draw one more model, this time a five-step flow chart, showing the causes and effects of the climate influencing the ocean, which then influences the climate: Increase air pollution > increase warming of land and ocean > increase water evaporation > increase precipitation in some areas > increase flooding, habitat destruction, life interrupted. Students can draw small graphics next to each step (Figure 3). Consider telling students that the first step of the flow chart is “Increase air pollution” and the last step is “Increase flooding, habitat destruction, life interrupted.” Ask them to discuss with their group what they should label the other three steps. Encourage students to share their models with the others in their group, and revise as necessary, as you circulate, assessing which groups need extra guidance. You may also want each student to write a paragraph, in the class or for homework, describing what’s happening in the model. A summative assessment with rubric is also available online (see Supplemental Resources).
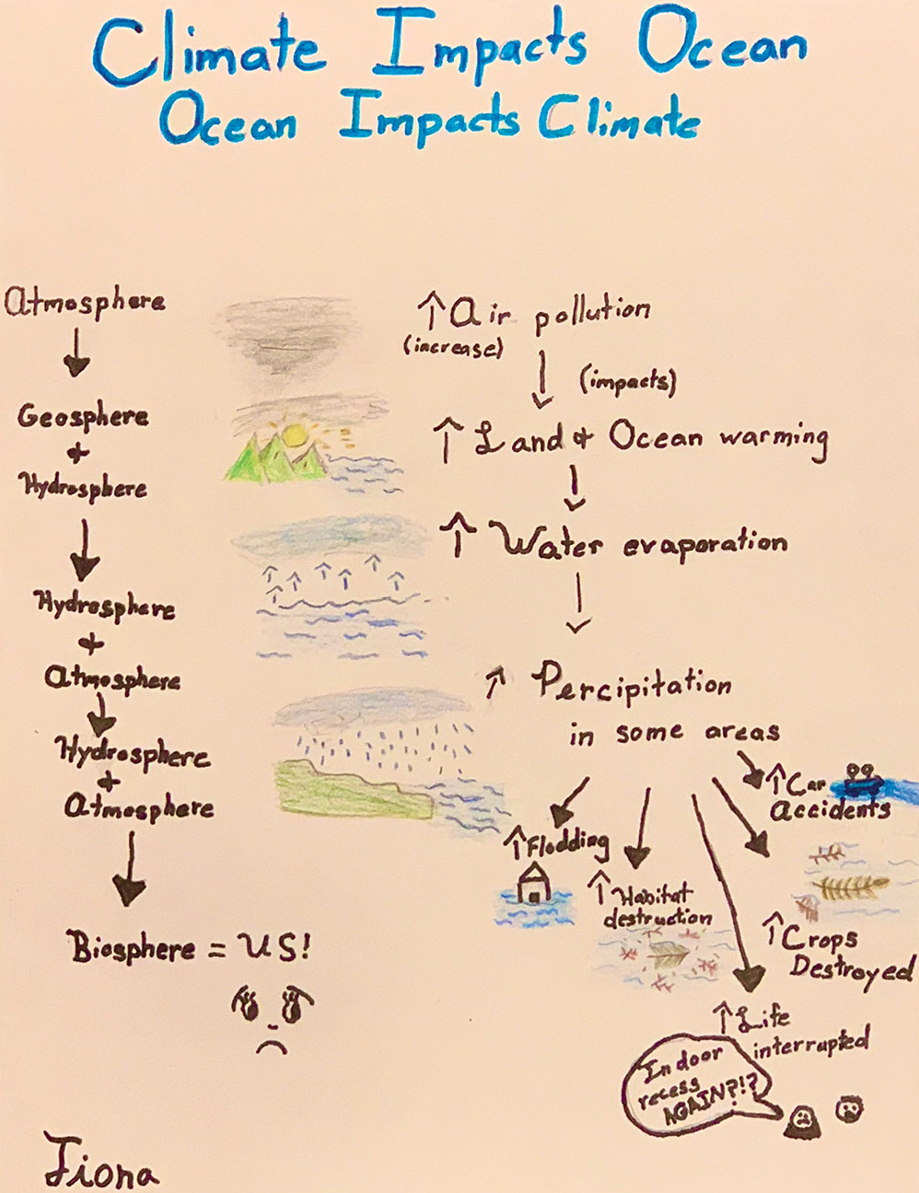
Student conceptual model of climate impacts.
Conclusion
As students learn the science behind natural phenomena, they learn to make sense of the world around them. As they are reminded of their earlier introduction to the water cycle, and deepen their understanding of the consequences of altering one part of the cycle, they begin to internalize the bigger picture: Earth’s systems interact with each other. Altering one system will impact other systems. The biosphere, atmosphere, hydrosphere, and geosphere are interconnected systems that affect each other, so we need to be mindful of human impact on any of them. It will result in affecting them all.
When children have the opportunity to use physical models they can better understand scientific concepts. When they translate what they’re seeing to a conceptual model and discuss what that looks like in the real world, along with how it affects us, they begin to internalize the importance of learning science to understand how the natural world works. ●
Online Resources
“Historic Flooding Devastates Houston Area,” CBS This Morning, 2019 https://www.youtube.com/watch?v=9rZDfCmnmJE
Kids Against Climate Change www.kidsagainstclimatechange.co
NASCO Education https://www.enasco.com/p/Water-Cycle-Model-Only%2BSA09171?searchText=water+cycle
NOAA Planet Stewards https://oceanservice.noaa.gov/education/planet-stewards/
NOAA Video: In FLASH Forecasters Now Have Richer Data to Predict Fast Moving Floods https://www.noaa.gov/multimedia/video/video-in-flash-forecasters-now-have-richer-data-to-predict-fast-moving-floods
Summative Assessment: Ocean Influences Climate https://drive.google.com/file/d/1Cywktwug0_jeDtj97SeLJ0giEccl7qBa/view?usp=sharing
The Water Cycle for Adults and Advanced Students (In Many Languages), USGS https://www.usgs.gov/special-topic/water-science-school/science/water-cycle-adults-and-advanced-students?qt-science_center_objects=0#qt-science_center_objects
The Water Cycle for Schools and Students: Advanced Students, USGS https://water.usgs.gov/edu/watercycle-kids-adv.html
The Water Cycle for Schools, Beginner Ages, USGS, https://water.usgs.gov/edu/watercycle-kids-beg.html
The Water Cycle for Schools, Intermediate Ages, USGS https://water.usgs.gov/edu/watercycle-kids-int.html
“U.S Global Change Research Department, Heavy Downpours Increasing,” GlobalChange.gov, 2014 https://nca2014.globalchange.gov/report/our-changing-climate/heavy-downpours-increasing
Supplemental Resources
Download the instructions for models and summative assessment rubric at https://bit.ly/3JZvnF9.
Kottie Christie-Blick (kchristieblick@sandiego.edu) is an instructor at University of San Diego, San Diego, California, and is a climate change education consultant.
Earth & Space Science Interdisciplinary Phenomena Physical Science Teaching Strategies Three-Dimensional Learning Elementary