
feature
What Is Happening to Our Water?
Students assist a scientist in a local water investigation
Science and Children—March/April 2022 (Volume 59, Issue 4)
By Abigail Recker, Bridget Mulvey, and Joseph Ortiz
Students’ eyes grew wide as they huddled over their desks examining real water samples from Lake Erie. One student exclaimed, “Look at all the white bubbles! I’ve seen those on the shore when I go fishing with Grandpa!” A local scientist asked our third-grade class to help with his research through a two-week problem-based unit. Students investigated the question, “What is happening to the water in Lake Erie?” The class explored and thoughtfully analyzed water samples, maps, images, and literary resources. Finally, they wrote letters sharing their evidence-based conclusions with the scientist. The unit was organized as a 5E learning cycle (Bybee 2014) around locally relevant, authentic, inquiry. This structure supported students’ understanding of science as a creative and inquisitive process (Crawford 2012). Although it was taught at a third-grade level to meet Ohio’s state standards, this unit aligns with the grade 5 Next Generation Science Standards. Although there are many interdisciplinary connections, English language arts standards are emphasized here. The unit was taught for ~45 minutes daily over two weeks.
Engage
On Day 1, a table with water samples, tools, and literature caught students’ eyes. They speculated what they might be doing next: “I wonder if we’re going to get to do real science!” They observed a picture of a man in a suit on the board. “Dr. O does research on Lake Erie, and he asked for our help!” The teachers explained that algal blooms have been occurring in the spring over the last few years. These large patches of algae grow too fast, kill fish, and damage the quality of the water. When these blooms occur, it is no longer safe to swim or fish in the water. This scientist needed our help to figure out what was causing the dangerous amounts of algae. Students quieted down and focused on the important task of assisting a real scientist. The class brainstormed what Dr. O. and they might do to stay safe while doing science. Students formalized these ideas into a set of safety rules and posted them on the front board:
- Use two hands when moving glass containers
- Wear safety goggles, protective gloves, and a lab apron when working with materials
- Use senses of sight and hearing only
- Avoid directly touching water samples
- Wash hands before and after handling any research materials.
The class then concentrated on observation and inference, terms introduced in an earlier literacy unit. Students knew that their senses helped them to make good observations, but they were less clear about inferences. The teachers facilitated a discussion about how inferences involve students using their brains, including their background knowledge and experiences, to figure out what their observations might mean. This understanding supported students’ view of science as a practice.
Explore
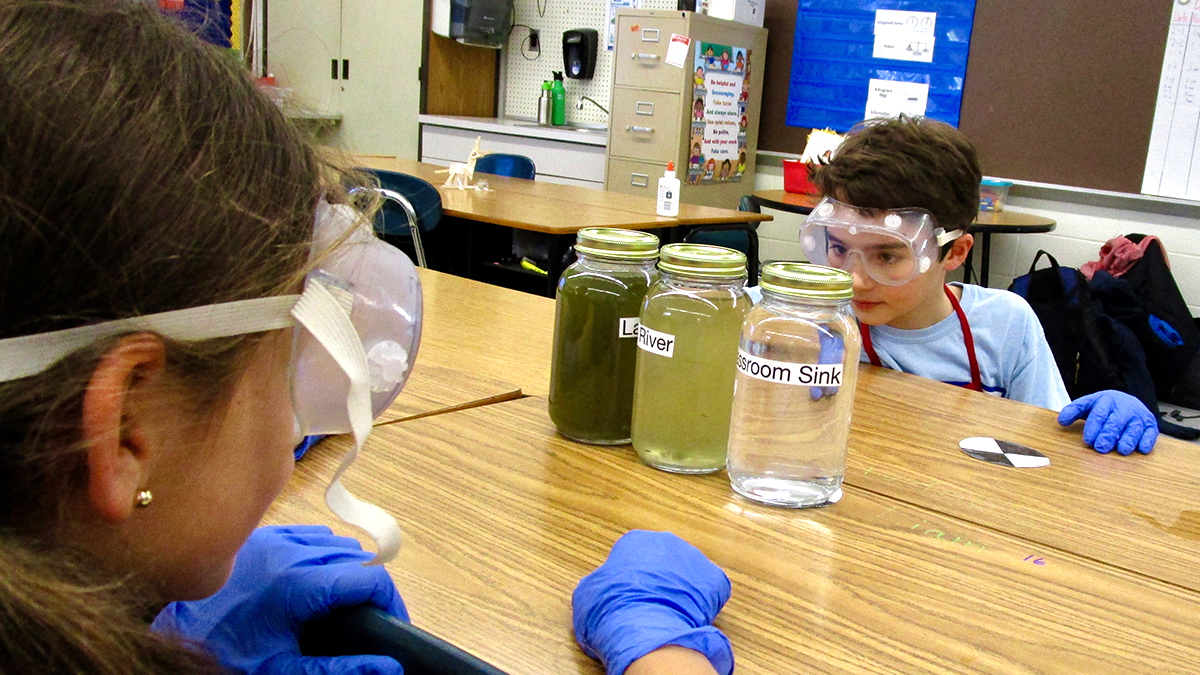
On Day 2 of the unit, the class was organized into research teams of four to five students, who would work together for the duration of the unit. I purposefully constructed teams involving students with moderately different skills so that various strengths and ways of thinking would be represented. This allowed us to differentiate readings and supports as needed throughout the unit. Then, the research teams made initial observations of water samples from Lake Erie, Cuyahoga River, and the classroom tap water. For now, the students explored these samples with jars sealed tight. Some students shook the jars and watched how the contents settled. Others held the jars up to the light to compare them. Gradually students shifted to inferences, recorded on personal white boards. We encouraged team discussions with questions such as: “How fast do the particles settle?” “How does this compare to the other samples?” Then research teams gathered on the rug to talk about their initial findings, while we compiled their ideas on a large graphic organizer (Figure 1).
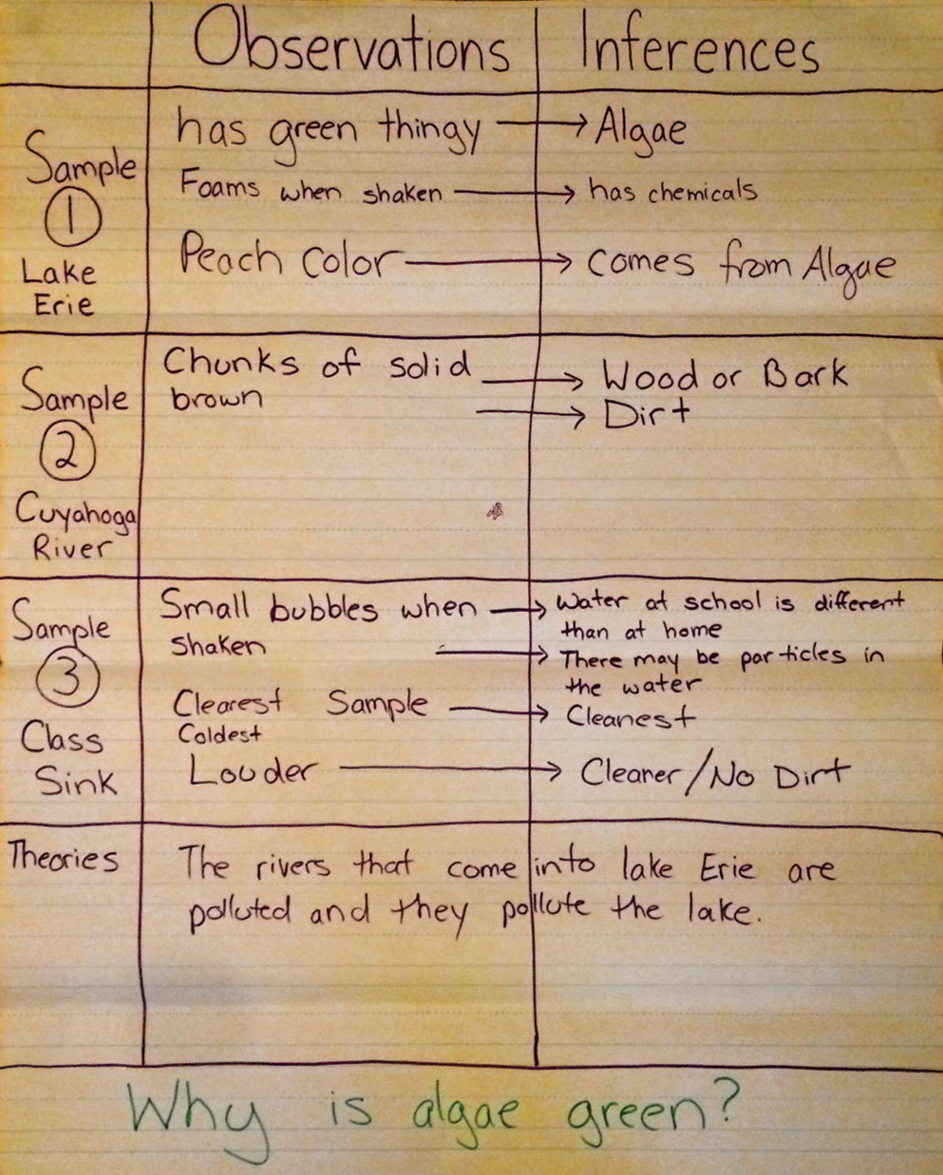
Initial observations and inferences.
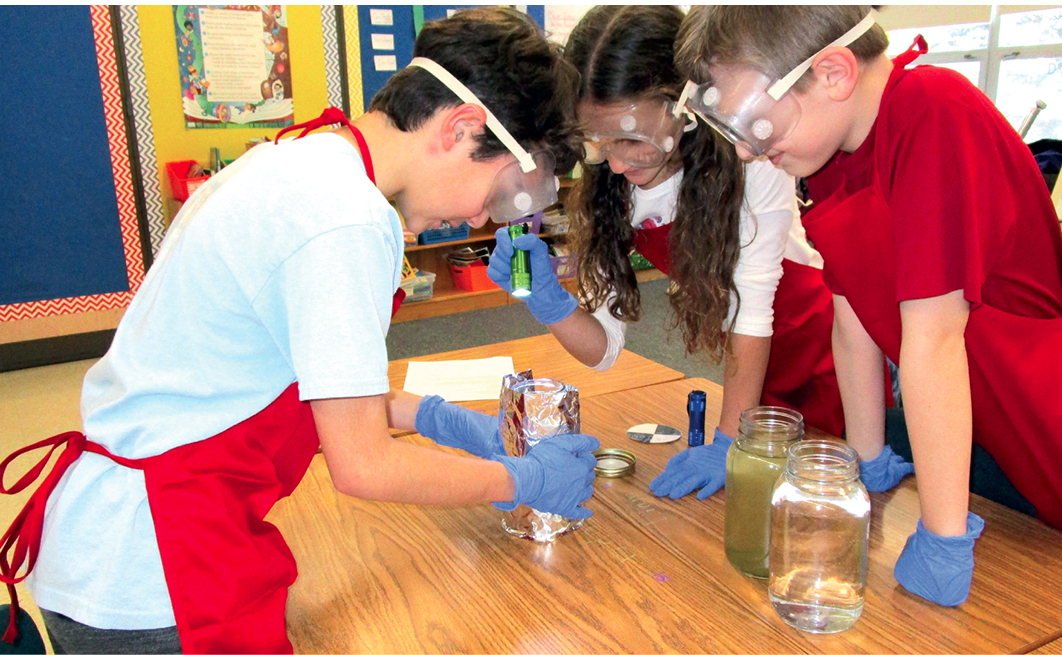
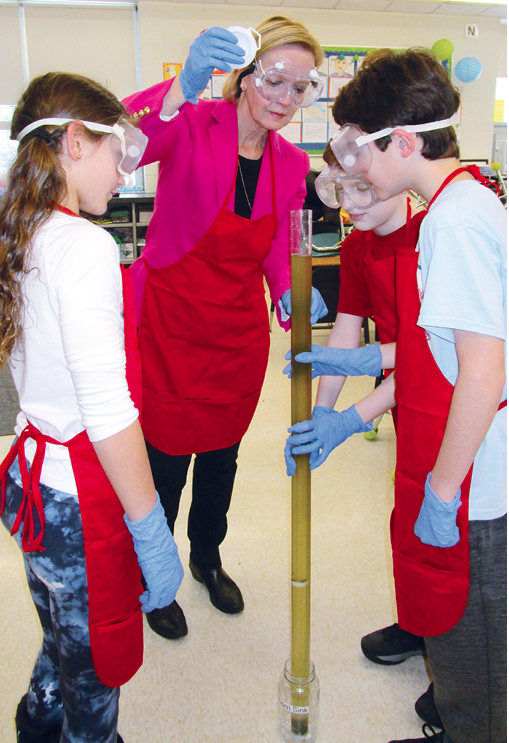
On Day 3, the class discussed how to use Dr. O’s recommended tools to figure out what was happening to Lake Erie’s water: thermometers, flashlights, secchi disks, and secchi tubes (to measure the clarity of shallow water). Although with some classes I would model appropriate tool use, for this inquisitive class, students discovered their own ways to learn by using the tools. One team shined a flashlight at the water, holding a piece of foil behind the jar to help them see the contents. Another team shook the sample and poured it into a secchi tube to learn at what water depth the secchi disk symbol was no longer visible. Evidence gathered by all teams supported the conclusion that the Lake Erie water sample had the lowest clarity.
On Day 4, students examined aerial maps of Lake Erie during an algal bloom, population density maps, water close-ups, and more. Students considered what could be happening in the water based on the new information. The co-teacher and I moved between groups to model how inferences could be formed based on pictures. A student commented, “Maybe where there’s more population, there’s more algae. Because this map looks like the bloom is near Cleveland. Maybe the trash from the all the people helps make the algae grow.” For now, we accepted any inference supported by evidence.
Next, the class gathered on the rug with their notes. Students shared their ideas about what might be in the water, using supporting evidence, and the co-teacher recorded their ideas. Our questions guided student thinking (e.g., “What made you think that?” “If we infer chemicals cause algae to grow, then I wonder where the chemicals are coming from?”). One student commented, “I’m inferring that it is wood or bark.” Another student responded, “Well, I respectfully disagree. I think that the brown might be dirt.” Students also shared inferences about algae growth being related to population density, water flow, and seasons. Overall, students demonstrated an understanding of observation, inference, and how to critique conclusions. This understanding helped us know students were ready to build on their knowledge by looking at the work of other scientists.
Explain
For Day 5, each research team read an article or book about water quality, Lake Erie, or algae in bodies of freshwater (assigned based on students’ previous inferences). I introduced the activity saying, “Now let’s look at other scientists’ ideas about water pollution and water quality. It will be interesting to see if your ideas from yesterday are the same or different than other scientists’ ideas.” My co-teacher and I explained how scientists like Dr. O often use the work of other researchers to support the work they do. As students read their selections, they added important information and vocabulary to a graphic organizer (Figure 2). We helped students clarify vocabulary, find context clues, and articulate ideas. The class focused on the following vocabulary, developing definitions with help from the readings, team discussions, and our scaffolding: phytoplankton, algal bloom, toxins, monitor, contaminated, clarity, and NASA.
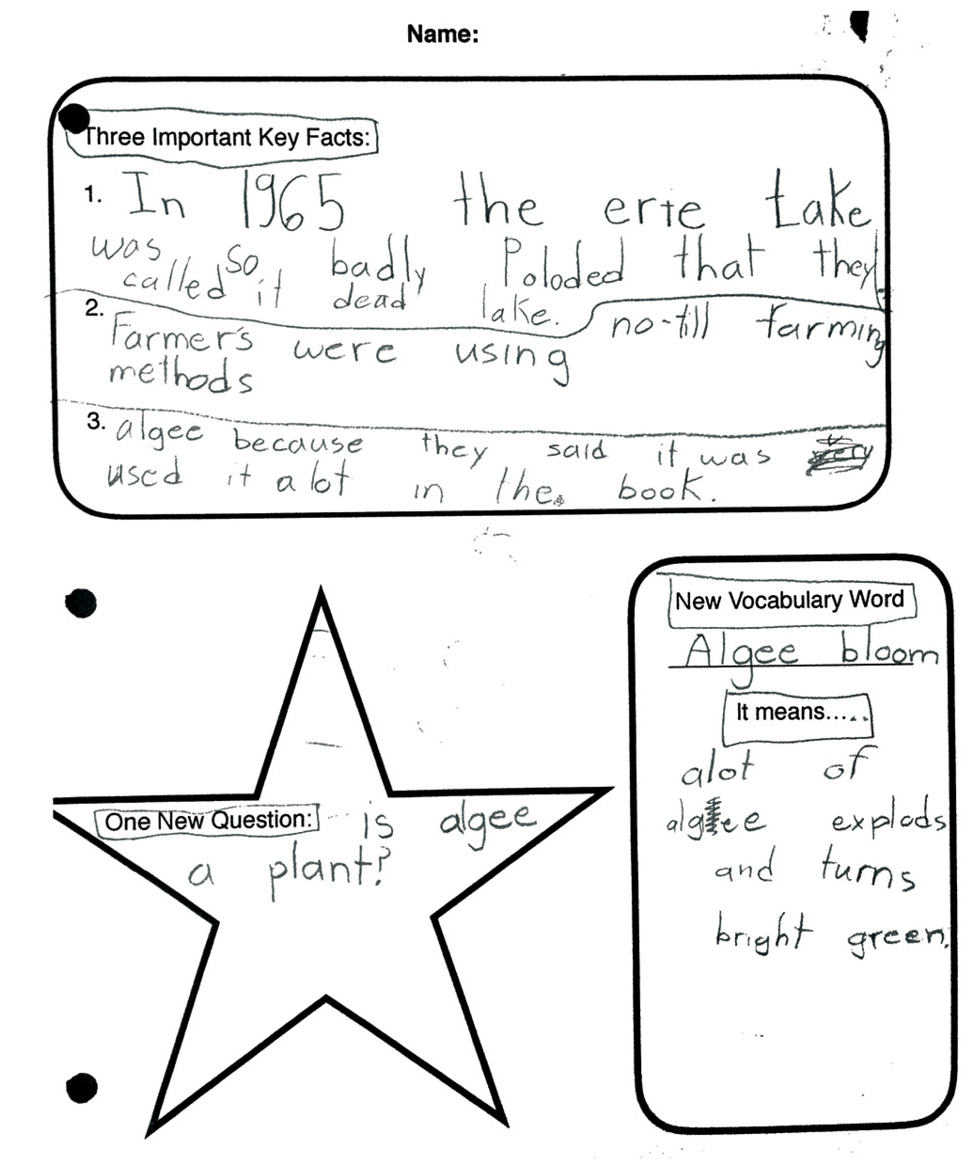
Graphic organizer for findings, new vocabulary, and questions.
Teams shared their graphic organizers with the class, focusing on key ideas, quotes and new vocabulary to support connections across the various readings. One student shared how fertilizer would make the algae grow if it ran into the water from nearby farms. Another quickly responded, “That makes sense ’cause algae is a plant! Ours said that the big blooms usually happen when it’s warm too, just like how plants are green in the summer when it’s warm.” We summarized students’ findings across readings on a larger organizer. This formed one cohesive set of ideas to help students further develop their understanding of the relationship between farming methods, water quality, and algal blooms. Students concluded that humans impact water quality. The class discussed the ways people might be harming the water including farming methods, not taking care of rivers that feed the lake, and littering along shorelines. A few students linked algae growth to trash or dirt in the water, rather than excess nutrients. I supported these students by providing additional articles to read and discuss, followed by an opportunity for students to reexamine their unit work on Day 6 (hand-drawn graphic organizers, photographs, literature, and discussion notes).
Each team selected one human impact on water quality to further investigate on Day 7. Students utilized resources from our teacher-developed website list (see Supplemental Resources). Students also identified and read relevant literature from the classroom’s unit library (see Supplemental Resources). A team investigating the impact of agricultural runoff selected a picture book addressing the history of Lake Erie and the industries along its shoreline. I supported students’ thinking by asking questions such as: “Has someone tried to lessen human impact in this area before?” and “Who/what is impacted by this: fish, humans, plants?” Students documented their findings throughout their research.
Extend
On Day 8, students had some answers to Dr. O’s initial question: “What is happening to the water in Lake Erie?” They knew algal blooms in Lake Erie were caused by excessive nutrients in the water from fertilizer in nearby farms. Nearby rivers transported the fertilizer to the lake. Now they needed to decide what could be done about it. Students developed action plans on large sheets of paper. They used text features such as titles, keys, and text boxes to explain their thinking. One team investigated how rivers feed algae growth in Lake Erie, then designed a water filtration system to be placed at each river’s mouth. “It’s a big filter that lets the water and fish through, but it stops all the fertilizer. And there’s a big tunnel for the bigger fish and turtles that might get stuck. So, then the water in the lake will be cleaner,” one student explained. The co-teacher and I concluded that most students understood a main cause of algal blooms and the changes needed to prevent blooms.
On Day 9, the class held a gallery, where students walked around the room to learn about each other’s ideas. Each team laid out their final action plan. Over 20 minutes, students examined other teams’ work, asked questions, and explained their own rationale to others. Two teams still thought trash in the lake impacted the growth of algae. Students examined the Poisoned Rivers and Lakes text (Lawrence 2014) to challenge this idea. The text supported the idea that trash and algae were both water quality issues, but one did not directly impact the other. This was a challenging concept for many students. The class’s discussion led to the conclusion that, although it is good to pick up trash because it might hurt wildlife, litter does not necessarily help the algae grow. Then the action plans were displayed in the hallway. The research became a topic of conversation between these students, other students in the building, and the students’ families.
A team’s explanations of their action plans indicated that some students were still overly emphasizing macroscopic aspects of the water, whereas a few were starting to think about the microscopic aspects. By exploring the differences between the microscopic (nutrients invisible to the naked eye) and macroscopic contents of the water samples (trash and algal blooms), students’ understandings of water quality could be extended even further. One way could be to have students map the journey of microscopic nutrients and macroscopic trash to Lake Erie. Students might consider the path of the nutrients and trash to the lake, their relationships to algae growth, and how the class’s action plans reflect this. Students often think that the appearance or clarity of water determines its quality/contents, but this is not entirely true. Activities like this can help students to recognize the need to change their ideas about this topic.
Evaluate
The next day, I asked the class who needed to know about their research findings. Students resoundingly answered, “We have to tell Dr. O!” We used letters written to him on Days 9 and 10 (Figure 3) as a summative assessment. Using all of the unit resources, students answered the question, “What is happening to the water in Lake Erie?” The co-teacher and I made the decision to allow students to choose what conclusions and supporting evidence to include, how long their letters needed to be, and what visual supports or graphics might illustrate or support their ideas. By making choices based on their interests and capabilities, students challenged themselves to go well beyond what their previous work had reflected. The locally relevant and authentic, real- world audience helped students make higher-level connections and improve their writing length and quality compared to an earlier literacy unit. Dr. O answered students’ questions and thanked them for their hard work. This feedback helped students understand how important their findings were and cemented their view of themselves as real scientists, too.
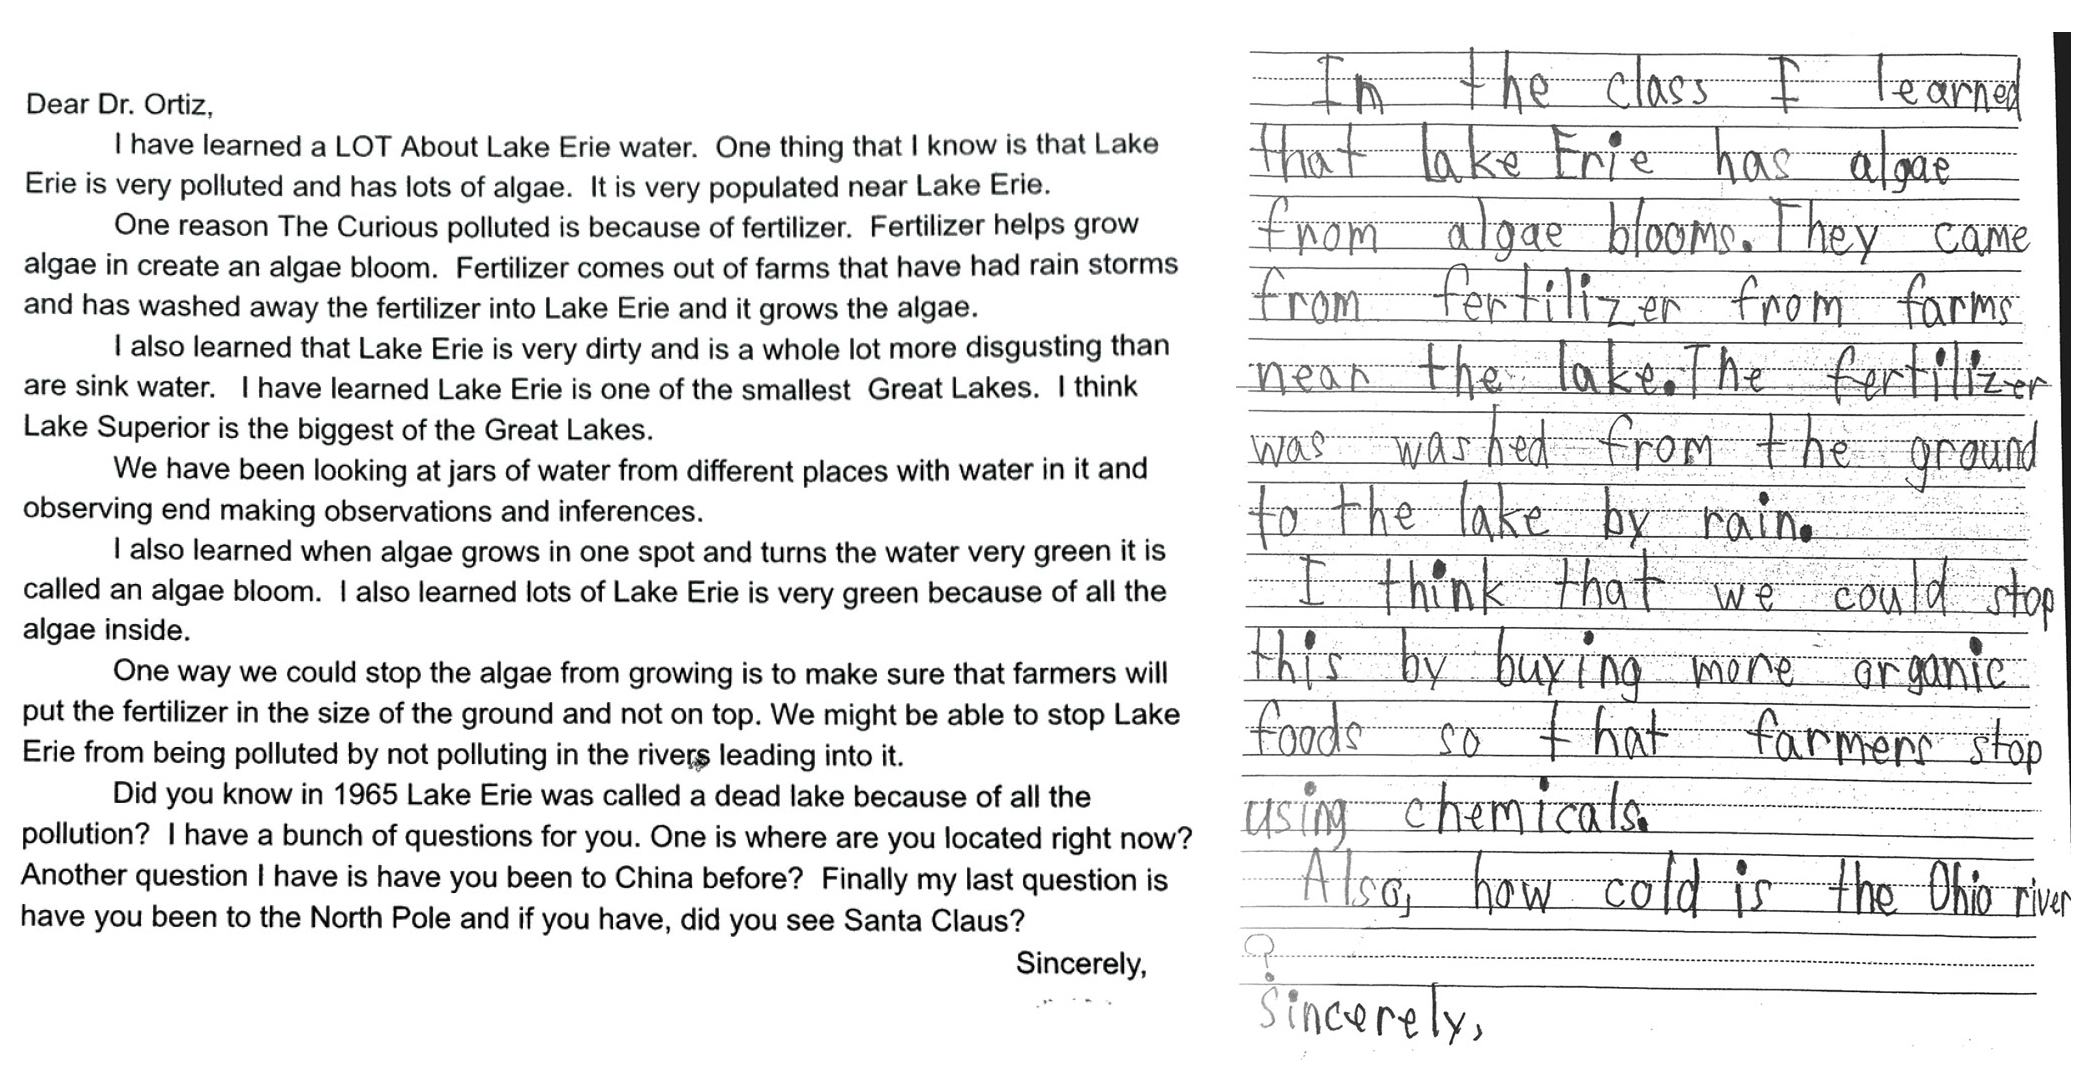
Summative assessment: Letters to a scientist.
An observational checklist was also used as a formative assessment to inform instructional decisions and summarize student skills and learning (see Supplemental Resources). I carried this checklist with me throughout the unit to record what I observed related to student learning. Observations of student actions, dialogue, and work samples (graphic organizer, notes, action plans, letter), as well as team projects, informed my decisions about students’ ability levels.
Of the 25 students, 84% met all four unit objectives, independently or with support. I documented growth related to scientific tool use and ability to form observations and inferences. In previous units, students struggled with cause-and-effect relationships within interconnected Earth systems. Surprisingly, in this unit 92% of the class demonstrated a foundational understanding of the relationships between human activity and algal blooms, justifying ways students could improve water quality themselves. Students knew their connections supported Dr. O’s work; they were doing science.
Conclusion
Throughout the country, there are many bodies of fresh water affected by algal blooms. By focusing on a water source near your school, your students can become scientists, too! Situating science content in real and meaningful learning experiences encourages students to be invested in their own learning, construct deeper understandings, and apply those understandings to make the world a better place. By taking on the role of research assistants, these elementary students transformed into scientists. ●
A special thank you to Kathy Matchinga and McDowell Elementary, of Hudson, Ohio, for helping to make this learning experience possible.
Supplemental Resources
Download the assessment checklist and additional resources at https://bit.ly/3sk9wCs.
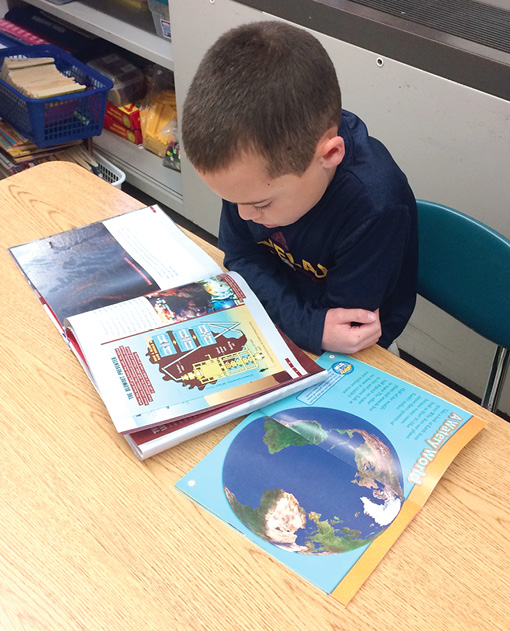
Students conducted research in the classroom library.
Abigail Recker (abbey.recker@indian-island.mie.k12.me.us) is an elementary teacher at Indian Island School for the Penobscot Nation in Maine. Bridget Mulvey is an associate professor of science education, and Joseph Ortiz is a professor of geology, both at Kent State University in Kent, Ohio.
Citizen Science Earth & Space Science Interdisciplinary Labs Life Science Phenomena Teaching Strategies Elementary