
feature
Teaching Nature of Science Concepts in the Context of Past (Fram) and Present (MOSAiC) Arctic Expeditions
Science Scope—March/April 2021 (Volume 44, Issue 4)
By Jonathan Griffith, Shelly Grandell, Lynne Harden, and Anne Gold
CONTENT AREA General science
GRADE LEVEL 6–12
BIG IDEA/UNIT The process/nature of science is one of adventure, unexpected challenges, and new questions that add to or refine a body of knowledge.
ESSENTIAL PRE-EXISTING KNOWLEDGE Basic graphing skills
TIME REQUIRED 9 class periods; flexible formatting
COST Free. Option to use VR headsets (~$15/headset)
SAFETY Students should stay seated or stand in place if using VR headsets.
Creativity, serendipity, and personal experience are all important components of the nature of science (NOS) and should be more explicitly integrated into students’ scientific learning (Hoffman and Torrence 1993; Weinburgh 2010). Understandably, it’s difficult to teach about the true nature of science in the classroom without authentic examples. Bringing scientific expeditions into the classroom is a way to highlight the exciting and often unpredictable way in which science is conducted and can help make science more accessible to students (Garay et al. 2015). Although nature of science is a significant component of the Next Generation Science Standards (NGSS), as outlined in Appendix H (NGSS Lead States 2013; see also Online Resources), few resources make explicit connections to these understandings. The MOSAiC (Multidisciplinary drifting Observatory for the Study of Arctic Climate) expedition, one of the most extensive international Arctic research expeditions ever conducted, represents one such opportunity to connect students to the true nature of science.
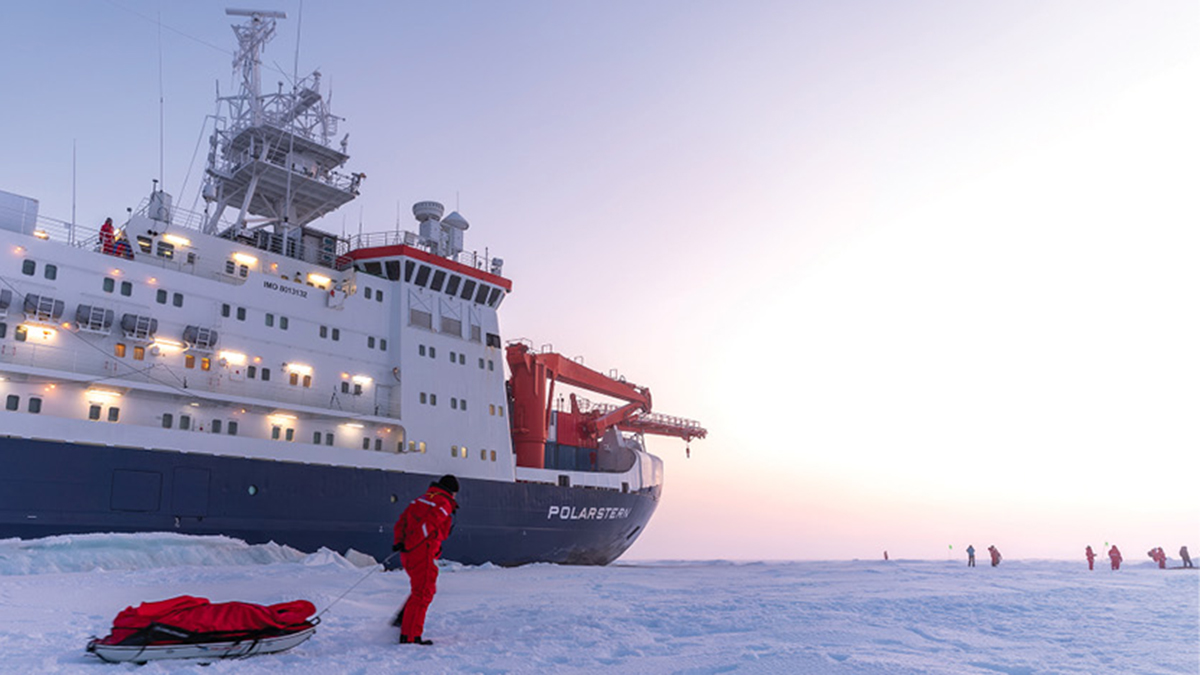
Inspired by the 1893 Fram expedition (see Figure 1), the 2019–2020 MOSAiC expedition (see MOSAiC expedition in Online Resources) aimed to increase scientific understanding of the changing Arctic climate system. The icebreaker Polarstern was frozen in the Arctic sea ice and drifted with the transpolar current across the Arctic Ocean for an entire year while scientists studied ocean, atmosphere, and sea ice processes. Hundreds of scientists from all around the world participated in this year-long expedition, braving subzero temperatures, months of polar darkness, extreme isolation, and countless other challenges to gather important climate data sets that would allow climate scientists to answer critical questions about the global climate system. This article describes a two-week NOS unit in which students compare and contrast Arctic expeditions of the past (Fram) and present (MOSAiC) to prepare for the Arctic of the future.
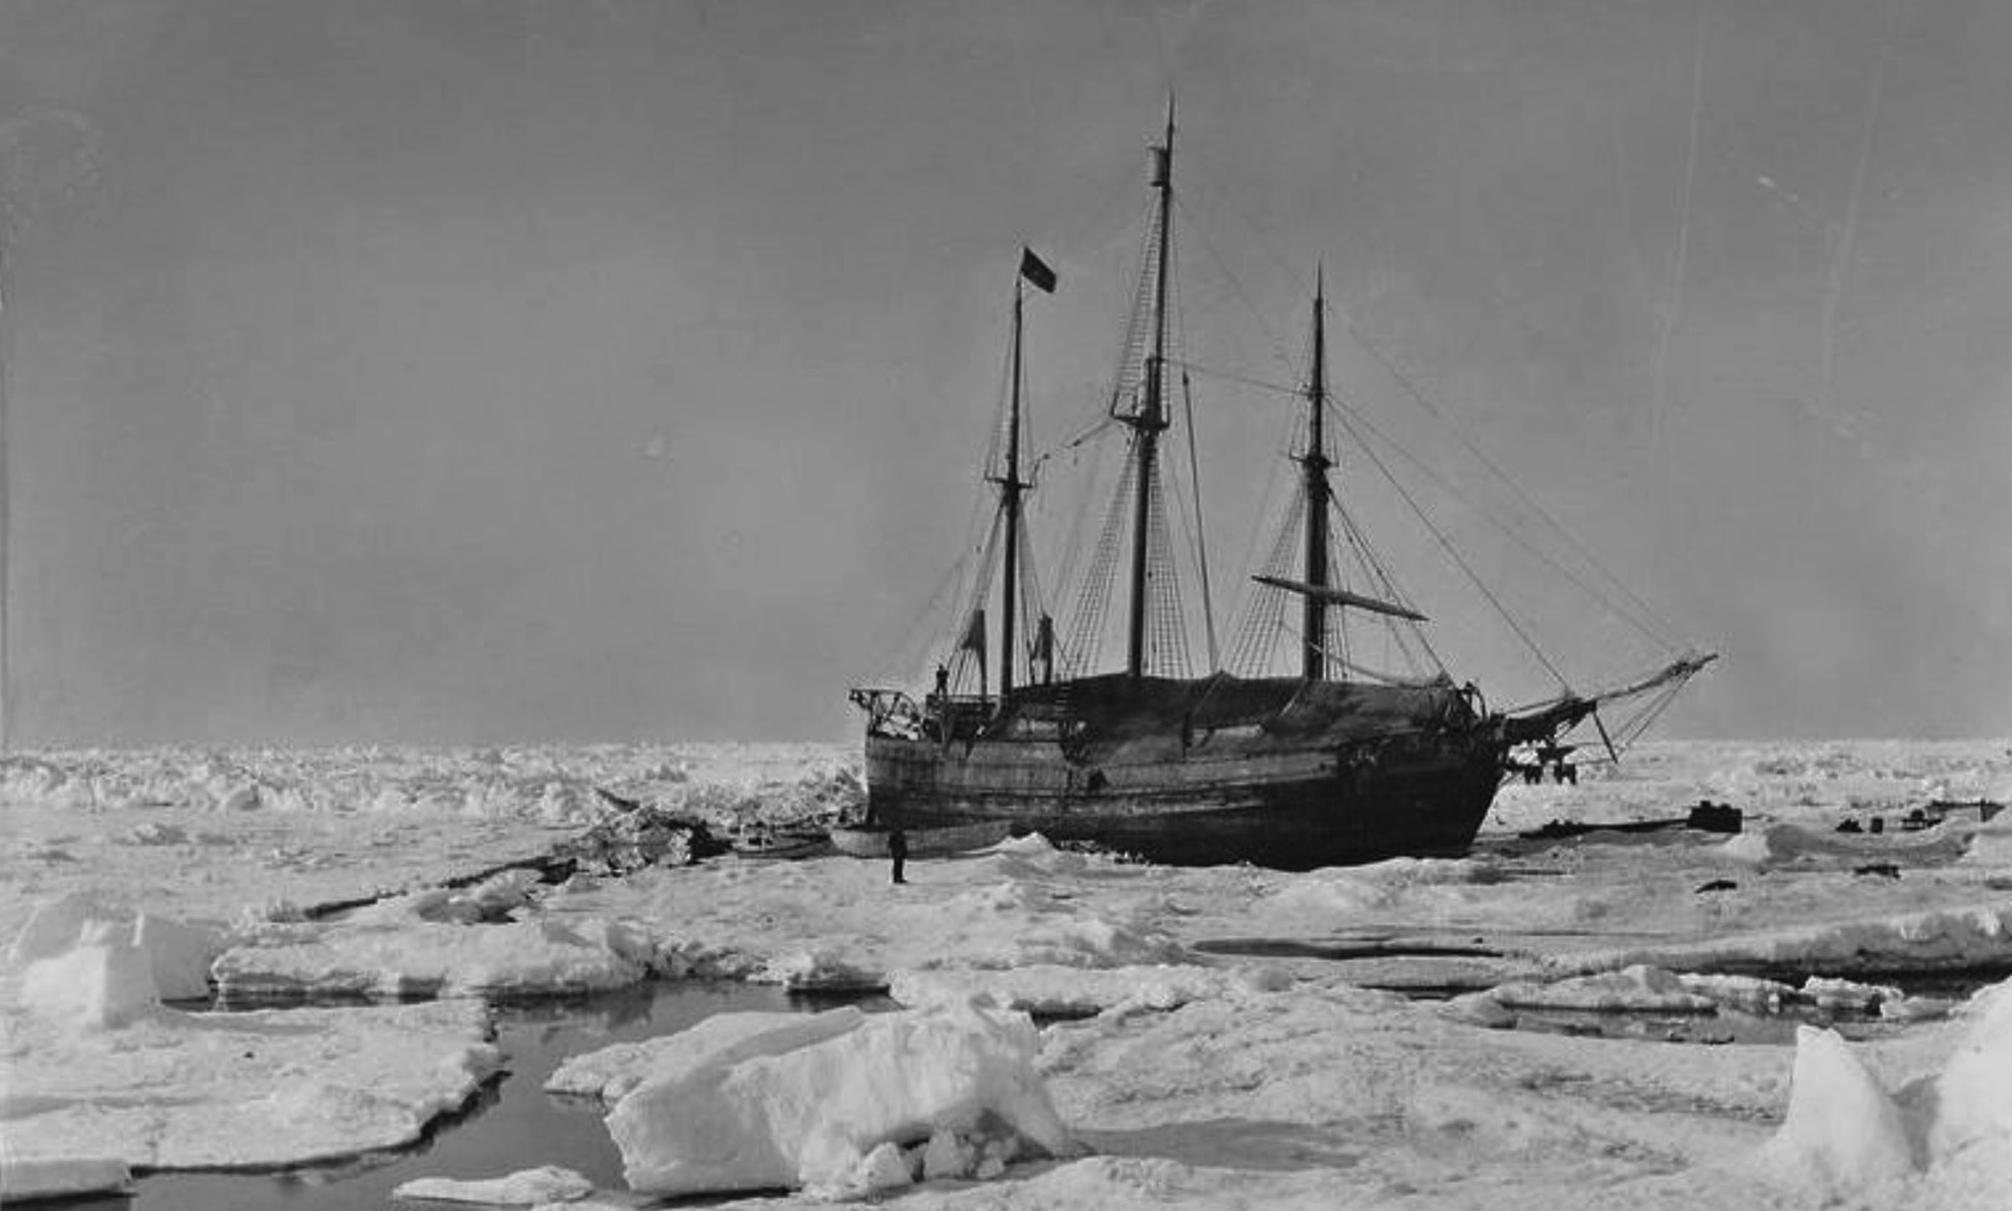
The 1893-1896 Fram Expedition was the first attempt to reach the North Pole by freezing a ship (the Fram) in Arctic sea ice and drifting with ocean currents. Image from the National Library of Norway.
About the curriculum
The curriculum, Exploring the New and Old Arctic, is centered around the driving question: “How have scientific questions, methods, technologies, and our knowledge of the Arctic changed over time?” It consists of five unique lessons, each tied to the NGSS NOS understandings. At the end of each lesson, students express their learning by completing an exit ticket. They also update a whole-class summary table to keep track of similarities and differences as they relate to the motivation, navigation and technologies, and investigations of the historic Fram and modern MOSAiC expeditions. Students reference their exit tickets and the summary table when completing the final assessment, a visual representation comparing and contrasting the Fram and MOSAiC expeditions (see Figure 2). The unit is designed to be interdisciplinary and flexible so that teachers may choose to implement the unit in its entirety or in parts, focusing on topics (e.g., questions, methods, technologies) that are applicable to their curriculum or of most interest to students. Here we describe each lesson to help the reader understand the full arc of the unit (see the unit summary in Supplemental Materials).
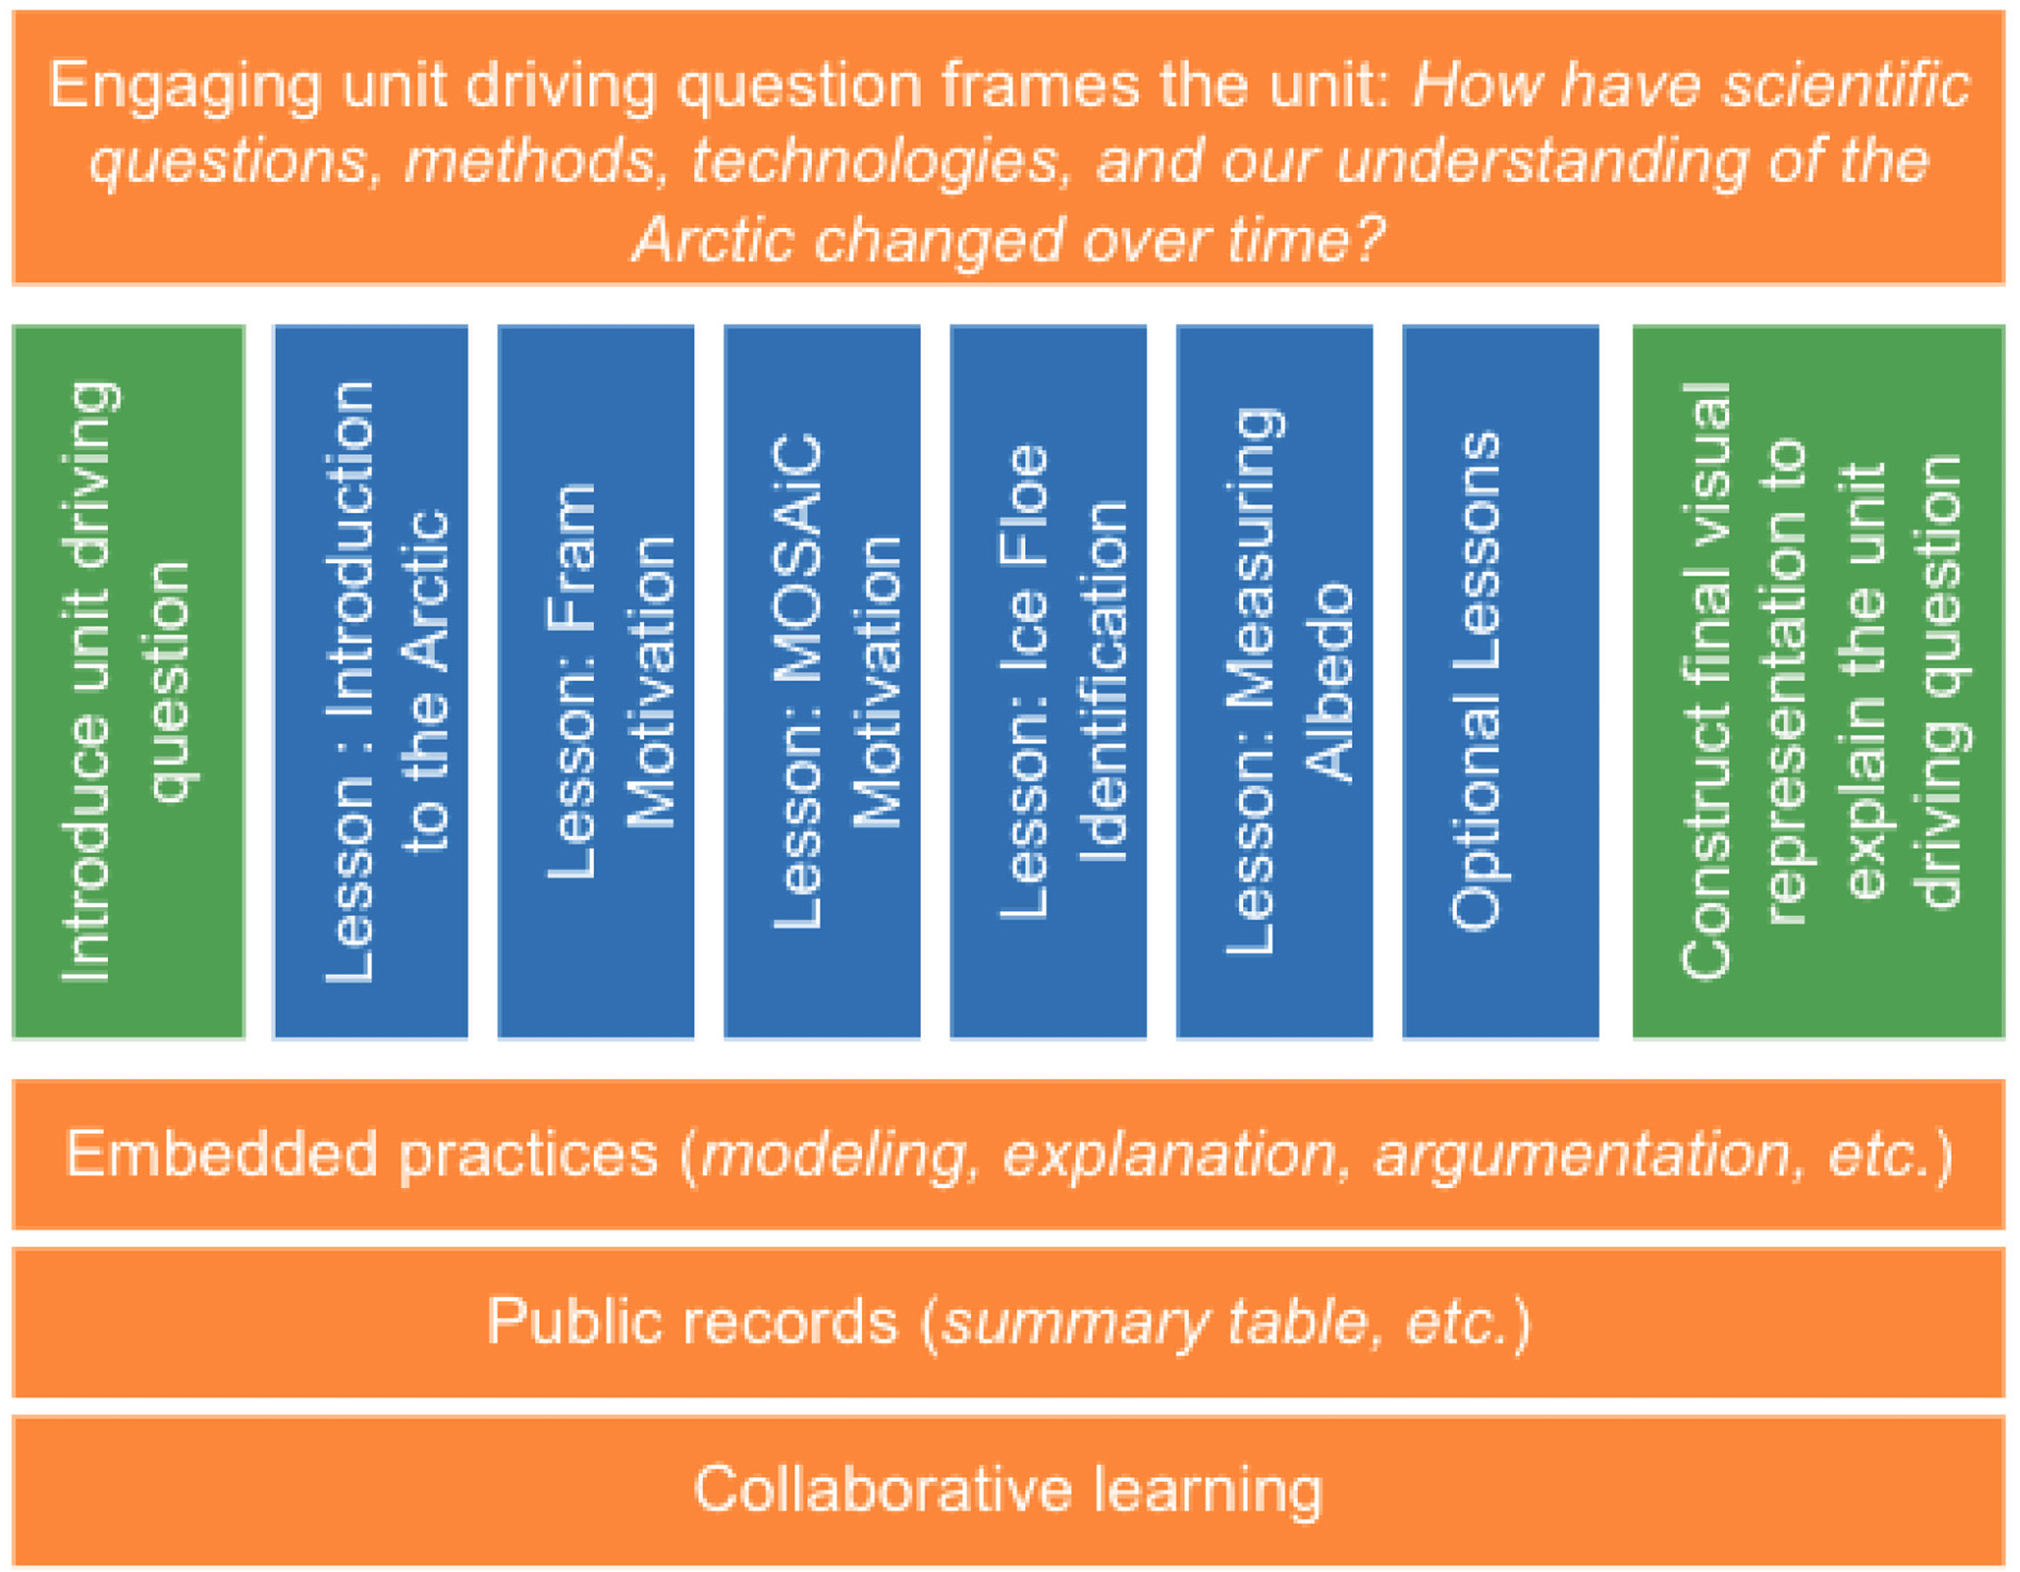
Basic flow of the unit, incorporating ambitious science teaching practices. Figure modified from Model-Based Inquiry (see Model-Based Inquiry and Ambitious Science Teaching in Resources).
Teacher Tips for Teaching Nature of Science Concepts in the Context of Past (Fram) and Present (MOSAiC) Arctic Expeditions
Planning the Unit
- Student worksheets may be copied as Google Docs and can be edited and assigned individually to students to help with paperless classrooms, remote learning scenarios, and to accommodate IEP/504 and/or GT/advanced students.
- Consider utilizing the screen reader function included in Google Docs.
Introduction to the Arctic
- There are many misconceptions students have about life in the Arctic region related to resource management, shipping routes, wildlife, native peoples, among others. Be sure to review the presenter notes provided in the Google Slides presentation prior to implementing the lesson.
- Facilitate a discussion about the ways in which a changing Arctic climate system and increased access to the region has affected and will continue to affect the 4+ million that call the Arctic home.
- The video is very engaging and students tend to forget to fill in the student worksheet; filling it in as a class or after the video is more productive and will have you pausing and/or rewinding less.
Fram Motivation
- Play creak and groan sounds from a wooden ship (see Online Resources) in the background during the VR tour—the students LOVE it!
- Students typically stay engaged with the VR devices for ~20–30 minutes. If students work in pairs (due to limited equipment), consider extending student time with devices.
- Students often will seek out more information, videos, and images after engaging with the VR tour. Plan on using more than one class period to implement this lesson to allow time for questions (e.g., “Did they do similar expeditions to Antarctica in the 1800s? If so, did they compare their data?”) and additional research.
MOSAiC Motivation
- To accommodate all students, graph and analyze Arctic sea ice extent data as a whole class by utilizing a smartboard/projector. Graphing as a whole class takes ~20 minutes; expect it to take longer if students are graphing individually or in pairs.
- Facilitate a discussion about the importance of using data to inform future climate projections.
Ice Floe Identification
- Have students gather data; then as a class, have them create visual representations to show the variance of choices they made based on their expertise.
- Altering the Arctic sea ice thickness map to show the locations is helpful for younger students as they determine the best choice.
- Remote learning tip: Assign students to groups and roles to facilitate collaboration on shared documents.
Measuring Albedo
- When using the app, have students use the same gray surface (see printable gray card document provided in the lesson resource).
- Remote learning tip #1: If students do not have access to a printer, any gray surface that is close to the card’s color will work.
- Remote learning tip #2: If students do not have access to a smartphone or tablet to download the app, provide them with previously collected data (with screenshots) to analyze.
Final Visual Representation
- Encourage students to express their learning in multiple ways by providing them with a running list of resources they could use to create their final product—Prezi, TinkerCAD, Canva, Sketchup, etc. This is especially helpful if implementing through remote learning.
Lesson sequence
Day 1: Introduction to the Arctic
The first step in facilitating the unit is to connect students to the Arctic and introduce the unit’s driving question. Ask students to share what they know or have heard about the Arctic. Teachers are encouraged to draw comparisons between the Arctic (e.g., temperatures, wildlife, length of day, etc.) and the students’ geographic location. Help students understand the geography of the Arctic with a mapping exercise in which students will (1) define the Arctic and (2) label the eight countries surrounding the Arctic Ocean. Conclude the mapping exercise with the following discussion prompt: “Which country do you think has the greatest influence over the Arctic region? Why?” Use this prompt to segue into a video about the geopolitics of the Arctic (see Arctic geopolitics video in Online Resources) and how those politics are becoming more complicated as sea ice melts and the Arctic becomes more accessible. As the race to control the Arctic “heats up,” it is vital that we understand the Arctic of the past and the present to prepare for the Arctic of the future (see Teacher Tips in sidebar). It’s through this lens that students are introduced to the unit driving question: “How have scientific questions, methods, technologies, and our knowledge of the Arctic changed over time?” Each lesson
thereafter focuses on comparing and contrasting two historic Arctic expeditions—one from the past, the Fram expedition (1893–1896), and one from the present, the MOSAiC expedition (2019–2020), with new learning made public via a whole-class summary table (see Figure 3). NOS connection: Science knowledge can describe consequences of actions but is not responsible for society’s decisions.
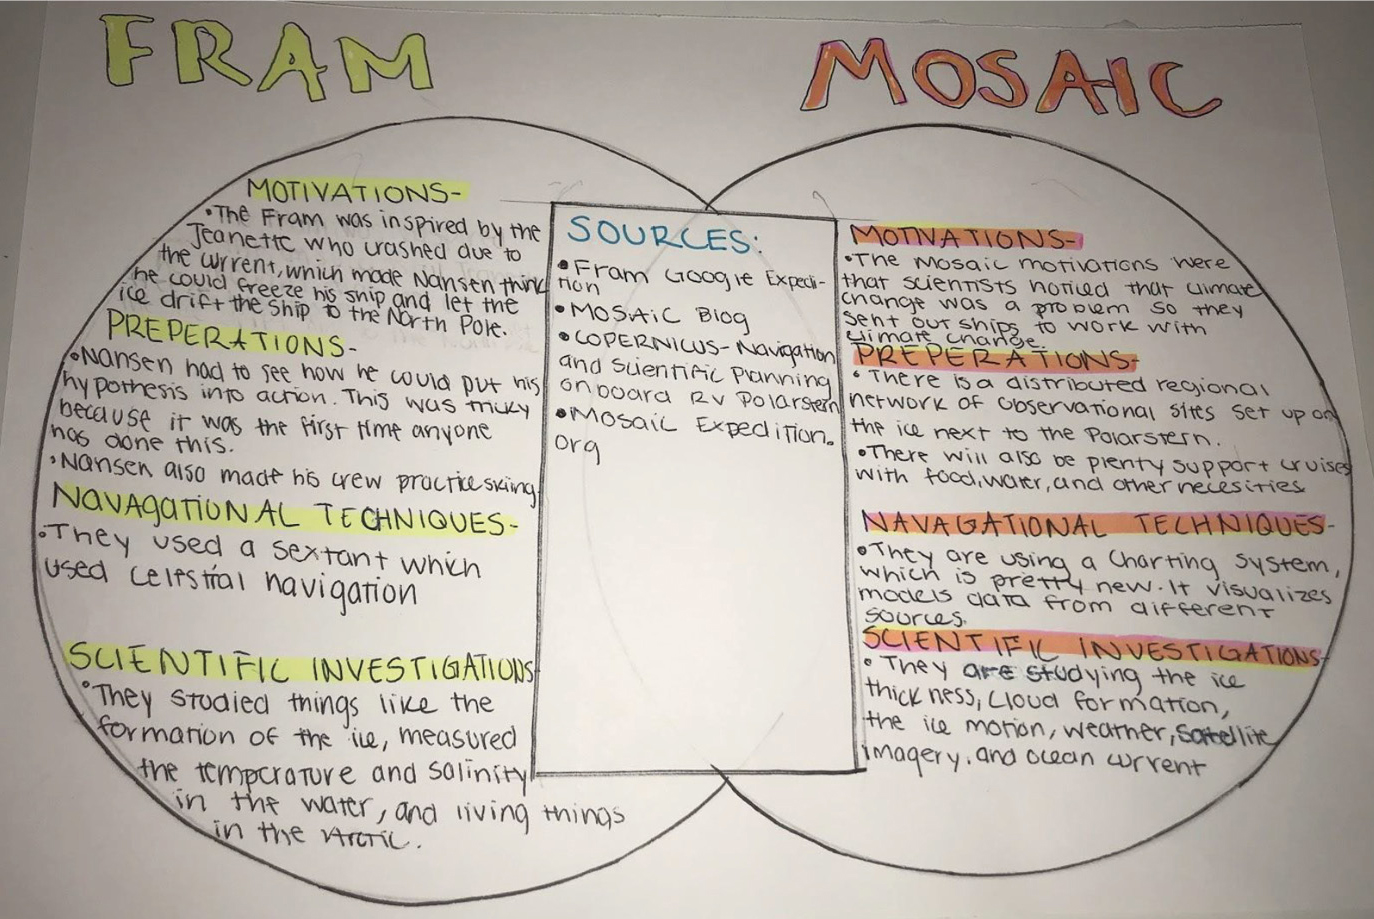
Example summary table from sixth-grade classroom comparing and contrasting Fram and MOSAiC expeditions.
Day 2: Fram motivation
In this lesson, students experience the Fram expedition through an immersive virtual reality Google Expedition and learn why science truly is a “human endeavor.” Begin the lesson by playing a video that documents the historic Fram expedition (see Fram expedition video in Online Resources), the first attempt to reach the North Pole by freezing a ship in sea ice and drifting with the sea ice across the Arctic Ocean. Students then engage with a freely available 360-degree virtual reality tour, “Explore the Arctic Aboard the Fram” (see Online Resources) in which students will tour the Fram (ship) to learn more about the expedition, including how two members of the Fram expedition made a dash for the North Pole spending 18 months navigating the Arctic on foot, surviving by eating polar bear and walrus meat (see Teacher Tips). The VR tour can be viewed online or through VR headsets (~$15/headset). For safety, remind students to stay seated or stand in place if using VR headsets. Students will answer questions as they tour the Fram, describing times during the expedition when crewmembers displayed human qualities that contributed to the success of the expedition (see Fram motivation student worksheet in Supplemental Materials). NOS connection: Scientists and engineers rely on human qualities such as persistence, precision, reasoning, logic, imagination, and creativity.
Day 3: MOSAiC motivation
The MOSAiC expedition follows in the footsteps of the Fram expedition, using the same transpolar drift to passively drift and collect data through a full annual cycle in the Arctic in one of the most remote places on Earth. In this lesson, students discover what is known and unknown about the Arctic, and what is motivating hundreds of scientists from around the world to spend a year frozen in ice as part of the MOSAiC expedition. Begin the lesson with a video that describes the MOSAiC expedition (see MOSAiC Expedition video in Online Resources) and brings students to the Arctic sea ice. Then, lead a discussion about the various challenges MOSAiC scientists faced when conducting their work in the Arctic: storms, polar night, dynamic sea ice, polar bears, COVID-19, and so forth. Ask students to reflect on what they have learned in previous lessons and consider if they would want to participate in an Arctic expedition. Of particular interest to MOSAiC scientists is how changes in the extent, or area, of sea ice covering the Arctic will impact the Arctic climate system. Students work in pairs to analyze and interpret an Arctic sea ice extent data set (see NASA sea ice extent data in Online Resources) collected via satellite observations from 1979 to 2019 (see Teacher Tips). Students identify patterns in the data set and create a list of factors/processes that might explain these patterns. Implementing teachers suggest using prompts such as “How do you make/melt ice?” to help students struggling to identify factors (e.g., temperature, precipitation) that could affect the stability and change of sea ice. These same teachers also emphasized the importance of making student ideas visible via a public record and discussing the numerous factors and complexities involved in the growth/melt of sea ice. Students then compare these satellite observations to model predictions of sea ice extent over the same time period. Students will see differences between the two data sets, which are attributable to scientists not yet fully understanding the factors/processes that affect the stability and change of sea ice (see MOSAiC motivation answer key in Supplemental Materials). To develop more accurate model predictions of Arctic sea ice and other Arctic processes, it’s important to collect data directly from the central Arctic—the motivation of the MOSAiC expedition (see Teacher Tips). Students will build on their understanding of factors/processes affecting sea ice extent (e.g., ice-albedo feedback) in a future lesson—Measuring Albedo. NOS connection: Scientific explanations are subject to revision and improvement in light of new evidence.
Days 4–5: Ice floe identification
The MOSAiC expedition began in September 2019, when the icebreaker RV Polarstern sailed north from Tromsø, Norway, into the central Arctic, in search of a suitable ice floe, or large flat piece of sea ice, to attach the icebreaker to and then drift with. In this two-day lesson, students analyze Arctic sea ice data, similarly to how MOSAiC scientists did, to find a suitable ice floe to attach an icebreaker to. On the first day, students complete a jigsaw activity in which they are individually responsible for developing a specific expertise as it relates to one of three analyst roles—satellite imagery, ice thickness, and drift—by reading and answering questions focused on their assigned role (see all three role descriptions in Supplemental Materials). Students then split into groups of three and share their expertise with the other members of their group. On day 2, students work in these same groups to analyze and interpret Arctic sea ice data (satellite imagery, ice thickness, drift) to select a location containing suitable ice floes for attaching an icebreaker to (Figure 4, see also Teacher Tips). Have students reflect on how each group member’s expertise was used to select a suitable ice floe to attach an icebreaker. Conclude the lesson by leading a discussion about the importance of collaboration in science. NOS connection: Science investigations use a variety of methods and tools to make measurements and observations.
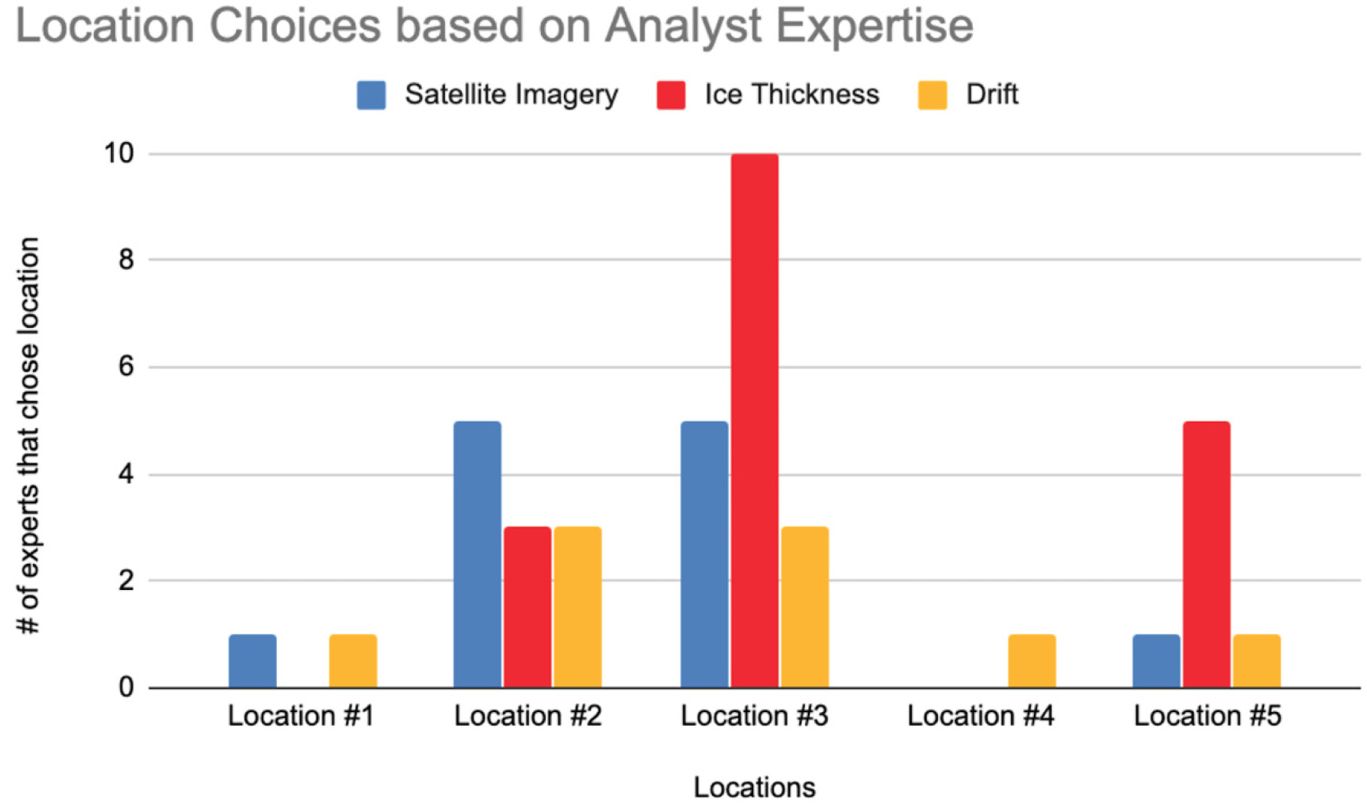
Consensus among student experts is that the ice in Location #3 best satisfies satellite imagery, ice thickness, and drift characteristics of a suitable ice floe to attach an icebreaker to. Example from a sixth-grade classroom.
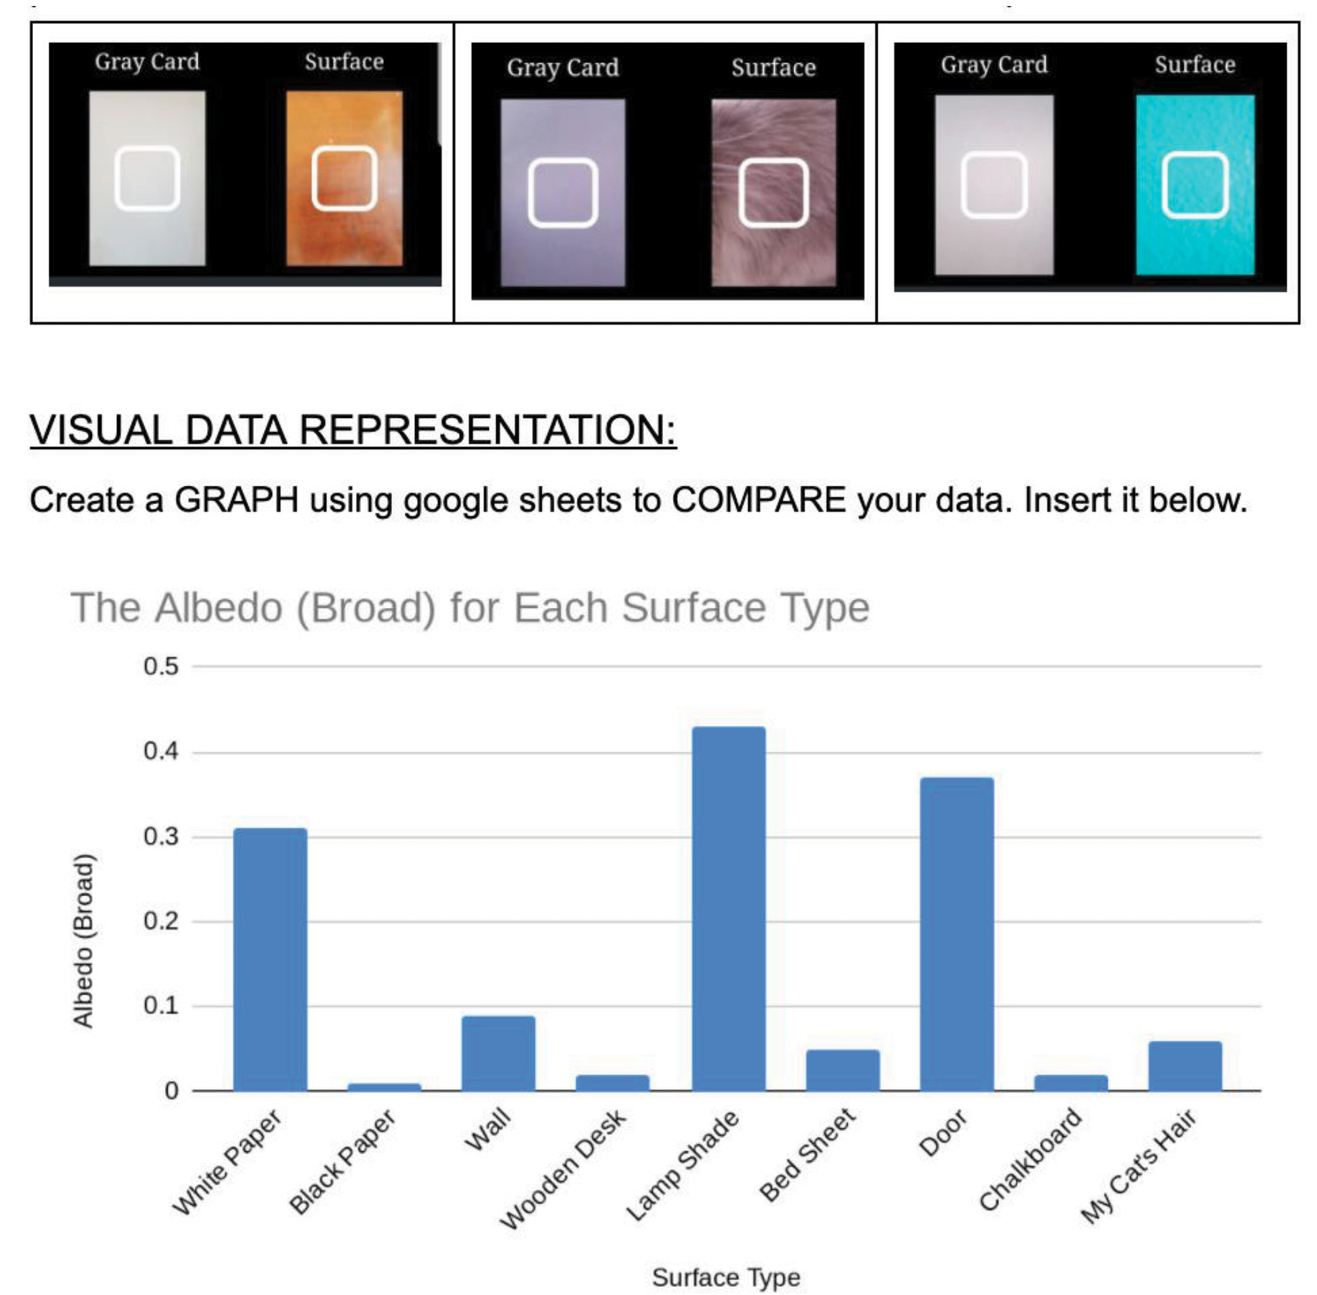
Excerpt from the student worksheet: Students use the “Albedo: A Reflectance App” and a gray card/surface as a reference to measure the albedo of different colored surfaces.
Day 6: Measuring albedo
The Arctic is warming twice as fast as the rest of the world, a phenomenon known as Arctic amplification. One factor contributing to this amplified warming in the Arctic is the ice-albedo feedback, a positive feedback loop in which melting sea ice leads to a decrease in the Arctic’s albedo (reflectivity) and results in an increase in the amount of energy (heat) being absorbed by the darker ocean. More energy (heat) absorbed leads to further ice melting and the process continues; MOSAiC scientists use radiometers to measure the albedo of the Arctic at specific locations and rely on satellites to measure the surface albedo across the entire Arctic.
In this lesson, students use a free app (see Albedo: A Reflectance App in Online Resources) to measure the reflectance (albedo) of different surfaces to come up with a rule to describe the relationship between the color of a surface and its albedo (see Figure 5). Implementing teachers reported that students enjoyed using the app to measure the albedo of a variety of surfaces including their cats and dogs, with one student even measuring the albedo of their dad’s bald head (see Teacher Tips)! Ultimately, students discover that lighter colored surfaces have a higher albedo than darker colored surfaces. Then, students measure the rate at which ice melts on light- and dark-colored surfaces, representing the ice and ocean, respectively. Students observe that the ice cube placed on the dark surface melts more rapidly due to the fact that dark-colored surfaces absorb more energy than the more reflective, lighter colored surfaces. Finally, students apply what they’ve learned to predict how a decrease in sea ice would impact the albedo and temperature of the Arctic (ice-albedo feedback). NOS connection: Science knowledge is based upon logical and conceptual connections between evidence and explanations.
Day 7-plus: Final visual representation of the unit driving question
In this lesson, students use the information gathered through the Exploring the New and Old Arctic curriculum, comparing and contrasting the Fram and MOSAiC expeditions, to develop a visual representation (see Teacher Tips) for the unit driving question, “How have scientific questions, methods, technologies, and our knowledge of the Arctic changed over time?” The assessment is to be completed in small groups and will likely take 2-plus days to complete (see final visual representation example in Supplemental Materials). Student groups are prompted in the instructions to weave NOS understandings into their final assessments.
Conclusion
This article provides an example of a NOS unit around an engaging driving question. These lessons build an understanding of the creativity, serendipity, and excitement that is nature of science in the context of past (Fram) and present (MOSAiC) Arctic expeditions. •
Online Resources
Next Generation Science Standards, Appendix H—https://bit.ly/2YceiCm
MOSAiC expedition—https://mosaic.colorado.edu/
Ambitious science teaching—https://ambitiousscienceteaching.org/
Model-based inquiry—https://sites.google.com/view/modelbasedinquiry/home?authuser=0
Arctic geopolitics video—https://www.youtube.com/watch?v=Wx_2SVm9Jgo
“Explore the Arctic Aboard the Fram” virtual reality tour —https://poly.google.com/view/6UdZ-VJScpL
Fram expedition video—https://www.youtube.com/watch?v=MsRHn6tpSmc&list=PL_h79kf2zxagh3Q9EQt9fTwufk2XS5Cvb&index=7&t=0s
Creaks and groans from a wooden ship—https://www.youtube.com/watch?v=T3Ur1wfTQb8
MOSAiC expedition video—https://www.youtube.com/watch?v=o-RdumGRvm4&feature=emb_logo
NASA sea ice extent data—https://climate.nasa.gov/system/internal_resources/details/original/1929_Arctic_data_1979-2019.txt
Albedo: A Reflectance App—https://play.google.com/store/apps/details?id=com.h2optics.albedo&hl=en_US
Supplemental materials
- Fram motivation student workwheet
- MOSAiC motivation answer key
- Optical satellite imagery analyst role description sheet
- Ice thickness analyst role description sheet
- Drift analyst role description sheet
- Final visual representation example
- Unit summary
- Connecting to the Next Generation Science Standards
Jonathan Griffith (jonathan.griffith@colorado.edu) is an Education & Outreach associate, Lynne Harden is an Education & Outreach associate, and Anne Gold is the director of Education & Outreach, all in the Cooperative Institute for Research in Environmental Sciences at the University of Colorado Boulder. Shelly Grandell is a science teacher at Ken Caryl Middle School in Littleton, Colorado.
Climate Change Curriculum Earth & Space Science General Science Inquiry Instructional Materials Interdisciplinary Lesson Plans NGSS STEM Middle School High School