
feature
Unpacking the Universe
Accessible and active learning activities for analyzing authentic data
The Science Teacher—March/April 2023 (Volume 90, Issue 4)
By Ardis Herrold, Edward Prather, and Justine Schaen

Beyond basic observations of the night sky, obtaining and using authentic astronomy data in the classroom can be very difficult. As a result, learning about the universe often happens through simulations that try to model the real world, but may fail to engage students with developing robust understandings of the universe from data.
Although some repositories of data and ambitious “authentic research” activities designed to get students to use data already exist, these activities commonly come with significant time and resource commitments, and they require both teacher and learner to operate as pseudoexperts in querying and retrieving data, and in designing and carrying out their research projects. These challenges are mismatched with the classroom resources, as well as the knowledge and skills of the teachers and students these activities intend to reach.
Vera C. Rubin Observatory (Figure 1) has developed a series of free online investigations (http://rubinobservatory.org) that provide students and teachers with easy access to recently acquired data and collaborative learning tasks that effectively and efficiently guide learners in their exploration of commonly taught modern astronomy topics.
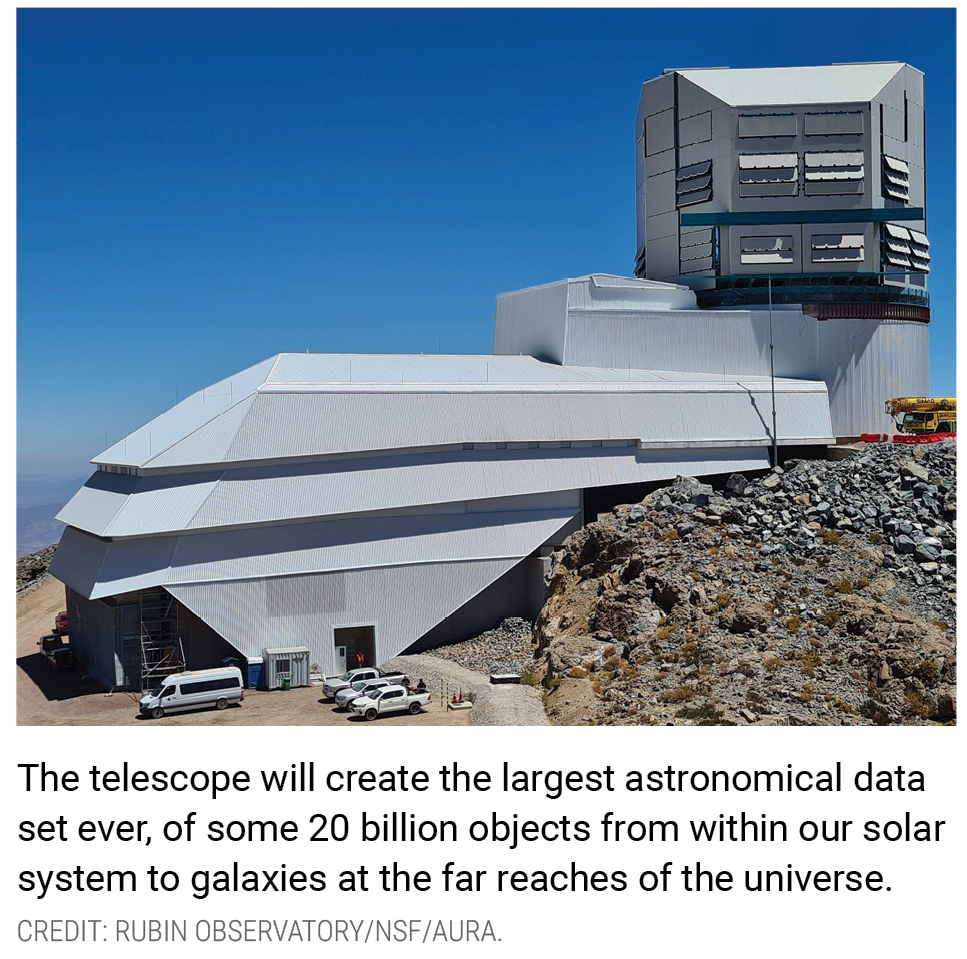
Rubin Observatory under construction on Cerro Pachon, Chile, February 2021.
These investigations have been designed and tested with thousands of students from diverse backgrounds to match the conceptual and reasoning abilities of high school and college students enrolled in general education Astronomy 101 courses and are appropriate for use with advanced middle school students.
Below we highlight the components of the online investigations and the design principles that guided their development.
Investigations guide students through an exploration of the data that is facilitated by the use of innovative interactive data tools (Figure 2) and carefully constructed question-and-task sequences. All that is needed is access to a browser; there is nothing to download or install, and no extensive training is required.
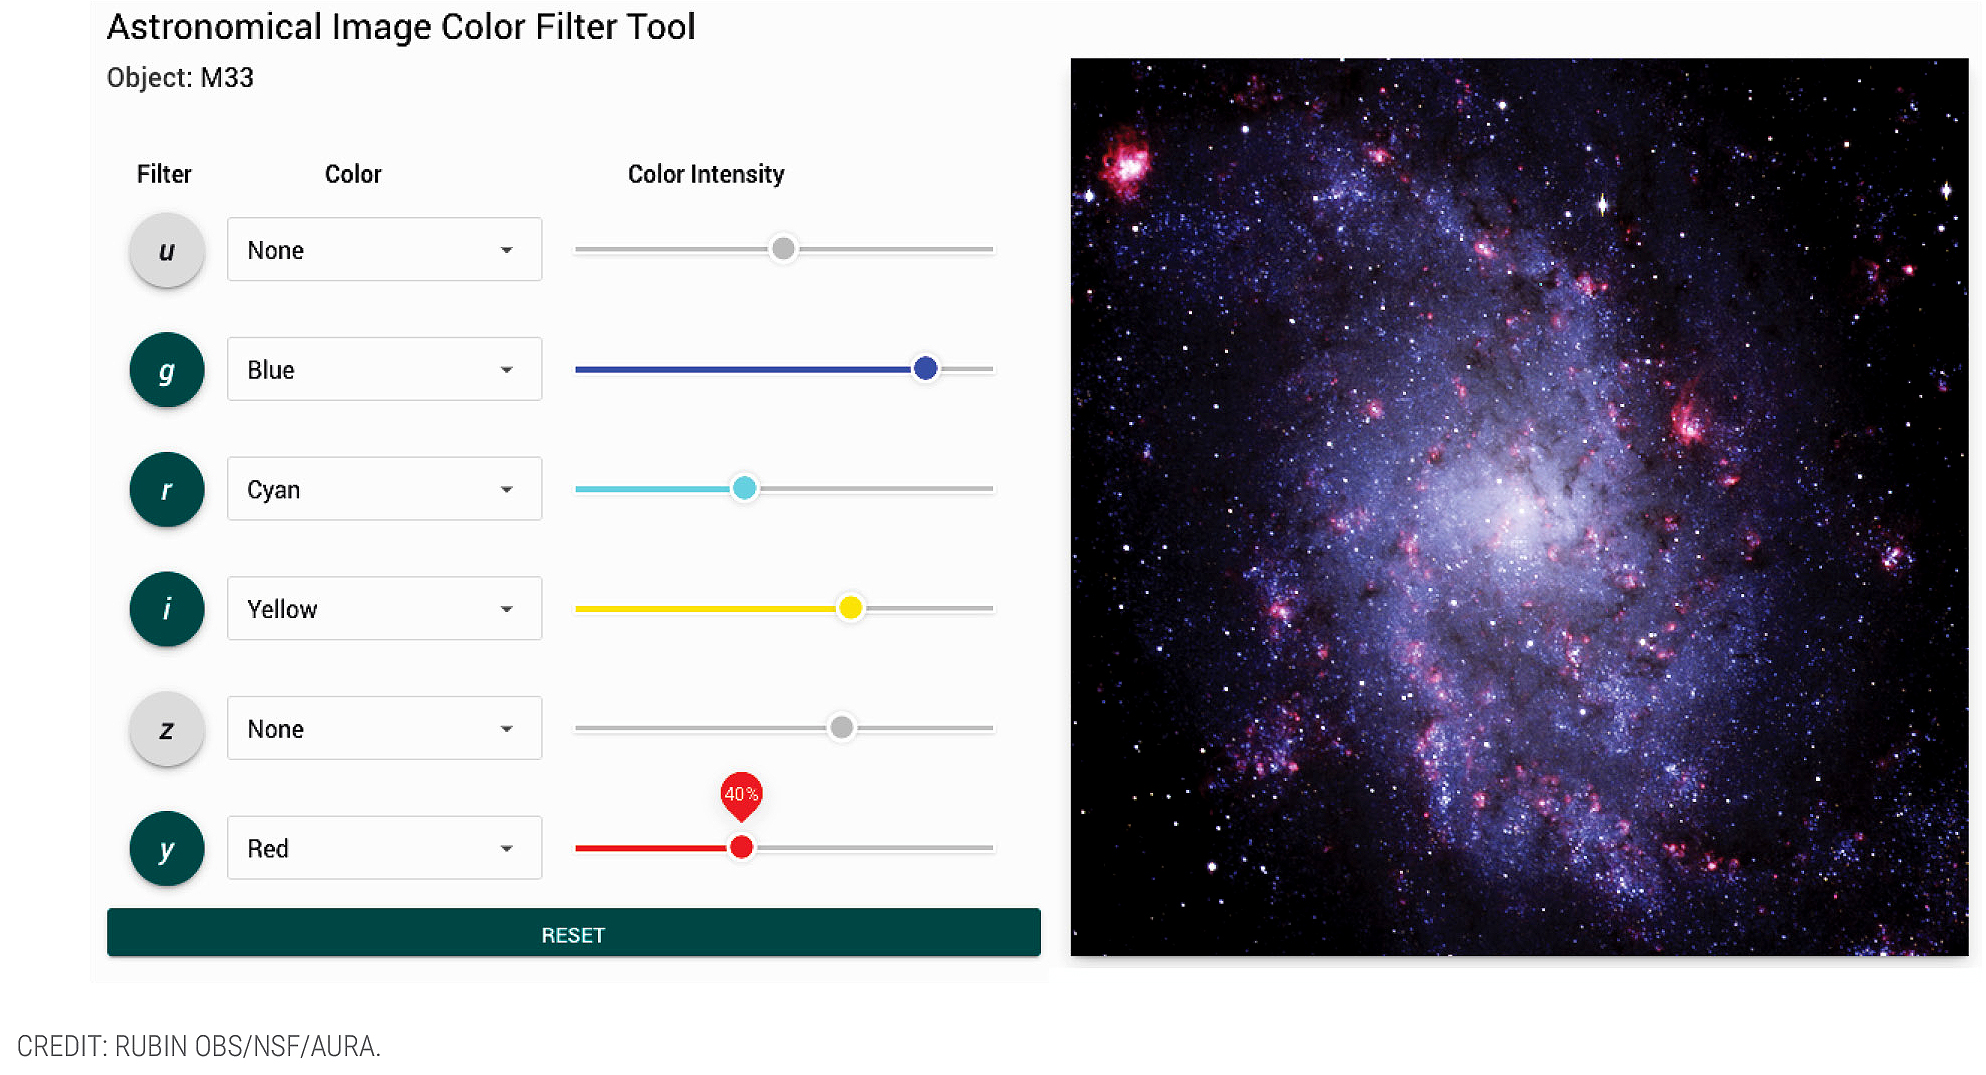
An example of an interactive data tool.
A topic-specific guide serves as a detailed road map to the investigation, with information about implementation, background content, and links to resources.
Each investigation has been designed to be introduced with a lesson phenomenon to promote student curiosity and drive the learning. Phenomena are thought-provoking, observable astronomical events or experiences students will want to explain or investigate, accompanied by a driving question that frames their inquiry. Students generate and organize their own questions on a Driving Question Board that will be revisited during formative assessment throughout the investigation. Students reflect on what they have learned as they refine and develop new questions. At the conclusion of each investigation, students apply their understanding of the phenomenon though a series of questions that promote sensemaking and knowledge transfer.
Multiple types of assessments are provided for every investigation. Before starting and after completing the investigation, students’ understanding of the topic and related science practices can be assessed using a pre/posttest. The results are used to determine student learning gains.
Formative assessment checkpoints throughout the investigation identify places to pause to assess and discuss students’ thinking and learning. For each checkpoint, key science ideas and data skills are identified along with questions that can be used to check for understanding. These checkpoints also provide opportunities for students to drive the learning process as they revisit the phenomenon, apply new knowledge to their questions, and seek additional information.
Summative assessments are designed to evaluate three-dimensional learning. Students complete targeted tasks and work through open-ended questions that focus on the investigation’s learning outcomes. An example of summative assessment from the Coloring the Universe investigation is shown in Figure 3. Prior to this summative assessment, students learn how filters transmit light and how astronomical color images are constructed by the technique of chromatic ordering. They gain experience with several different science tools and techniques to unpack the astronomical meanings coded in color images. They learn how to find distant galaxies with high redshifts by using infrared filters, locate hot young stars in a star cluster using short-wavelength filters, and identify star-forming regions in a galaxy using long-wavelength visible filters.
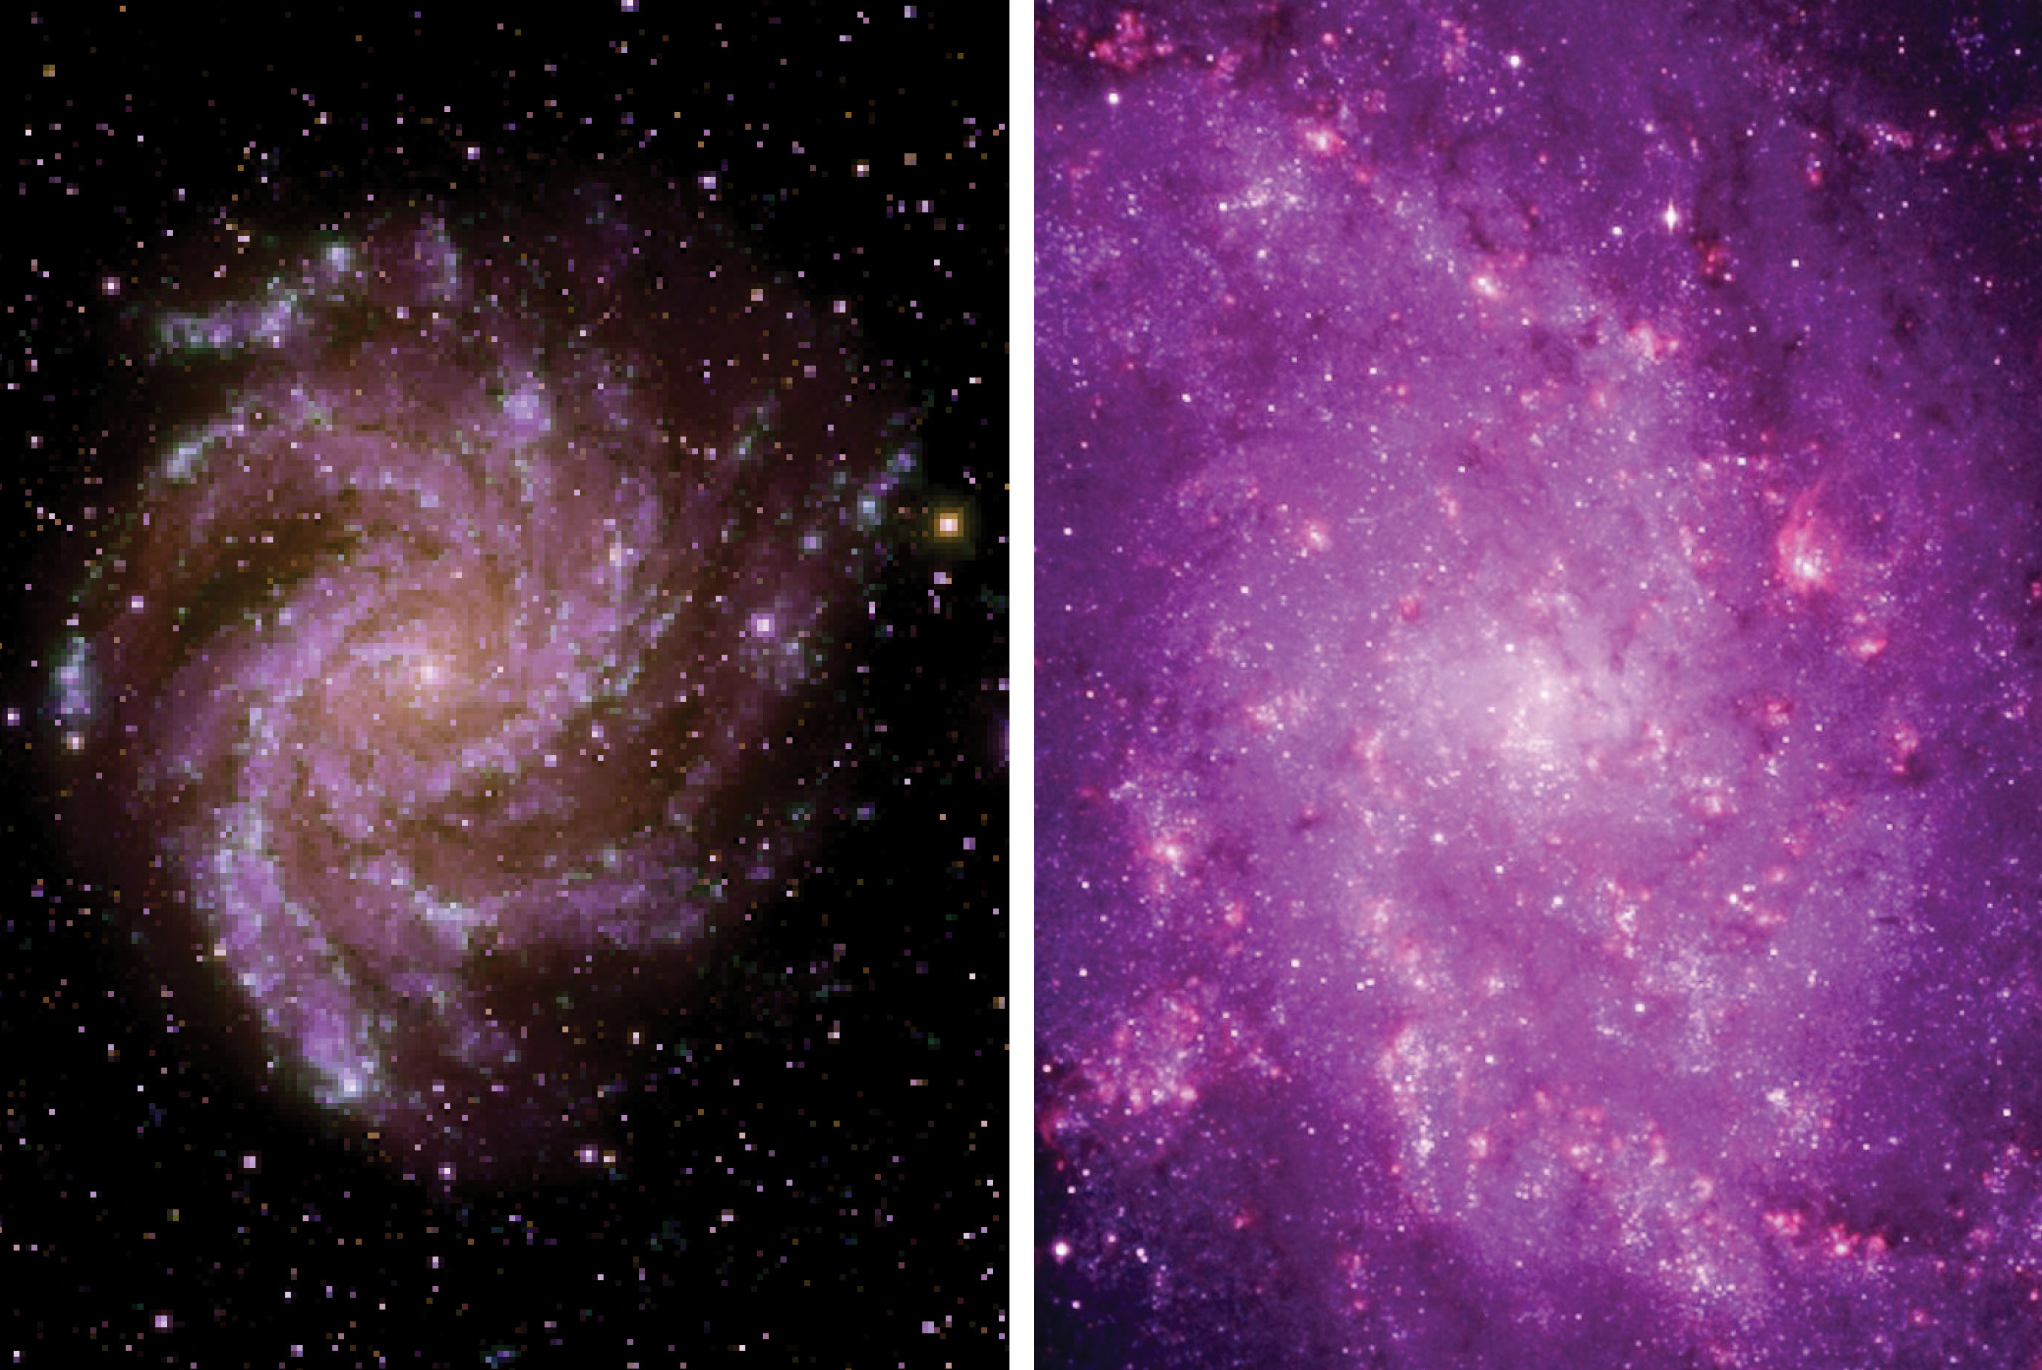
Left: A student image that correctly identifies the galaxy’s hot stars with violet colors. Right: A student image that fails to effectively identify hot stars.
Students begin this summative task by developing their own research question and astronomical object to investigate. Their research approach requires them to use the Astronomical Image Color Filter tool (Figure 2) to select wavelength-appropriate filters and create a color-balanced image that serves as evidence to answer their question. Although this student-driven task provides opportunities for students to design and conduct their investigation, it also includes questions that require them to reflect on their research process and learning. This task affords students the opportunity to demonstrate how they have integrated their understanding of the astronomical content with contemporary scientific applications and processes.
The task-based assessments are designed to provide teachers with student-generated products, which—with the help of scoring rubrics—can quickly and effectively differentiate levels of student achievement as demonstrated in the student images in Figure 3.
Investigation design principles
Investigations were developed through an iterative process that was informed by several design principles that are detailed in the following sections.
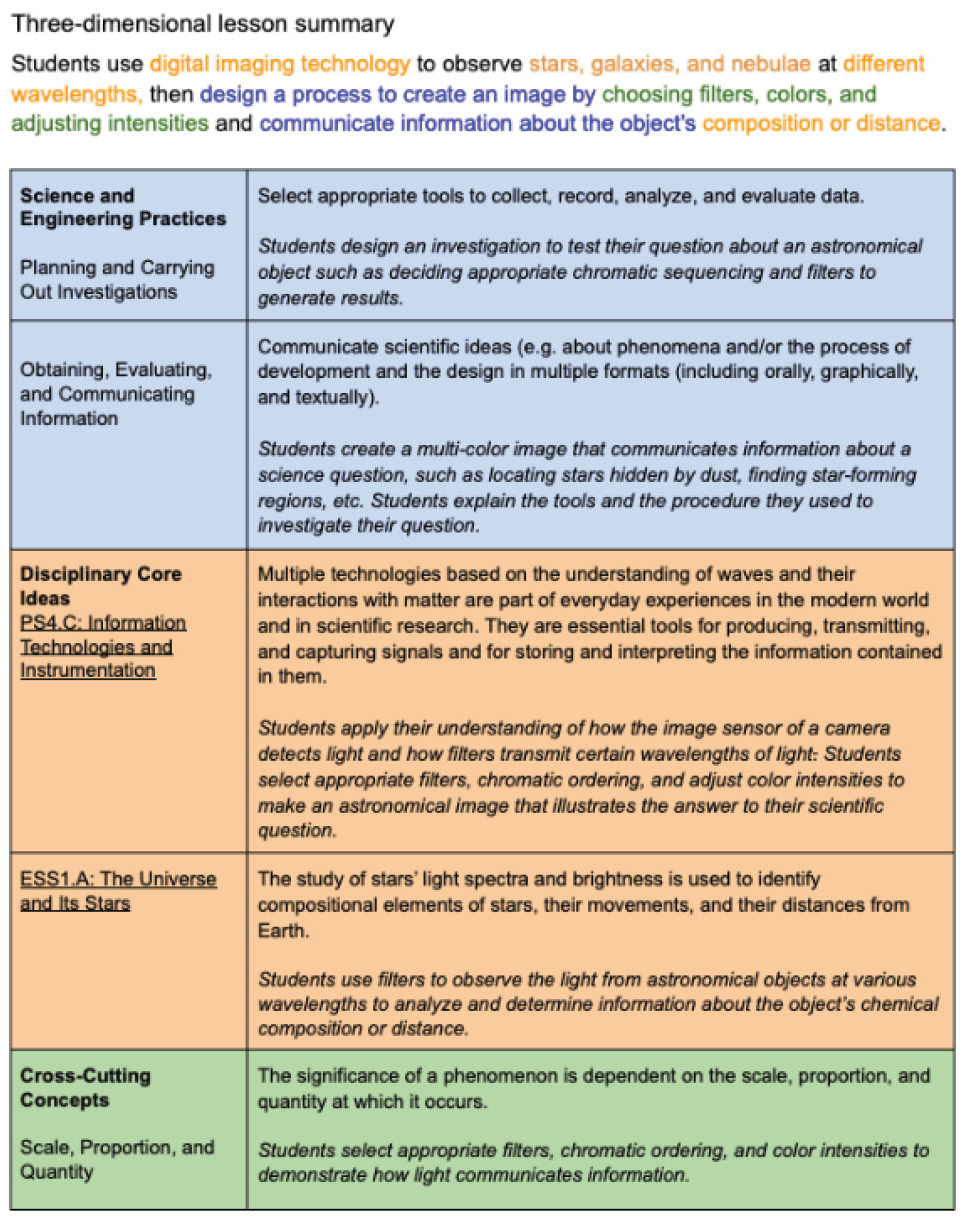
Investigations embody the three-dimensional design described in the Next Generation Science Standards (NGSS). All investigations have standards articulation and correlated scoring rubrics and guides for the summative assessments. The example in Table 1 comes from the Coloring the Universe investigation.
Coloring the universe standards
Building toward:
- HS-PS4-5 Communicate technical information about how some technological devices use the principles of wave behavior and wave interactions with matter to transmit and capture information and energy.
- HS-ESS1-2 Construct an explanation of the Big Bang theory based on astronomical evidence of light spectra, motion of distant galaxies, and composition of matter in the universe.
- HS-ESS1-3 Communicate scientific ideas about the way stars, over their life cycle, produce elements.
Each investigation has been designed by a team of experienced classroom teachers, astronomy education researchers, and professional astronomers who are experts at developing curriculum and assessment strategies that address the challenges of the science classroom as well as the needs of both instructor and novice learners.
Since science is a collaborative process, all investigations are designed for active learning that fosters discussion, critical thinking, analytical reasoning, and self-reflection. Although investigations may be adapted for an asynchronous online course, they work best in an in-person or synchronous classroom environment that fosters peer-to-peer interaction. Research studies demonstrate that active-learning strategies benefit all students (Rudolph et al. 2010), and in particular the learning of students with disabilities, students with limited English proficiency, and nontraditional students who may be underprepared or who lack confidence in doing science or math (Tomlinson and McTighe 2006).
The investigation design incorporates principles from social semiotics (Airey and Linder 2017) and variation theory (Lo 2013; Marton and Pang 2006) in which multiple modes of representations (text, images, graphs, charts, data tables, diagrams, equations, and simulations) are coupled to a carefully sequenced set of diverse tasks (rank, estimate, extrapolate, graph, compare, quantitatively reason, calculate, predict, analyze, and explain) that require students to intellectually engage with and communicate about the astrophysics they are studying.
To help students gain fluency with complex astronomical ideas and data relationships, numerous new Pedagogical Discipline Representations (PDRs) (Wallace et al. 2016) have been developed, which make discipline information more understandable for novice learners than typical textbook and expert representations. Each PDR is narrowly focused with well-understood disciplinary affordances (potentials for allowing access to pieces of disciplinary information) that promote unpacking (disassembling a package of information and making the various pieces and connections explicit) while enabling critical and disciplinary discernment (coming to recognize and understand what to focus on and interpreting it or making meaning using the appropriate context) (Airey and Linder 2017; Eriksson 2017; Fredlund et al. 2014; French and Prather 2020).
Investigations are explicitly designed to help students develop explanatory models they can use to interpret, evaluate, and make predictions about the physical system they are studying. Students are presented with scenarios designed to help them confront and address common conceptual and reasoning difficulties and generate data-based explanations. In the following example from the Surveying the Solar System investigation, students are presented with three hypothetical student models (Figure 4). They must evaluate and argue from evidence which model best represents the data for a newly discovered group of objects.
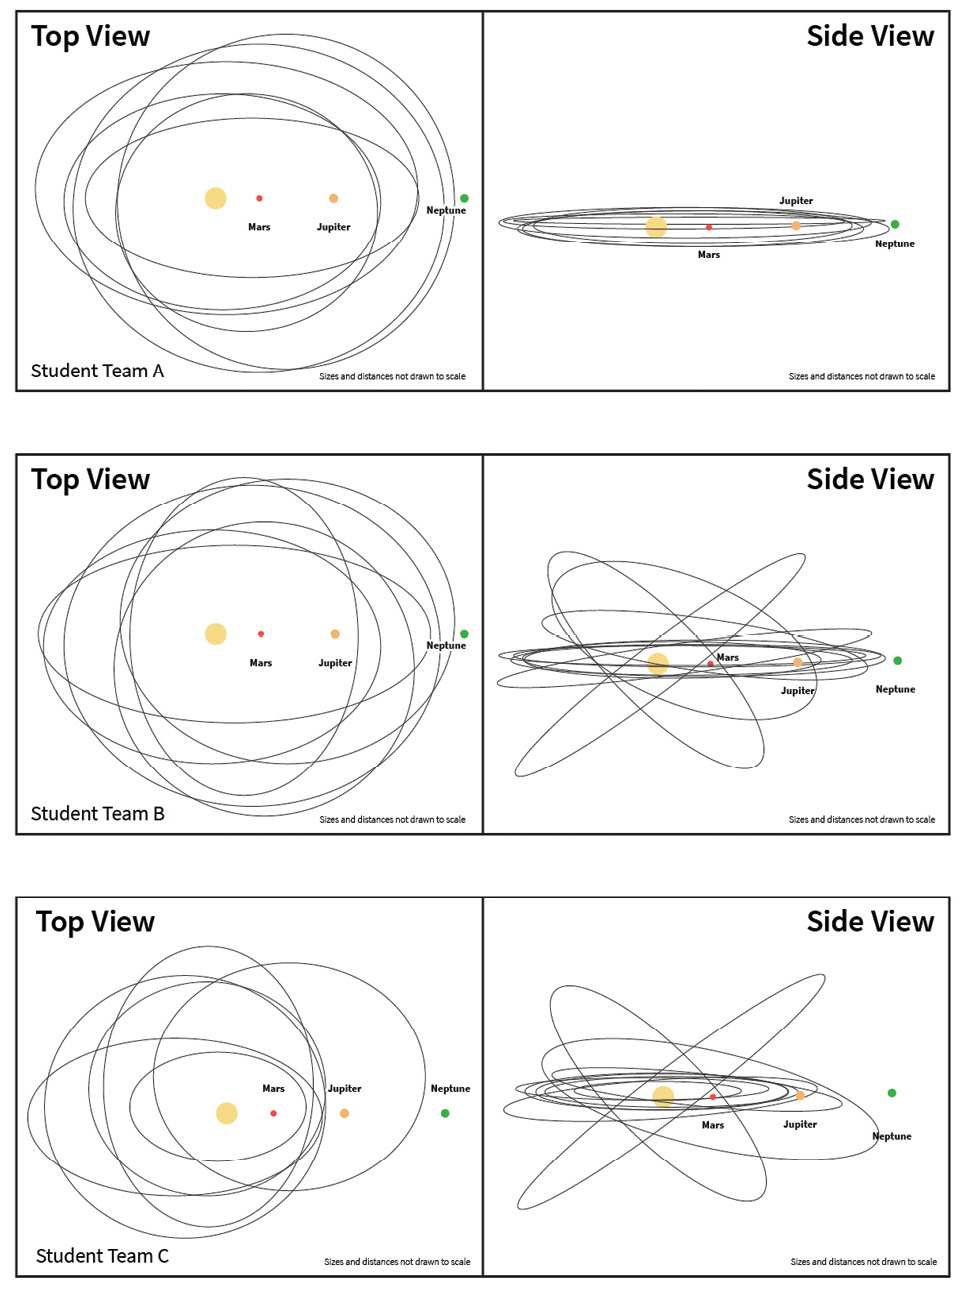
Three possible student models that attempt to illustrate the orbital characteristics of a newly discovered group of Solar System objects.
Where possible, students are provided with their own unique data sets and choice over how to explore their data, using analytical tools and processes that model those used by professional astronomers. Calculation of complex mathematical relationships is facilitated by embedded calculators, which frees students to focus their efforts on doing the analytical reasoning required to connect equation outputs to key science concepts. For some students, this also builds confidence that they can successfully “do math.”
Here are two examples that illustrate how the use of representations, tasks, and interactive data tools work together to engage learners in critical thinking and becoming more fluent with data.
In the Hazardous Asteroids investigation students learn the criteria that must be met for a newly discovered small solar system object to be deemed potentially hazardous for impact with Earth. Using the Orbit Viewer interactive data tool shown in Figure 5, students determine whether a newly discovered asteroid should be categorized as potentially hazardous. Students compare Earth’s orbit with the asteroid’s orbit, assess the asteroid’s minimum orbit intersection distance, and extract the value of the asteroid’s absolute magnitude. This information, along with key assumptions about the asteroid’s albedo, are used with the complex and auto-calculated mathematical relationship (shown on the left) to estimate the asteroid’s surface area. This information is carried forward in the investigation as students determine the asteroid’s mass and kinetic energy to evaluate the damage an impact could cause.
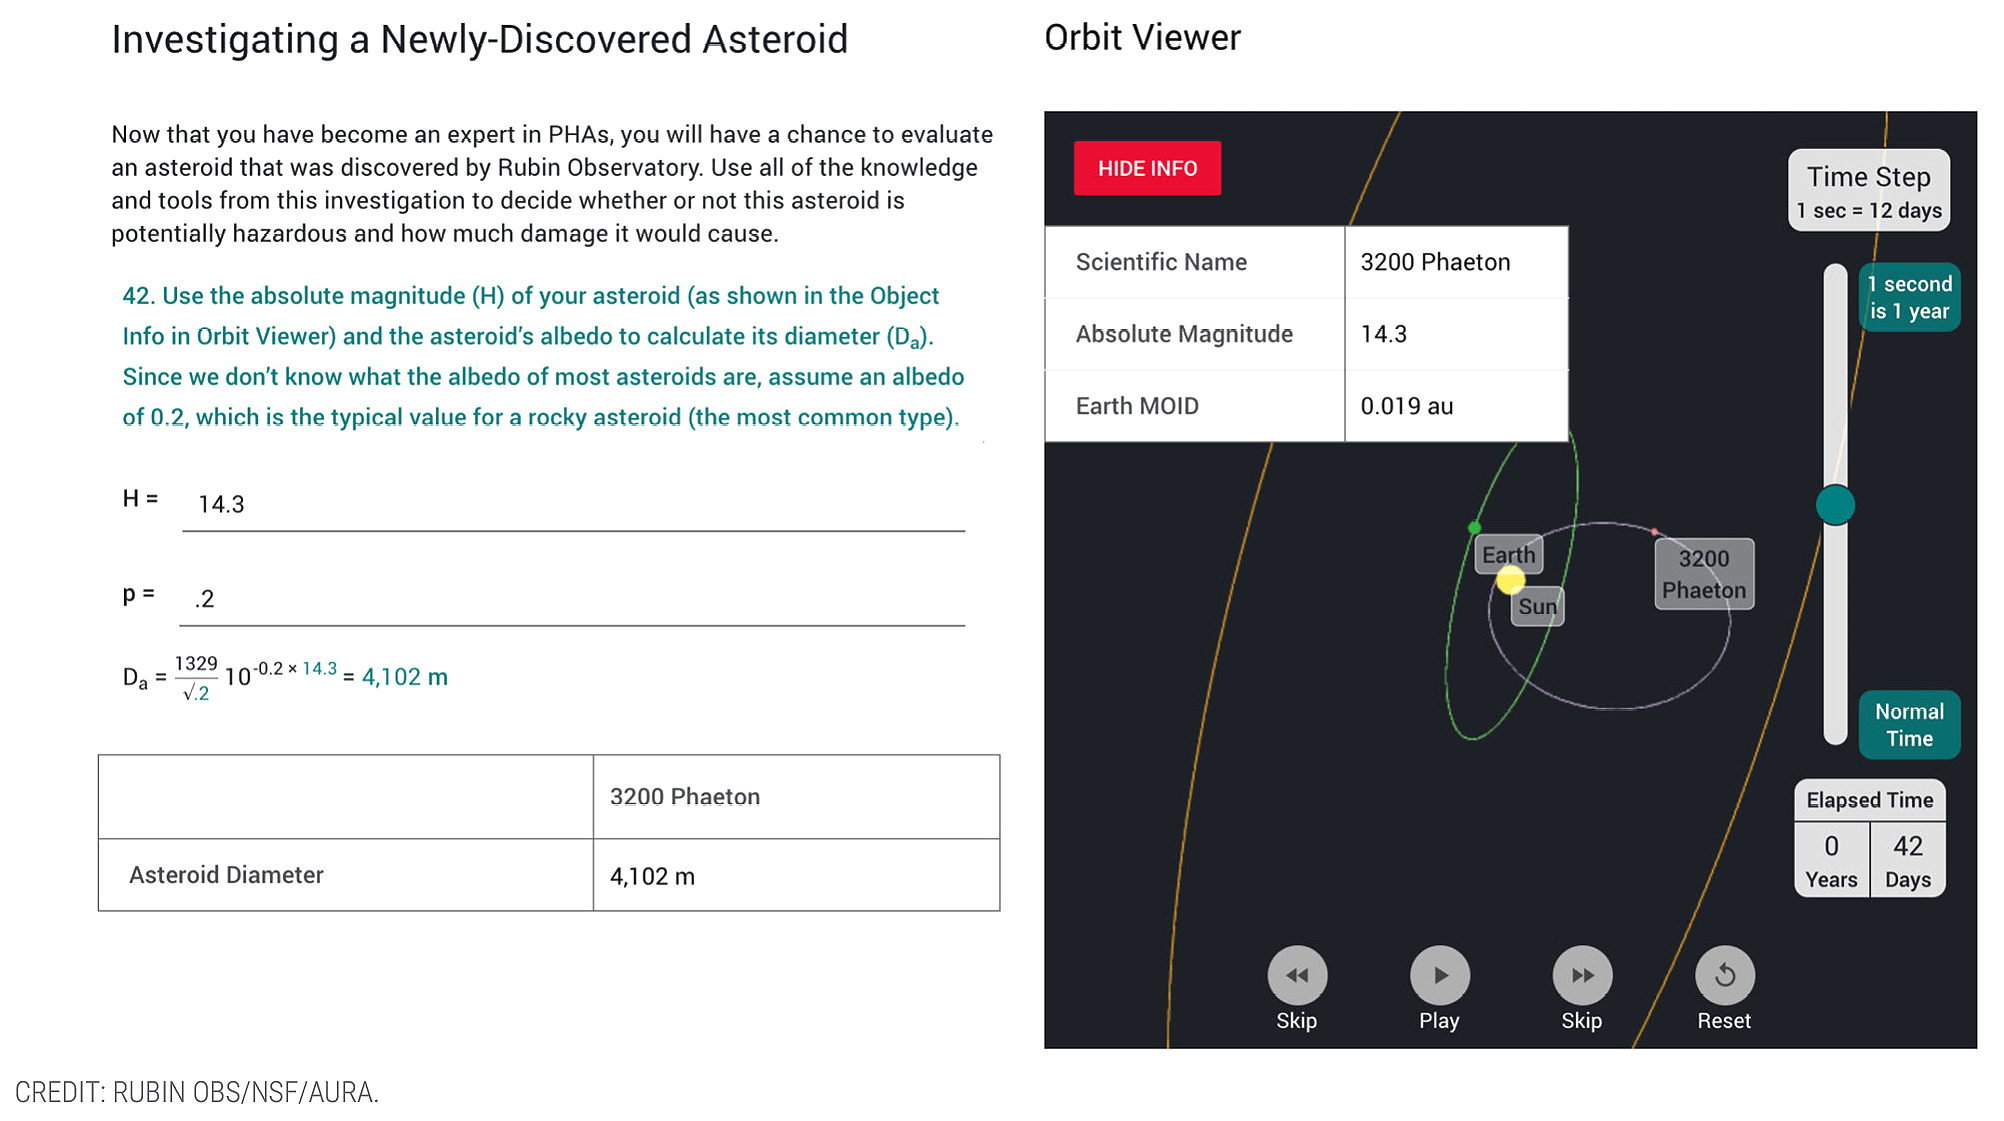
Orbit Viewer interactive data tool.
The Hubble plot interactive data tool from the Expanding Universe investigation (Figure 6) allows students to draw a best fit line through their galaxy recessional velocity and distance data. The tool calculates the slope and provides a numerical value for the expansion rate of the universe. This tool then affords students the ability to instantaneously change observer location in the universe from the Milky Way to other galaxies and rotate the perspective view to other galaxies. Further it allows students to investigate whether the linear relationship with galaxy recessional velocity and distance should be interpreted as implying that
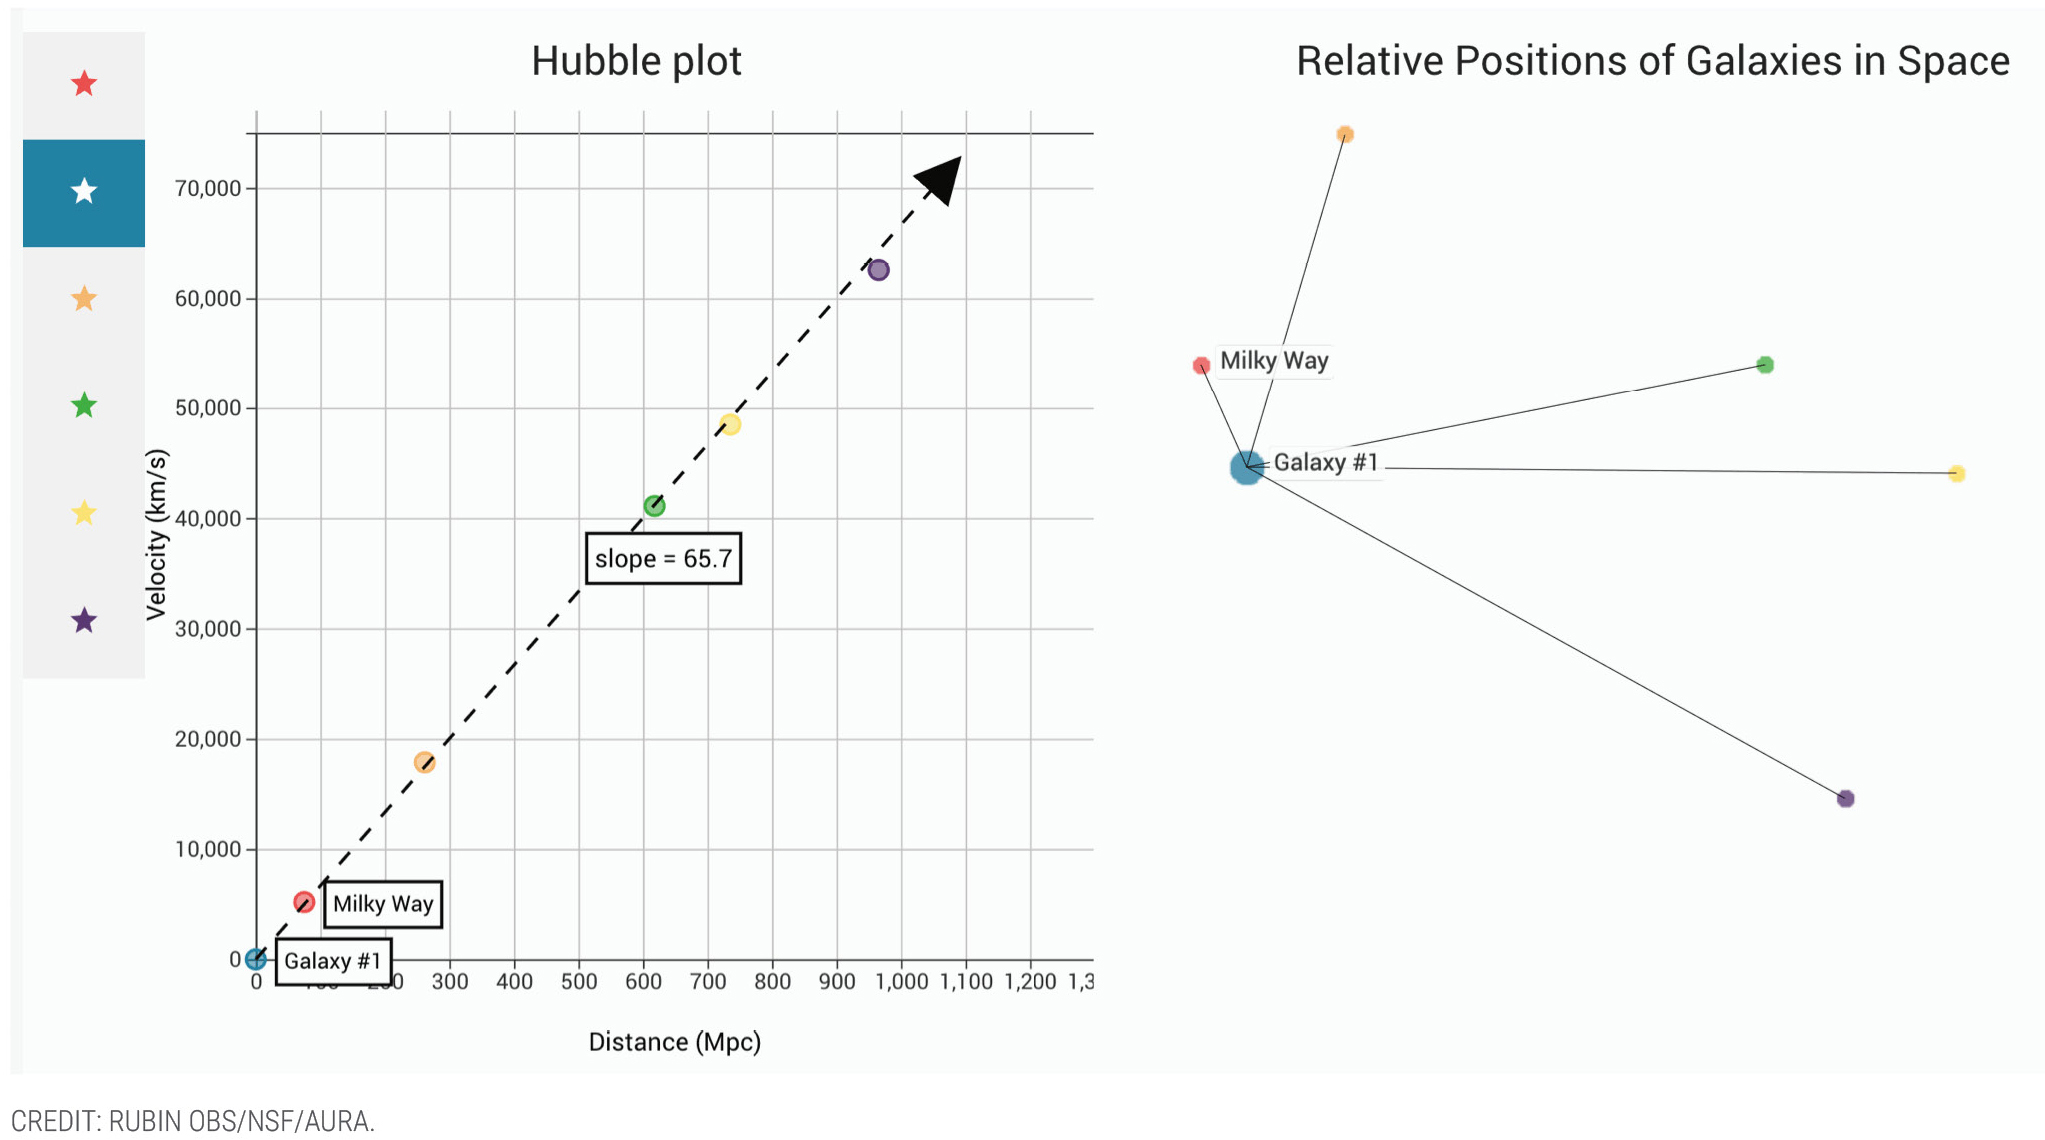
Hubble plot interactive data tool.
- galaxies actually lie along a straight line in the universe (a common reasoning difficulty held by students), and
- all locations in the universe will observe expansion occurring in the same way (addressing the more typical student idea that the universe has a center).
In addition to addressing student learning difficulties, this combined use of representations and tools lowers the burden associated with repeatedly having to replot data and calculate the slope of the best fit line, and it frees students to unpack and discern how their galaxy data can be used to understand foundational ideas about the expansion of the universe.
Throughout the learning described in these examples, students’ quantitative reasoning and data analysis skills are both challenged and facilitated by the diverse representations and online tools the investigations incorporate—something that is simply not possible to do with pencil-and-paper activities.
Central to investigation design are questions incorporating science content with human stories to help learners make connections between science practices and parallel practices in daily life. Questions in each investigation create opportunities for students to discover relevance between what they are learning and their personal interests, identities, and lived experiences, which can increase students’ interest, level of engagement, and agency in learning (Bell and Bang 2015; O’Donnell et al. 2021). Figure 7 shows an example of a question prompt from the Coloring the Universe investigation, which invites students to reflect on their personal experiences and beliefs.
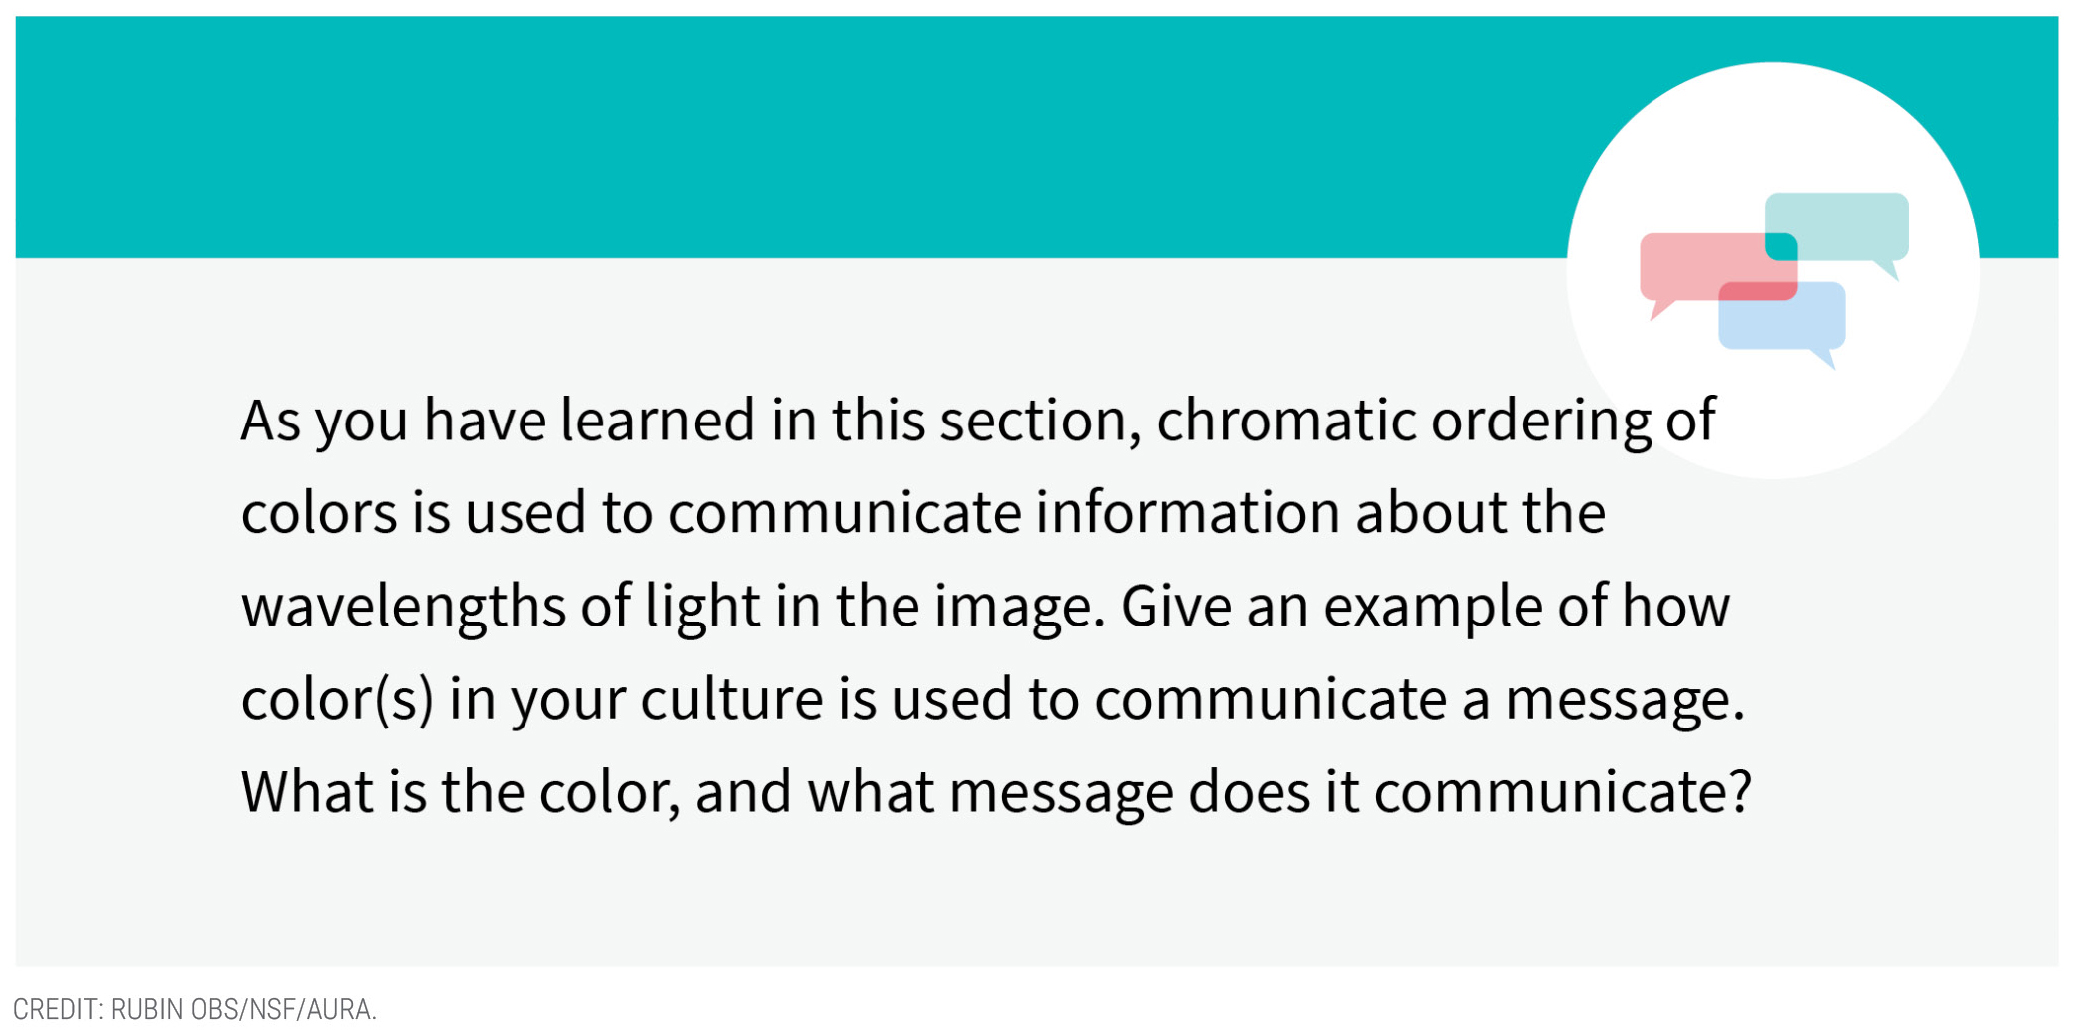
Diversity, equity, and inclusion question from Coloring the Universe.
Extensive classroom testing demonstrates that these investigations and support materials are deeply engaging students, while meeting the needs of teachers and their classrooms. Whether it’s an online or in-person course, lively collaborative student interactions using the interactive data tools to analyze the robust and authentic data sets transpire. Teachers’ real-time use of formative assessment questions has shown that students are developing understandings consistent with curriculum design goals. Assessing learning with the pre/posttests and summative assessments reveals that the learning objectives are being achieved, even in the relatively short amount of class time needed to complete an investigation.
Acknowledgment
Rubin Observatory thanks the hundreds of teachers and thousands of students who have contributed their efforts to improving these investigations over the past several years.
Ardis Herrold (aherrold@lsst.org) is the education specialist at Vera C. Rubin Observatory, Edward Prather (eprather@arizona.edu) is a professor at University of Arizona Department of Astronomy and Steward Observatory, and Justine Schaen (justine.schaen@noirlab.edu) is an education specialist at NSF’s National Optical-Infrared Astronomy Research Laboratory, all in Tucson, AZ.
Astronomy Earth & Space Science Inclusion Instructional Materials NGSS Phenomena STEM Teaching Strategies Technology Three-Dimensional Learning High School