At the core of a Next Generation Science Standards (NGSS) classroom is the sequence of exposing students to an interesting natural phenomenon, having students generate questions about the phenomenon, investigating student questions, then creating a scientific model to explain the phenomenon. Regardless of the practice defined in the performance expectation, this triad of phenomenon, questioning, and modeling should be incorporated into most NGSS lesson sequences.
One of the fifth-grade performance expectations (5-ESS1-1) is about supporting an argument concerning the apparent brightness of stars with respect to the stars’ distance from Earth. Before students can support an argument, they need to explore the nature of light and determine what happens to light as it travels through the universe. Students begin by viewing photographs of the night sky and generating questions. The following are examples of student-generated questions:
- Why do some stars twinkle?
- Why are some of the stars in groups and some spread out?
- How far away are the stars? Are some nearer to Earth and some farther away?
- Why do some stars appear bluish, some yellowish, and some reddish?
- Why do some stars look big and other stars appear little?
- When a star is really bright, is it closer to Earth?
I post many of these questions on the wall, and we focus on certain groups of questions as we proceed through the sequence of lessons. We take the questions about differences in stars with respect to size and brightness and turn them into questions we can investigate. For these lessons, we decided on this question: How is the brightness of light affected by the distance from the source of light?
Student groups were given access to a darkened room and provided with flashlights, meter sticks, and black paper and white paper. They chose their own method to find an answer to the question.
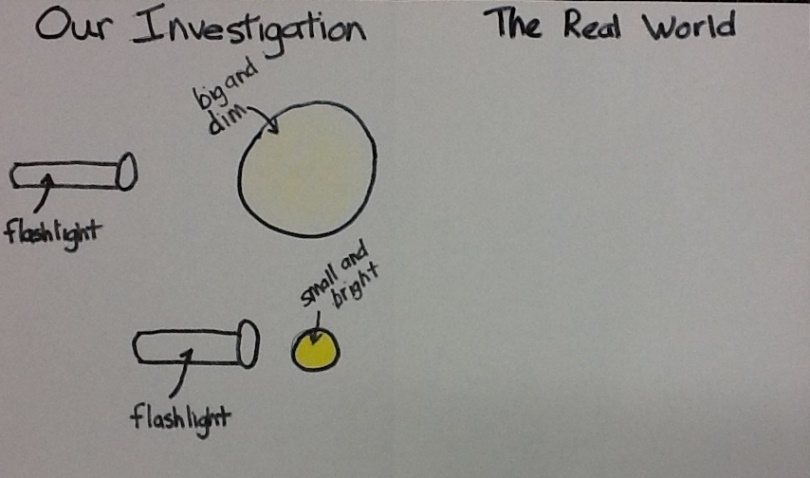 After the investigation, they were asked to use pictures and words to document their results. In this case, they used the left side of the piece of paper and labeled the right side with “The Real World,” with the instruction that this would be completed later. This is an example of student work.
After student groups generated initial explanations of their results, we critiqued and revised them. This was a new skill for my fifth graders, so we conducted this process as a group. I projected images of the students’ work and asked them to decide on one suggestion that would improve the explanation and one suggestion they could use to improve their own explanation. The class discussion included the following:
- What suggestions can you give to improve this? What can you take from this explanation to improve your own?
- Show the “light beam” between the flashlight and the circle of light.
- Did you use the same flashlight, or did you use two flashlights? If you used two flashlights, was one brighter and the other dimmer?
- Did you measure the size of the circle of light? If so, you should put your measurements on your explanation.
- Did you measure the distance between the flashlight and the circle of light? If you did, you should show the measurements on your explanation.
- Did you only try two different positions of the flashlight? What would happen if the flashlight was even further away?
The main part of discussion revolved around the “light beam” and what must be happening for the circle of light to get both bigger and dimmer. Students were given the opportunity to modify or supplement their diagram to incorporate additional information. The biggest change in most of the explanations was the addition of the light beam. Students discovered that it must spread out more as it moves away from the source. Many student groups returned to the flashlights to test and verify their ideas about how the light travelled as it left the source.
The next step was to have students transfer the results of their investigation. Students were supplied with flashlights and globes to determine how this happens in the real world. Students documented their understanding of the real world. Here are some examples:
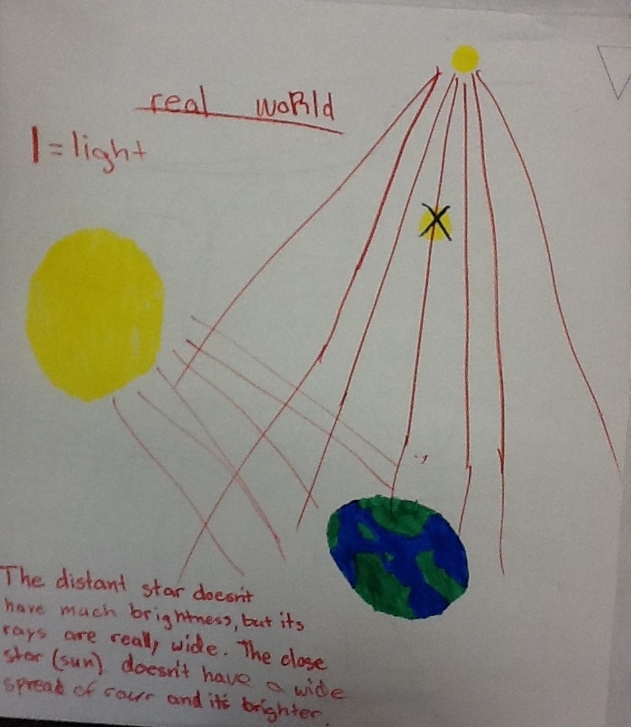
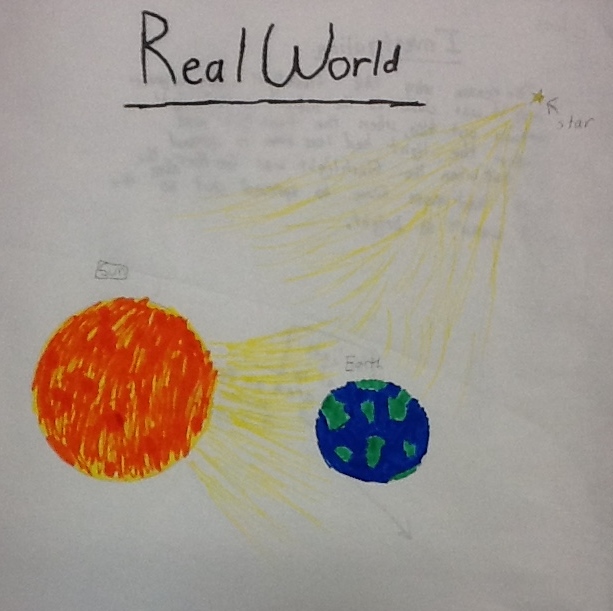
After generating these real-world explanations, we came together again to examine images and brainstorm ideas for making them more accurate. The discussion focused on the question of whether the Sun is actually much bigger than other stars. Students realized that the Sun looks big because it is close, but it is actually not a big star.
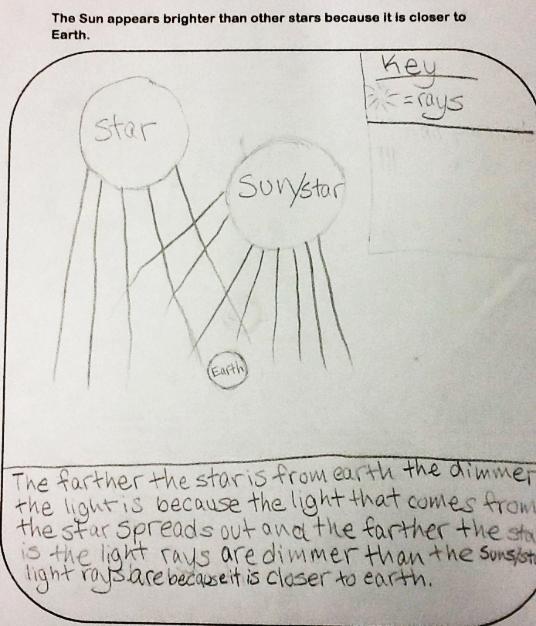 As a final step in the process of understanding why closer stars look brighter, individual students were asked to share their final thoughts about this topic. Students showed varying levels of understanding about the topic, but most demonstrated they understood that the light from a distant object spreads out and therefore appears dimmer than the light from a closer source.
Kathy Gill
Kathy Gill is a science specialist at Willett Elementary School in Davis, California. She guides fourth- and fifth-grade students in exploring and explaining interesting scientific phenomena.
Visit NSTA’s
NGSS@NSTA Hub for hundreds of vetted
classroom resources,
professional learning opportunities,
publications,
ebooks and more; connect with your teacher colleagues on the NGSS listservs (
members can sign up here); and join us for discussions around NGSS at an upcoming conference.
The mission of NSTA is to promote excellence and innovation in science teaching and learning for all.
Future NSTA Conferences
STEM Forum & Expo
2017 Fall Conferences
National Conference
Follow NSTA