
Feature
Oil Spill eSTEMation
Using Mathematical Estimation and Modelling to Rescue our Oceans
CONTENT AREA Mathematical Modelling Biodiversity and Humans
GRADE LEVEL 6–8
BIG IDEA/UNIT STEM activity integrates mathematics in a way that extends beyond using computations.
ESSENTIAL PRE-EXISTING KNOWLEDGE Area and volume measurements
TIME REQUIRED Estimated 5 to 8 days, 45–50 minutes per day. Adjust timing for class needs.
COST Minimal overall cost is ~$10–$25. Set of 100, 3 ml droppers is ~$5–$8. Aluminum containers is ~$5–$10.
SAFETY Wipe up all water spills immediately. Oil is slippery and care must be taken to ensure it does not spill.
To meaningfully integrate mathematics with other disciplines (National Council of Supervisors of Mathematics [NCSM] and National Council of Teachers of Mathematics [NCTM] 2018; Walker 2017), we present an integrated STEM unit incorporating science and engineering concepts through mathematical modelling as a basis for estimation in the context of oil spills. By mathematical modelling, we mean using mathematics to represent and infer solutions to real-world situations (Blum 2002). Estimation involves reasoning quantitatively to find a value close enough to an actual but unattainable value. Specifically, the unit engages students in estimating the relationship between an oil spill’s volume and the area it covers by building on students’ understanding of area and volume calculation. This unit was enacted with a group of teachers in a virtual professional development (PD) format. We explore the activities involved in this unit, including insights from teachers in the PD who experienced this unit firsthand as students would.
Unit description
In the following sections, we present activities involved in this STEM unit. These activities could take five to eight days, 45–50 minutes per day, with minimal cost (~$10–$25). The teacher can adjust the length of each section to accommodate students’ learning pace.
Engage: Present the phenomenon and build empathy toward the environment
Empathy is “the ability to be aware of, understanding of, and sensitive to another person’s feelings and thoughts without having had the same experience” (Battarbee, Fulton Suri, and Gibbs Howard 2014, p. 2). Building empathy encourages students to relate to contexts and situations they will attempt to solve (Sun 2017). One recommendation to build empathy is to start STEM units by establishing relevance (Fila and Hess 2016).
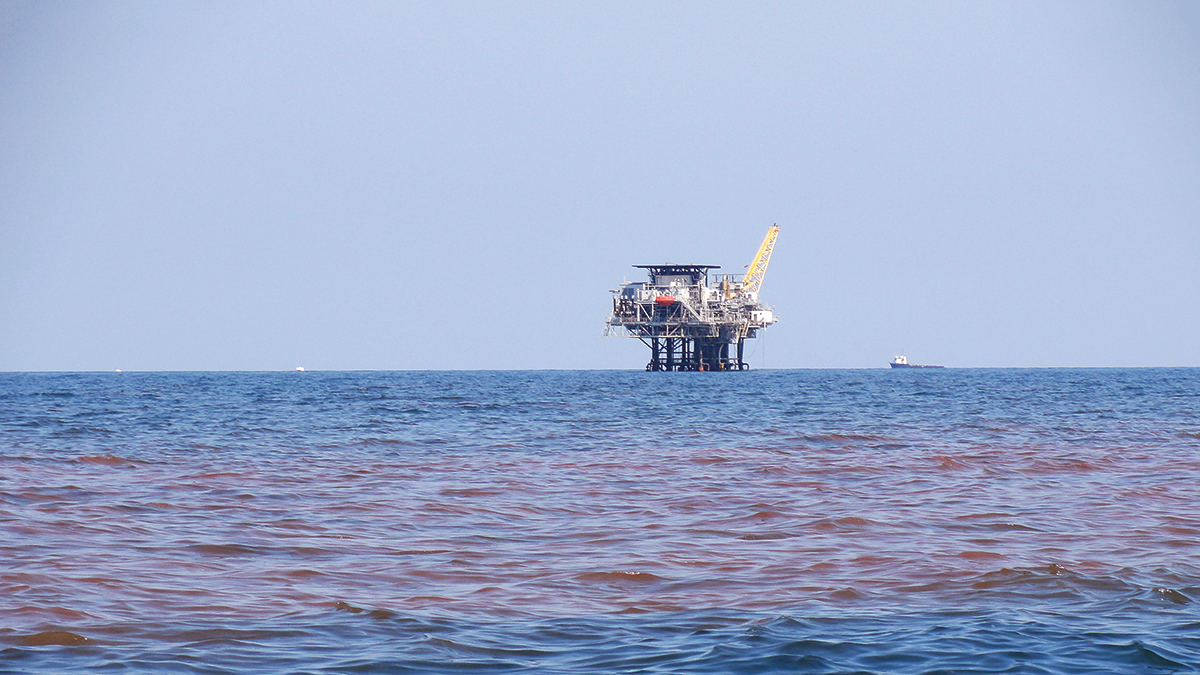
To establish relevance and empathy and to generate passion for protecting the environment, the teacher presents the phenomenon of oil spills using videos of the Deepwater Horizon disaster (BP incident) and its impact. The BP incident began on April 2010 where millions of barrels of oil spilled into the Gulf of Mexico due to an explosion of the oil well drilling platform (National Oceanic and Atmospheric Association [NOAA], Office of Response and Restoration [OR&R] 2020). The teacher shows a satellite or color map image of the spill (see Figure 1) and discusses the environmental impacts of the event. For example, marine mammals, shoreline species, and marine habitats were critically damaged by the BP spill. The teacher then asks students to consider a local body of water and how the city strives to keep it clear of oil. If students do not live along a coastal area, the teacher can ask students to share a beach city/town vacation destination they visited or would like to visit (e.g., Miami, Honolulu, etc.) and to describe what could happen if an oil spill occurred there. This discussion can help students recognize the negative impact of increased human activities on the environment.
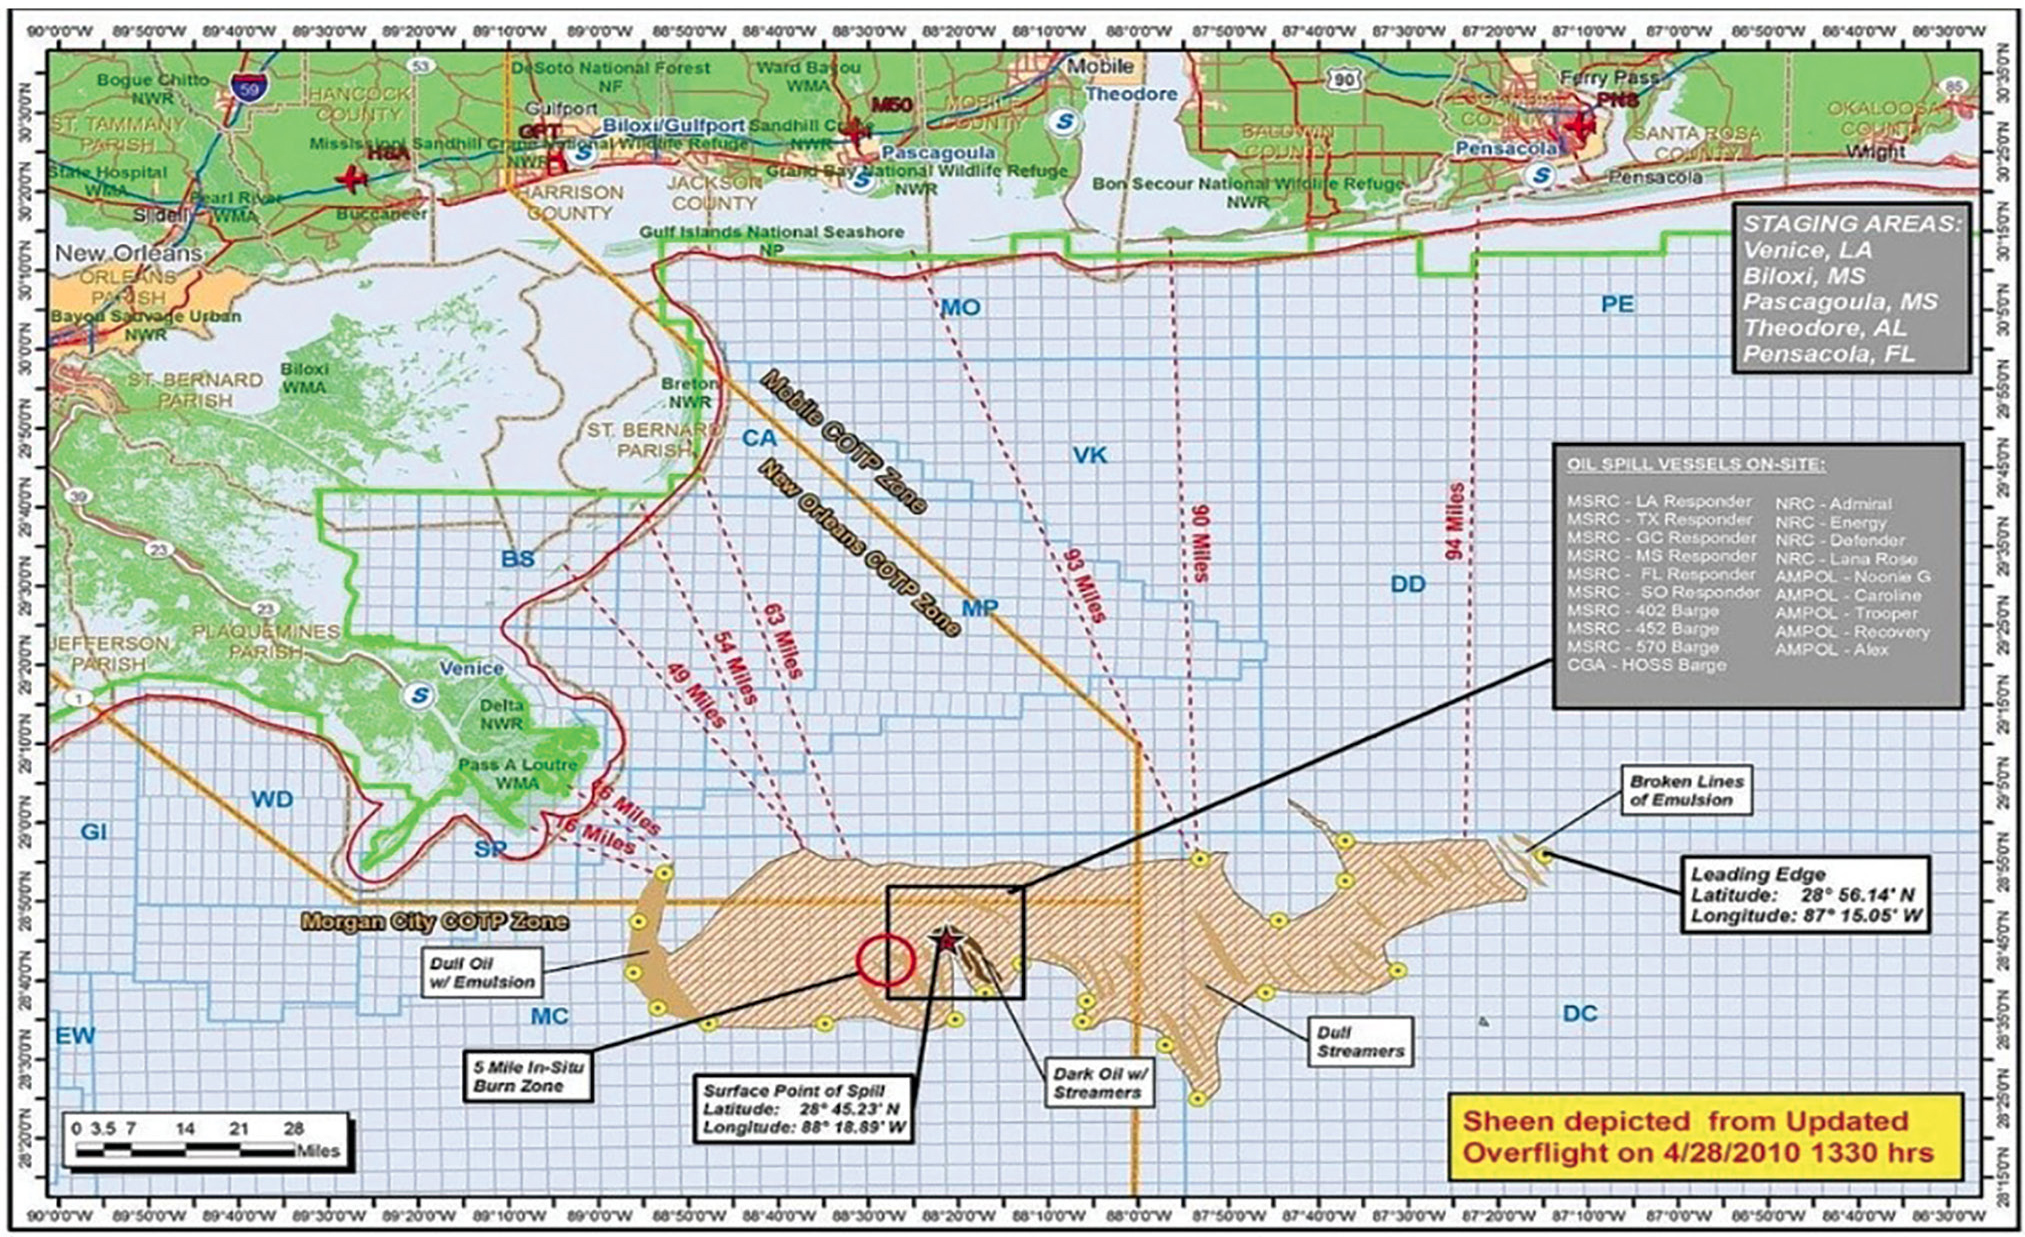
Color map image of the BP spill. Map shows location and extent of the Deepwater Horizon oil spill in the Gulf of Mexico. Star indicates location of broken wellhead.
Students should generate a list of driving questions for oil-spill phenomenon. An anticipated question would be about how to clean an oil spill. The teacher can redirect students to consider different elements that must be known in order to clean such a spill (e.g., type of oil, spilled amount, etc.). For example, the amount of spilled oil is an important element to assess using images of existing spills (e.g., the image in Figure 1). To determine the amount of spilled oil, students may suggest calculating the area the spill covers and multiplying by oil thickness to calculate the volume. The teacher can assist students in identifying the challenge of knowing the area and thickness of a spill, such as asking about the spill’s shape. Asking students “What do you call the shape of this spill?” or “What formula would you use to calculate the spill’s area?” would help students assert that the spill’s shape is irregular and hence its area cannot be computed using a known formula. In addition, the oil’s thickness is not uniform throughout the spill. To guide students in recognizing that the oil’s thickness is not uniform, the teacher can suggest inspecting classifications presented on the oil spill in Figure 1 (e.g., dark oil, emulsion, etc.) and discuss or research the meaning of those classifications. Pointing out those classifications and asking students to research what they mean would help students recognize that the different parts of the same spill have different thicknesses. NOAA (2016, p. 12) uses different terms to describe oil-spread stages depending on its thickness. For example, sheen is oil spread to less than 0.001 millimeter in thickness, while dark oil is 0.1 to 1 millimeter thick (see Figure 2).
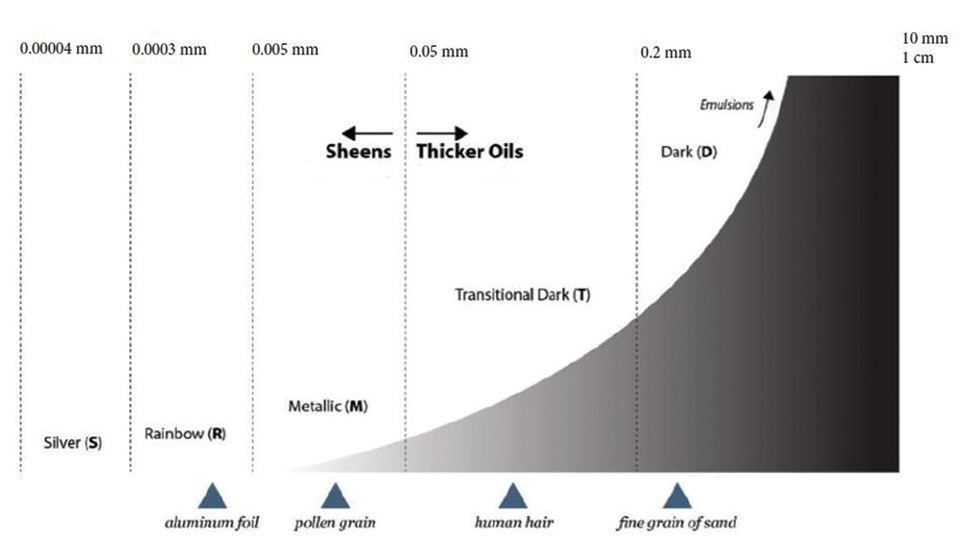
Scale of spilled oil thickness values (scale modified from NOAA 2016).
The previous discussion can be situated such that students are encouraged to define the challenge at hand. For example, the teacher can circle back to the spilled amount as an element that must be assessed to clean the spill, with prompts such as “What would you suggest doing to estimate the volume using the image in Figure 1?” Students are anticipated to suggest calculating the volume by multiplying the spill area and the depth of the oil. In this case, the teacher can refer to the previous discussion about the oil thickness and Figure 2 to ask, “What about the irregularity in the thickness in different areas of the spill?” The purpose of this discussion is to direct the conversation so that students conclude the spill’s volume cannot be easily determined by calculating the visible spill area and multiplying by the oil’s thickness.
Explore: Narrate a mathematical modelling scenario
Once students are aware the spill is an irregular shape and its thickness is not uniform, the teacher can explain how environmental engineers may estimate the amount of spilled oil despite its irregular shape and nonuniform thickness. Specifically, environmental engineers utilize test tanks to model spills. A test tank is an artificial environment for researching and testing oil-spill response under controlled conditions (e.g., water temperature, oil types, wave patterns, etc.). For example, the Oil and Hazardous Materials Simulated Environmental Test Tank (referred to as Ohmsett) in Leonardo, New Jersey, is designed to simulate open-ocean conditions (see Online Resources). Scientists spill different, known amounts of oil in the tank and calculate the area it covers, collect multiple data-points of different spilled volumes and associated areas given certain conditions, and create a mathematical model of the relationship between the amount of spill and the area the spill covers.
Similarly, the teacher can show a picture of an oil spill where the volume is known to the teacher but not to students. The picture of the spill can be prepared beforehand by spilling a measured amount of olive oil in a container of water. Any cooking oil can be used, but we recommend olive oil because it is pigmented (do not use machine or motor oil as they can cause hazardous risks). Our approach was to fill an aluminum container with water so that the bottom of the container is completely covered with water. Then a 1-cm grid paper printed on transparency paper was laid inside the container at the bottom of the water. Laying the transparency paper inside the container must be done carefully to prevent the water from washing away the grid markings (see Figure 3). Then 5.6 ml of olive oil was spilled in the water. The spill initially took the shape of a circle, which was teased out by touching the water close to the spill. An overhead picture of the spill was taken after shaking the spill a bit to make it an irregular shape. The teacher can show the image to the class using a projector to discuss what is seen. When projecting the picture of the spill, the teacher can ask students about their approach to estimate the amount that was spilled. If students suggest attempting to estimate the area of the spill and multiplying it by the thickness, the teacher can remind them of the earlier discussion in the Engage section. The teacher can also remind them about how environmental engineers utilize test tanks to create a mathematical model of the spill by spilling different, known amounts of oil in the tank and calculating the area it covers to figure out the relationship between the spilled amount of oil and the area covered by the spill.
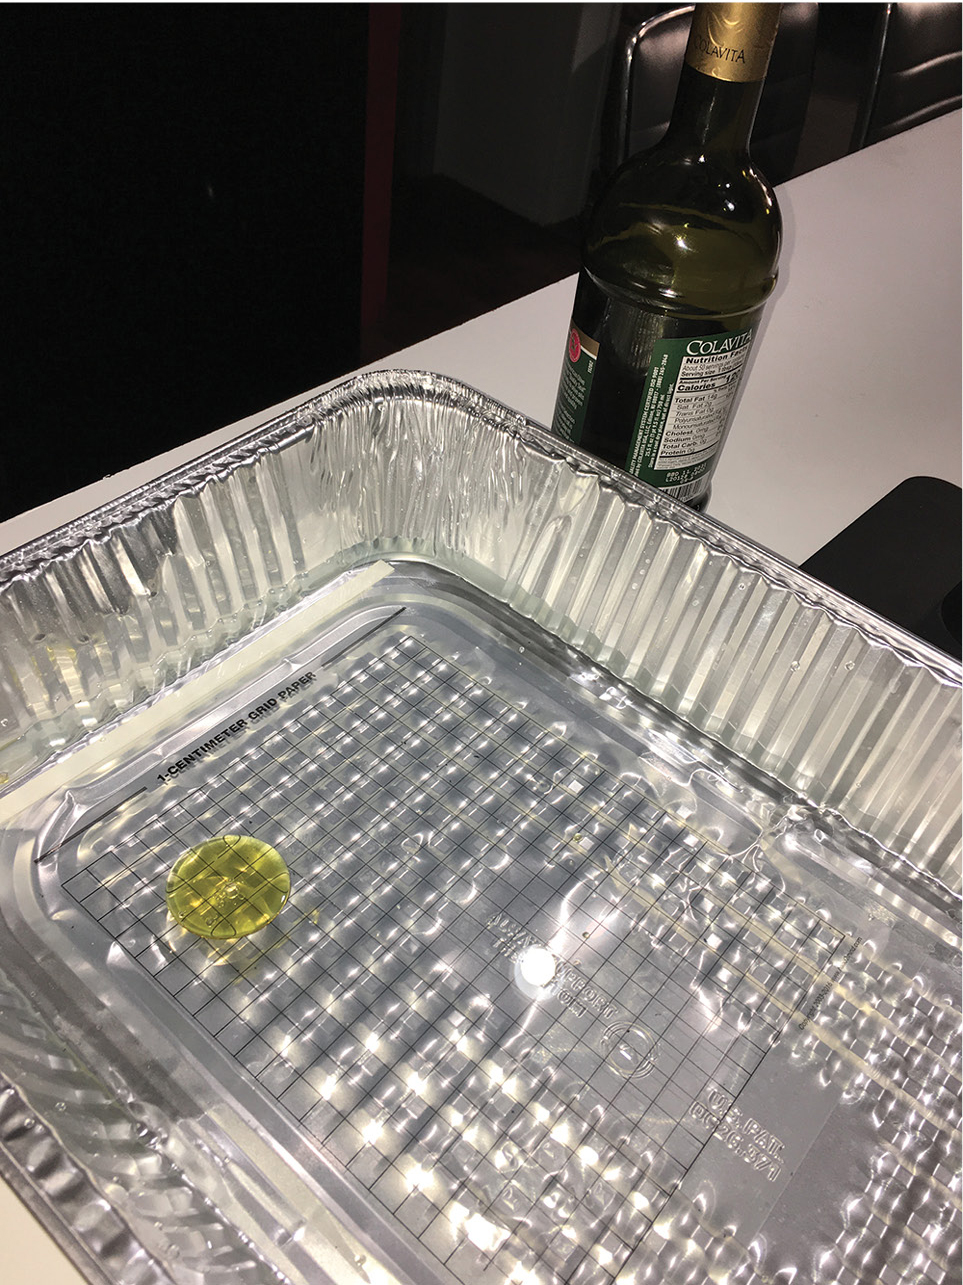
An example of spill preparation.
Students can mimic the process of environmental engineers and create oil spills of different amounts (preferably using the same type of oil used to create the photographed spill for consistency). The materials students need to model the spill are aluminum containers (9 × 12 × 1 inches or larger), a pitcher that students can fill with water from the water fountains at school (the amount of water needed depends on the size of the aluminum containers; the bottom of the container must be filled, but the container should not overflow), 3 ml droppers (another size with volume measurement marks can be used), a container of vegetable oil that can be shared by the whole class (preferably olive oil because it is pigmented), different-size grid paper printed on transparency paper to estimate the area the spill covers, access to Microsoft Excel or Google Sheets, and the instructions handout (see Supplemental Materials). Students will also need paper towels, napkins, or tissue paper to wipe up any water or oil that may spill on the tables.
The teacher demonstrates filling an aluminum container with water, then carefully placing grid paper at the bottom, as placing the grid paper first and then pouring the water can lead to smearing the gridlines on the paper. The teacher can then demonstrate the process of spilling an amount of oil in the water and estimating the area the oil will cover. Using the chart in the instructions handout (see Supplemental Resources), students can record the spilled amount along with the area it covers. Students can then work in pairs, taking turns using a dropper to continue spilling known amounts of oil in the water and estimating the area the spill covers. It is better for students to start by spilling a small amount of oil (such as starting with 1 ml), then estimating the area the spill covers and recording the spilled amount along with the estimated area. Some students may use the formula for the circle’s area, which is an acceptable strategy if the spill is shaped like a circle. If students get an irregularly shaped spill, it is anticipated that they will estimate the area by counting the squares. The teacher must probe the students about their strategy, asking questions such as “How would you know that you calculated the area this way?” and “What would you do about the edge of the spill, which does not cover a full square?” These questions will encourage students to strategize about the way to calculate the spill, either by counting the full squares, using the area formula of a regular shaper or even counting the edges as full squares or half squares. The purpose of this part of the activity is to collect multiple spill volumes and associated areas the spill would cover.
As students continue the process of adding more oil to the previous spill and estimating the area of the combined amount of spilled oil, and so on, they can record their data (the volume of oil and the calculated area) in Excel or Google Sheets. If students do not have access to these, the teacher can ask them to keep their data on the handout, which the teacher then collects and inserts in a graphing platform for the purpose of presenting the model (see the Explain section). Students may be concerned about the accuracy of their calculation. The teacher can remind them that the purpose of estimation is to find a value close enough to the actual value because the exact value cannot be accurately measured, so students’ best effort is acceptable. While students do not have to compare their data, they may notice some discrepancy if the teacher is projecting the data students are collecting.
For example, during the PD, two teachers spilled the same amount of oil yet reported different estimates of the associated area (see Figure 4). After double-checking that the area calculation was done correctly, teachers discussed the drastic difference and how it might be estimation error or—most likely—a result of not controlling some variables (e.g., different oil brand, water temperature, overestimation vs. underestimation etc.). Any inconsistency is an opportunity for students to comprehend the importance of evaluating and revising the experiment and its conditions. Teachers can ensure the occurrence of discrepancy through provision of materials (e.g., different oil brands, water of varying temperatures, etc.) and requiring different students to spill at least one similar amount. The discrepancy would initiate a discussion of possible reasons for the difference. This can also be a time for discussing overestimation and underestimation, and which one is appropriate in an oil-spill situation. Completing this exploration may require multiple days, especially if there is room for discrepancy during the data collection, leading to revising the data-collection process to ensure consistency in the process (where everyone agrees to using similar strategy to calculate the area).
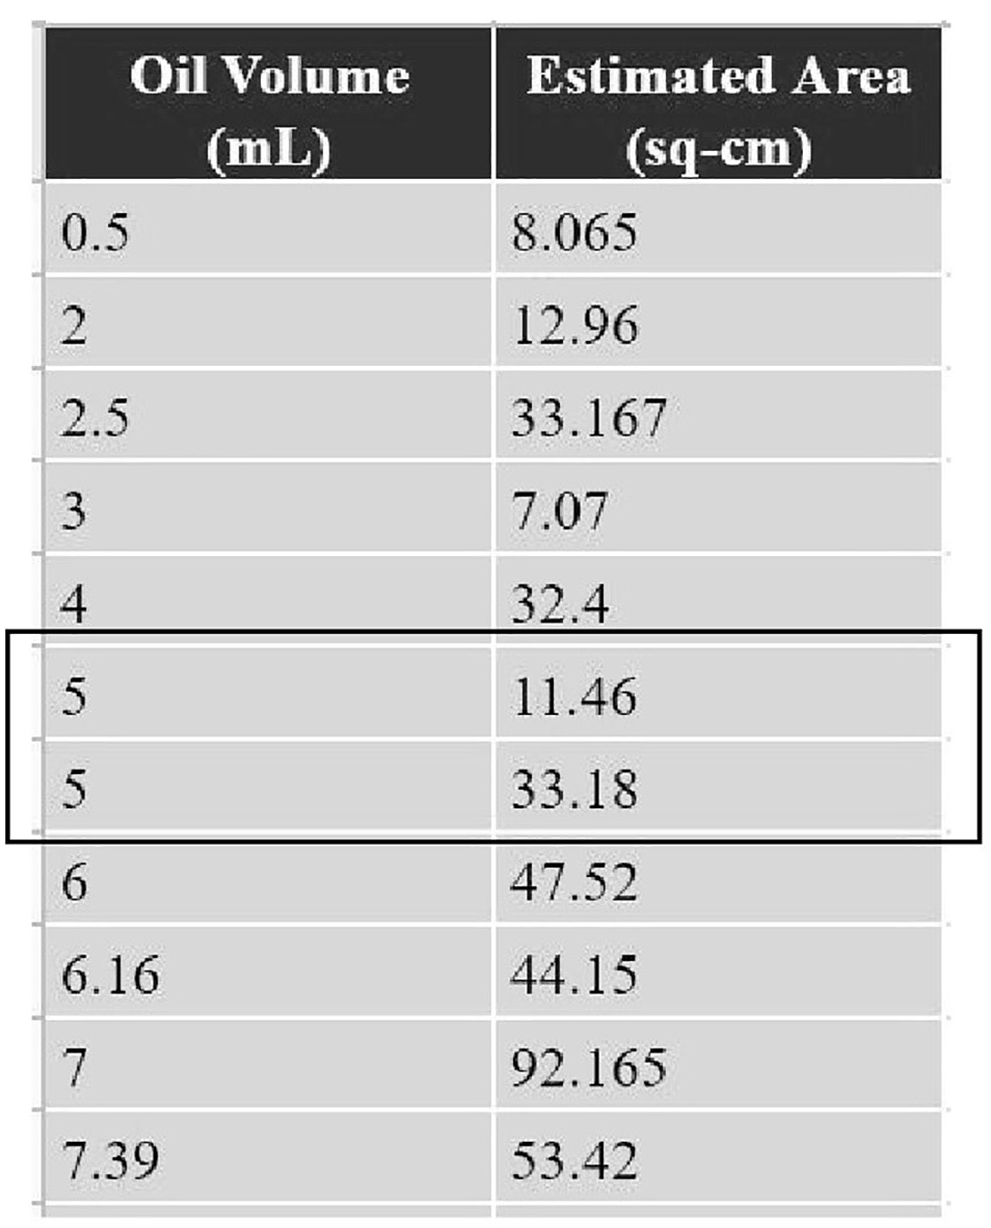
Sample of data generated by teachers during a virtual PD session.
Explain: Modelling the spills and using technology
Making general assumptions and predictions is an objective of mathematical modelling. The teacher can ask students (while they collect data) to predict the relationship between the oil’s volume and the area it covers. Students may notice that the area of spilled oil increases as they increase the volume of spilled oil. The teacher can ask students to predict a possible graphical pattern for plotting the data and scaffold the conclusion that the data would form an increasing line. The teacher can refer to the general linear equation y = mx + b, where x and y are assigned variables, m is the slope, and b is the y-intercept, and scaffold more predictions, specifically, that the value of b represents the area that is covered when no oil is spilled, which in this case would make b equal to zero. With this prediction, the model’s equation is reduced to y = mx, which is the common model of proportional relationships, where m is considered the proportional scale or factor. Specifically, depending on its value, m is the constant by which one variable (y) increases or decreases in relation to the other (x). Hence another prediction students can make is that m would be positive, since the proportional relationship is increasing.
To graph the data, students can manually plot the collected data points. However, the data is based on estimations, with room for error and uncertainty, and consequently would not form a straight line. Therefore, it would be beneficial to find the line of best fit by utilizing technology. The line of best fit is a visual representation of the relationship between the volume of the spill and the area it covers (see Figure 5; see also video “Oil Spill eSTEMation” in Online Resources). Students (or the teacher) can use Excel (or Google Sheets) to create a scatterplot of the different volumes of spilled oil, along with associated areas collected by the whole class. Along with the scatterplot, the line of best fit would be the average of the collected data.
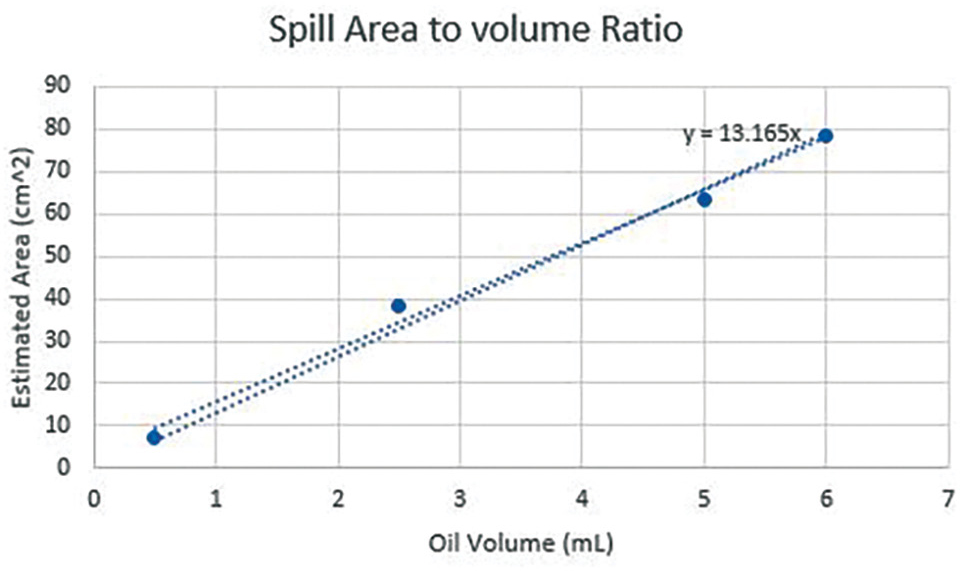
Example of a model of a proportional relationship between the spill’s volume and the area it covers (see video in Online Resources).
The equation of the line of best fit represents the mathematical model of the proportional relationship between the amount of spilled oil and the area it covers. Because the relationship between these variables is proportional, the slope of the linear equation would be the proportional factor. In addition, the line would go through the origin because the area that is covered by oil when no oil is spilled equals zero.
Evaluate: How much oil was spilled?
In previous sections, we shared some probing examples that could serve as formative assessment to gauge students’ understanding throughout the unit. However, once the model is established, students can use the equation of the line of best fit to estimate the area that would be covered by a known amount of spill or calculate the area of an existing spill—and estimate the amount of spilled oil. The teacher can assess students’ understanding of the model by asking them to estimate the area covered by a given amount (e.g., 5,000 ml) of spilled oil or the amount of an existing spill given the area (e.g., 144 cm2) it covers (other assessment items are included in the instructions handout; see Supplemental Materials).
Because the purpose of creating the model is to estimate the amount of oil spilled in the challenge picture, students need to calculate the area of the spill in the image first. Students may initially focus on attempting to divide the irregular shape into different regular shapes and use known formulas to calculate the area. However, one challenge of this approach is estimating area around the curves or the edges of the spill. The teacher can encourage students to consider other possible approaches, such as using grid paper of different sizes (see Figure 6). While counting the squares in the initial 1 cm grid paper might be an initial approach to estimating the area, using grid paper of different sizes aims to ascertain that the parts of the spill that are not covered by a complete square could be estimated better with a smaller grid.
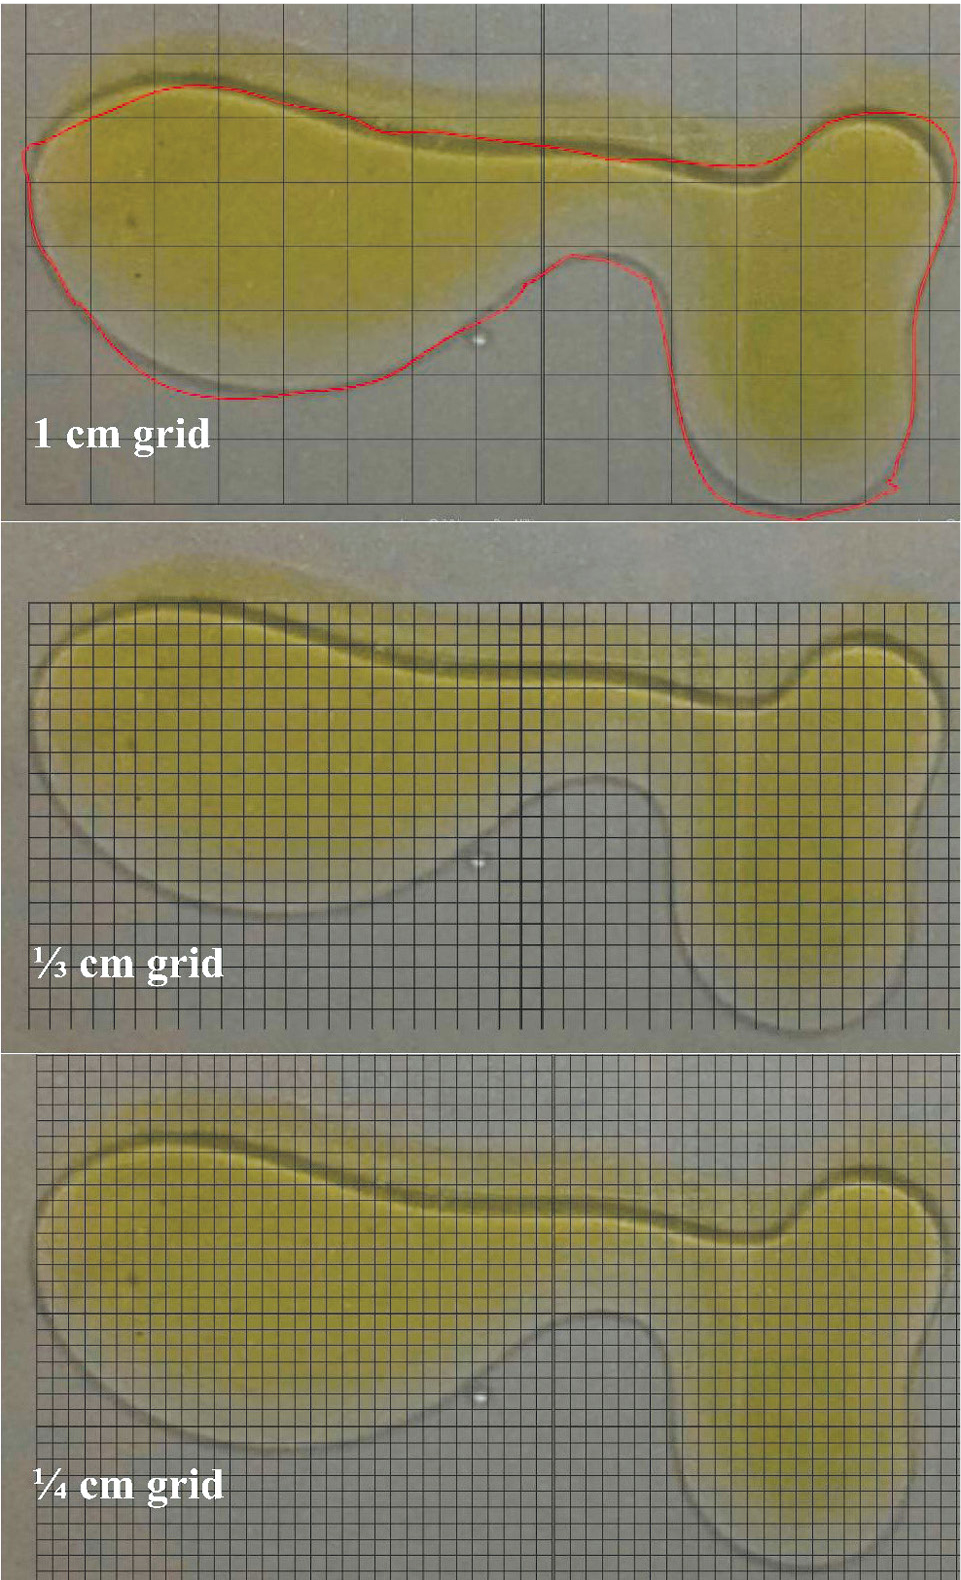
Different grid sizes overlaid on the spill to estimate the area of an oil spill.
Using the combination of the estimated area and the model, students can calculate the volume of the given spill. The teacher can then reveal the actual amount of oil spilled in the picture and discuss how the estimated volume relates to the actual amount. Whether the estimate is close or not, students can discuss possible reasons for the difference between the estimate and the actual value.
Extend: Science extensions
The activities described thus far highlight a mathematics-focused opportunity in the context of oil spills with a career connection to environmental engineering. In addition to discussing how oil spills negatively impact the environment, a science extension could have students use landings data from NOAA (see Online Resources). Landings data are reports of all fish and marine species (measured by total weight or number) that are commercially or recreationally harvested. These reports can be filtered by specific species and years to see the amount of that species that was harvested and sold during a particular year. By examining the data, students can determine the survival rate of marine species in the Gulf of Mexico during the BP spill (e.g., shrimp) and its effect on the commercial harvest. For example, running the report for the state of Louisiana between the years 2009 to 2011 (the year of the BP incident, along with a year before and a year after) can be a way to explore how the number of pink shrimp have changed throughout those years. Students can change the parameters of the report to investigate the impact on other shrimp types (e.g., white shrimp) in other states that were in the vicinity of the spill.
Students can also research the effects of oil spills on wetlands and their ecosystem. For example, when the BP spill occurred, many countermeasures were used (e.g., floating booms, chemical dispersants). Parts of the spill were treated with chemical dispersants to speed oil’s biodegradation (Kujawinski et al. 2011). Although using chemical dispersants can cause harm to coastal ecosystems (Almeda, Cosgrove, and Buskey 2018) and to responders (Konkel 2018), at the time the benefit of using dispersants outweighed possible harm (Reddy and Arey 2017). Such information can provide awareness of weighing the costs and benefits of any cleanup approach.
Conclusion
Integrating math with other disciplines in a meaningful way can be challenging (NCSM and NCTM 2018; Walker 2017). We have presented an adaptation of a well-known lesson about oil spills (e.g., Czerniak, Schneider, and Sterling 1996; Hampton 1993; Robeck 2011). Our adaptation aimed to build students’ knowledge and 21st-century skills by emphasizing mathematical modelling and estimation of oil spills while incorporating relevant science.
Online Resources
Video: Oil Spill eSTEMation—https://youtu.be/_dpLLoZzW7Y
NOAA Fisheries landings data—https://www.fisheries.noaa.gov/foss
Ohmsett—https://www.ohmsett.com/gazette/OhmsettGazetteFall2001.pdf
Connecting to the Next Generation Science Standards—https://www.nsta.org/online-connections-science-scope
Supplemental Materials
Connecting to the Next Generation of Science Standards
Hanan Alyami (alyamih@purdue.edu) is a graduate assistant in the Department of Mathematics Education and Paul Asunda is an assistant professor in the Department of Technology Leadership and Innovation, both in the Department of Curriculum and Instruction at Purdue University in West Lafayette, Indiana.
5E Environmental Science Lesson Plans Mathematics Science and Engineering Practices STEM Teacher Preparation Teaching Strategies Middle School