
feature
Ectotherm ER: Frogs Under the Weather
Connecting Amphibian Decline to Climate Change
Science Scope—March/April 2021 (Volume 44, Issue 4)
By Rebecca Gonda, Michel Ohmer, Laura Brannelly, Jennifer Kassimer, Stephanie Kubik, Alison Slinskey Legg, and Corinne Richards-Zawacki
CONTENT AREA Life Science
GRADE LEVEL 7–8
BIG IDEA/UNIT Environment and evolution
ESSENTIAL PRE-EXISTING KNOWLEDGE Graphing, some knowledge of adaptations may be helpful
TIME REQUIRED 4–5 40-minute class periods
COST <$75 initial investment
SAFETY Eye protection (indirectly vented chemical splash goggles), vinyl gloves, and non-latex aprons for set-up, hands-on, and take down components of this activity.
Materials list
|
Suggested product |
Price |
Amount per class |
|
Silicon frog mold |
~$11 (8 frogs/mold) |
4 frogs/group of 3-4 students |
|
Agar powder |
~$12 (142 g) |
6 g (1 tablespoon) |
|
Green and brown pigment |
~$8 and $4 (100 g each pigment) |
3 g (~1 teaspoon) pigment mix* |
|
Infrared temperature gun |
~$5 each |
~4–5 per class |
*Green/brown pigments are premixed in equal proportions before making frogs, to give them a natural color.
Notes:
- A microwave and microwave-safe measuring cup are needed to prepare the agar frogs.
- If infrared temperature guns are cost prohibitive, alcohol thermometers could be inserted into the frogs, but it might be somewhat challenging to measure slight changes in temperature.
- The consumables should last teachers more than 20 usages with the initial investment of $75 or less.
- The researchers also use iButton temperature sensors to measure agar frog temperatures over a 24-hour time period (data uploaded via iButton reader). Schools may choose to do this; however, they are more expensive and must be used in larger frog molds. Lab iButton data are provided should teachers choose to analyze the data over the longer time period.
Scientists have observed a rapid decline in amphibians worldwide due in part to changing climates and the spread of disease. This stunning decline has caught the attention of students and educators alike due to increased news coverage as scientists have linked the decline in frog populations to a fungal infection and changing environmental conditions (see Scheele et al. 2019 article in Science). Students can be at the forefront of the research into amphibian declines in changing climates through citizen science inquiry-driven curriculum. Students in grades 6–9 particularly thrive when presented with a unique opportunity to act as citizen scientists who are helping to investigate authentic problems of the natural world (Jenkins 2011).
The Ectotherm ER module is designed to actively engage students in the real-world problem of amphibian declines. This module allows students to explore the relationship between temperature and frog population health through analysis of student-collected data, data from the Richards-Zawacki lab at the University of Pittsburgh, and news articles that report how rapidly changing environments have a drastic effect on the health of species. We designed this module to engage students in an inquiry-driven investigation whereby they directly help scientists collect data on how exposure to different environments can affect amphibian body temperatures and relate the data to an important and timely global phenomenon—the decline of amphibian populations worldwide.
Amphibians are ectothermic animals that are particularly susceptible to fluctuations in temperature. As the climate becomes more unpredictable, amphibians might become more susceptible to pathogens, and scientists are using both physical and mathematical models to make predictions about how a changing climate will affect them. This empowers students to understand that science will help solve problems that threaten the planet.
We utilize a guided worksheet to help students outline the problem and main question, define the independent and dependent variables, and develop a hypothesis as they plan their experiment (see Student Worksheets in Supplemental Materials). Then, students go on to test their hypothesis using physical models of frogs made from agar and place them in the “environment” around their school. Agar models are an accurate way to approximate the operative temperature of an amphibian, or the body temperature of an amphibian in a certain time and place (see Navas and Araujo 2000 article in Journal of Herpetology) and are commonly used by scientists in the field. Students compare the data they gathered on frog temperatures under different environmental conditions to frog performance (i.e., jumping ability), and pathogen growth rate, at different temperatures. Finally, we link the concepts learned during the module with the current amphibian decline crisis in the news to introduce students to how frog body temperatures might impact the frog’s health in the face of pathogens and climate change. The timeline of the module is detailed in Table 1.
Engage
Our students serve as citizen scientists. They are called to action and introduced to background through a short video on the Ectotherm ER website (“Ectotherm ER: Frogs Under the Weather Background Video”; see Online Resources) from a researcher in the field of ecology and amphibian conservation that introduces key concepts required in middle-level learning on ecology. With the video, we first ask students to brainstorm how an amphibian’s environment might affect its ability to perform important life functions (e.g., finding food, escaping predators, growth, reproduction, etc.). Then we ask students to investigate how the environment, specifically the microhabitats that an amphibian uses, may change their body temperature. We challenge the students to brainstorm how to test this, guiding them by saying that the habitat will be the school grounds, they can use a temperature gun or iButton temperature sensors to measure temperature in different microhabitats, and we can’t use actual live frogs. They should work with their group of three to four students to pick two microhabitats in a designated location near their school: one in the sun and one in the shade. After receiving those instructions in the classroom, the groups head out to the designated area and search for their ideal sun and shade spots. This will allow them to monitor the temperature of frogs in different microhabitats over time and elucidate how changing temperatures could affect amphibians’ performance and response to disease.
Explore
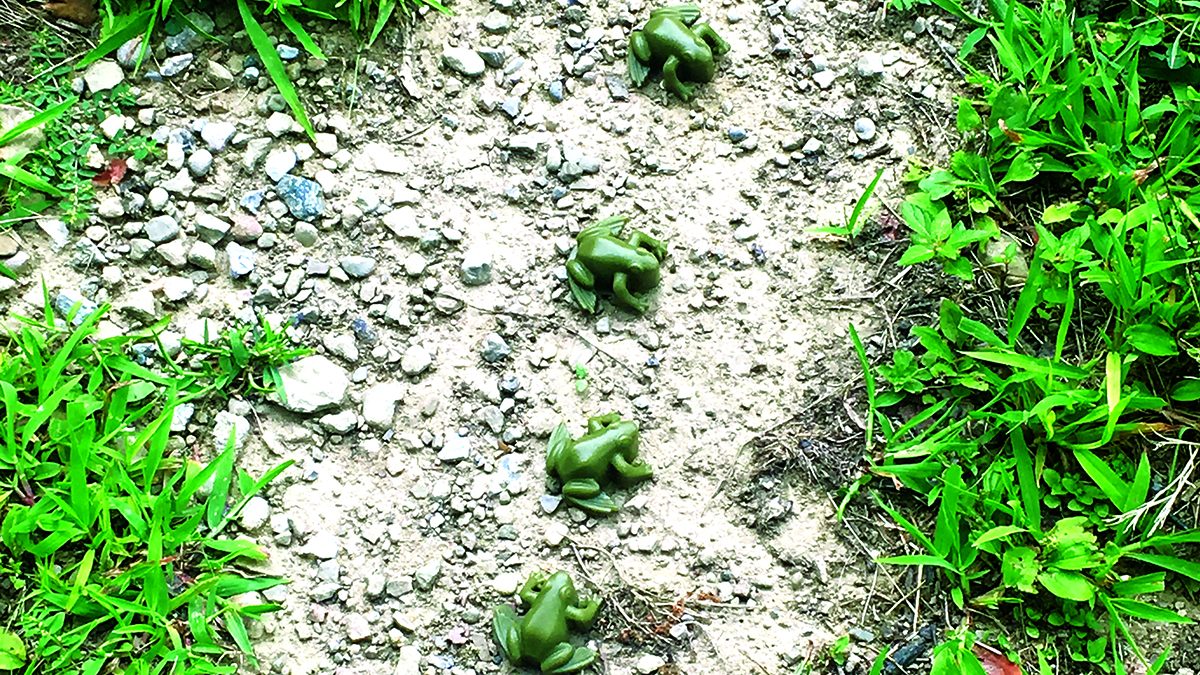
To address the question of how environmental variation might affect amphibians, students use model agar frogs to test how different environments affect their body temperature (see Figure 1A; also the Agar Frog Protocol in Supplemental Materials for information on how to create the model frogs). Briefly, 6 g of agar and 3 g of pigment are mixed with 200 ml of water and microwaved until melted. This is then poured in silicon frog molds (available for purchase to be used to make chocolate frogs) and solidified at room temperature. Teachers have the option of either creating the frog models ahead of time or in the classroom with the students (see Materials List below). Once students obtain their agar frogs, they take initial mass and length measurements prior to placing them outside. The water content, color, and size of the agar frogs mimic live frogs, so the temperature change observed in the models approximates what a frog would experience in nature (see Navas and Araujo 2000 article in Journal of Herpetology). In one class period, students can place model frogs in sun or shade microhabitats and record their temperature every few minutes using infrared temperature guns (see Figure 1B). Alternatively, classes can utilize larger frog molds fitted with temperature sensor iButtons embedded within the agar frogs to record the hourly internal temperature of the frog over a 24-hour period (see Figure 1C), although these may be a bit more cost-prohibitive than using temperature guns. Frogs that do not contain iButtons can be reused between class periods. Teachers will review standard school operating procedure for outdoor activity (see NSTA field trip safety document in Online Resources).
| Table 1. Module timeline and breakdown of materials needed daily. | ||||||||||||||||||
|---|---|---|---|---|---|---|---|---|---|---|---|---|---|---|---|---|---|---|
|
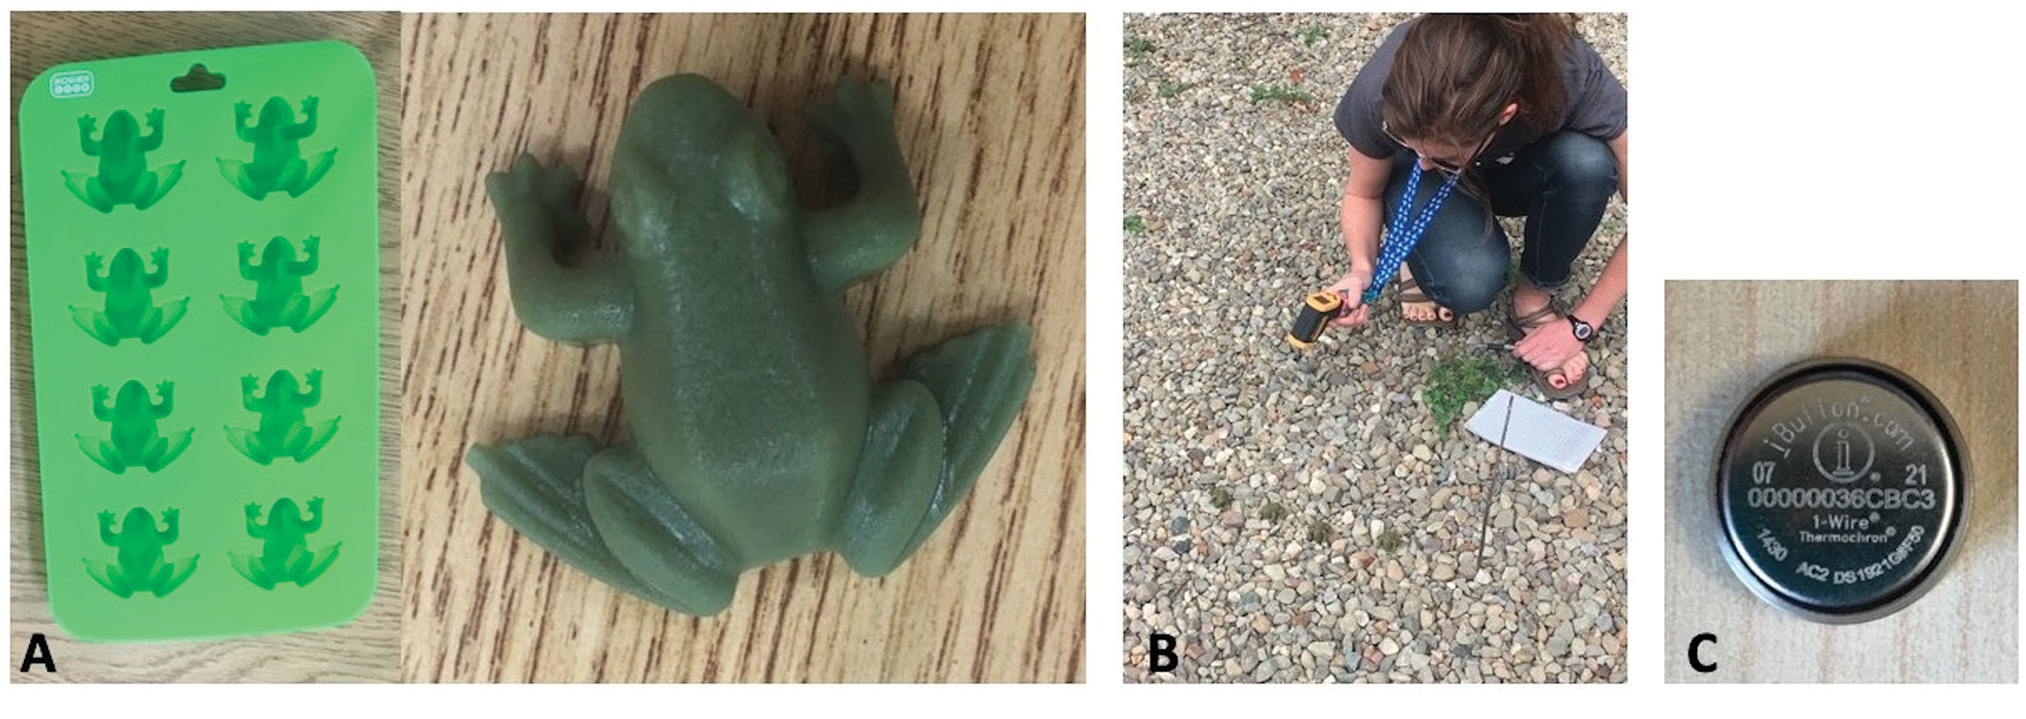
Agar model frogs (A) used to record temperature via infrared (B) or iButton (C) temperature sensors.
After collecting the temperature data, students can remeasure and weigh their frogs and note any substantial differences. They can also discuss why frogs in the sun microhabitats may lose more mass than frogs in the shade microhabitat. The loss of water from hot conditions mimics what would happen in ectotherms, and that can allow them to connect one way that live frogs are impacted in hot climates. Then students plot the instances of each temperature measurement in a histogram for each of the sun and the shade frogs (see Figure 2 for an example student histogram). To create the histogram by hand, students first mark each temperature reading that they collected on the Histogram Tally Chart (see Supplemental Materials). This chart lists ranges of temperature that will correspond to bins of data for the histogram. For example, a tally mark would be added to the chart in the 20–22°C box every time a temperature reading was within that temperature range. Once all of the temperature readings are recorded on the Histogram Tally Chart, students use those totals to draw a histogram on graph paper. To continue the example, if the 20–22°C box on the Histogram Tally Chart had three tally marks, the student would draw a bar on the histogram that was three boxes tall. This allows students to easily visualize the distribution of temperatures agar models experience in the sun and the shade. It may not be surprising to students that their hypothesis is often supported: frogs in the sun will usually experience higher temperatures than frogs in the shade. However, this reinforces that in science we have to collect data to support or refute a hypothesis. The deeper inquiry happens when students use their data to graph and analyze how the threat of climate change might impact frog species. To illustrate this, performance curves are introduced. A performance curve is a graph that tracks the number of times a behavior that is normally displayed by an organism occurs (see Figure 3A). Performance curves are used by scientists to gauge the health of an organism. When studying frogs, scientist track the number of times the frog jumps and the distance of the jump as a measure of health. Sick frogs cannot jump as far as healthy frogs. Students are provided a general frog performance curve that displays distance jumped at different temperatures.
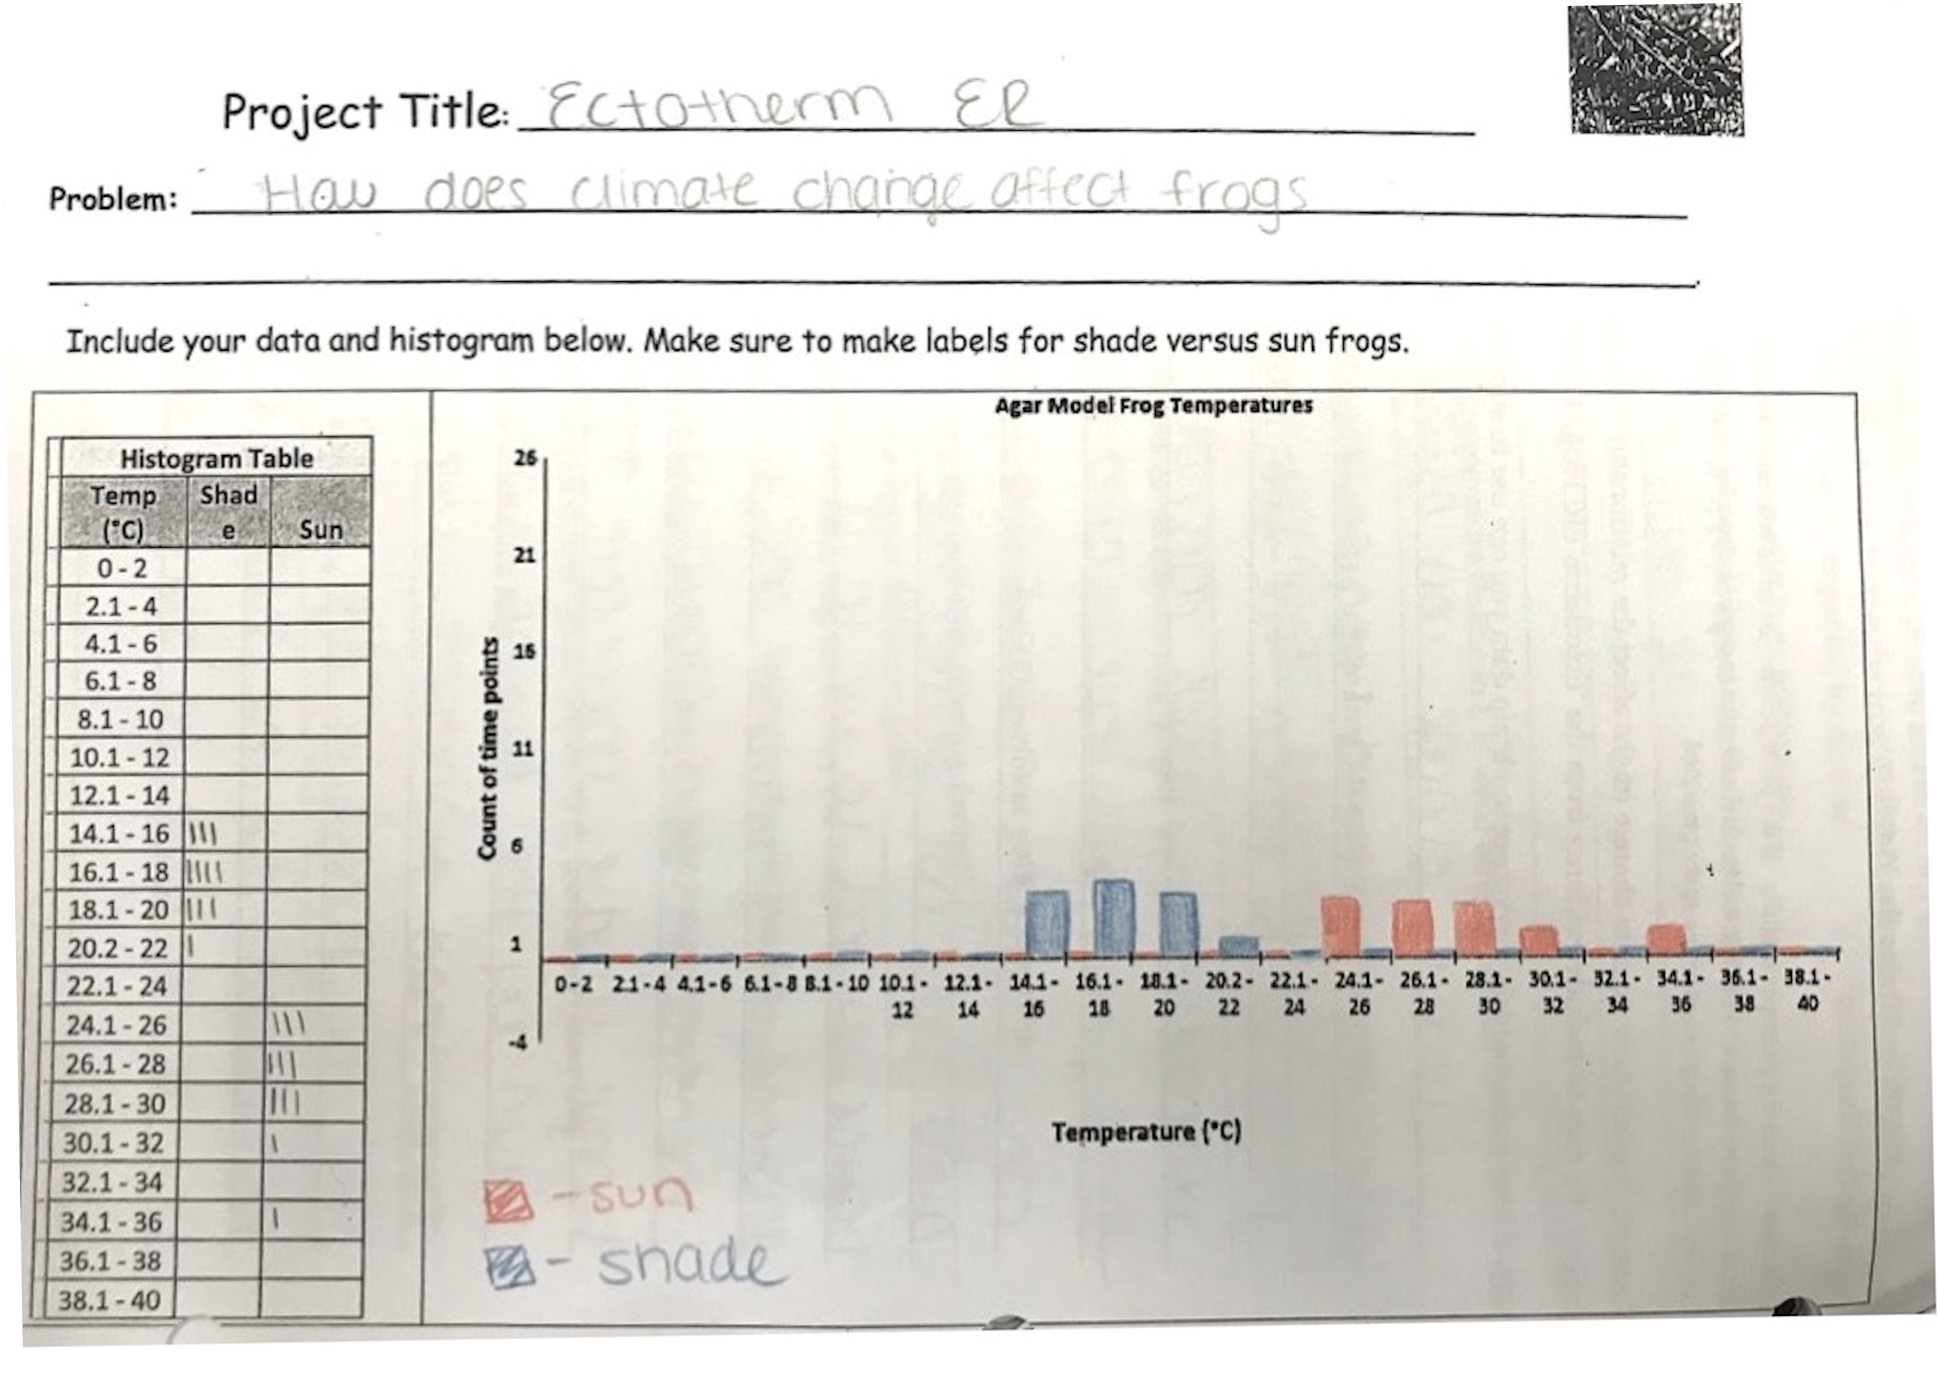
Student histogram
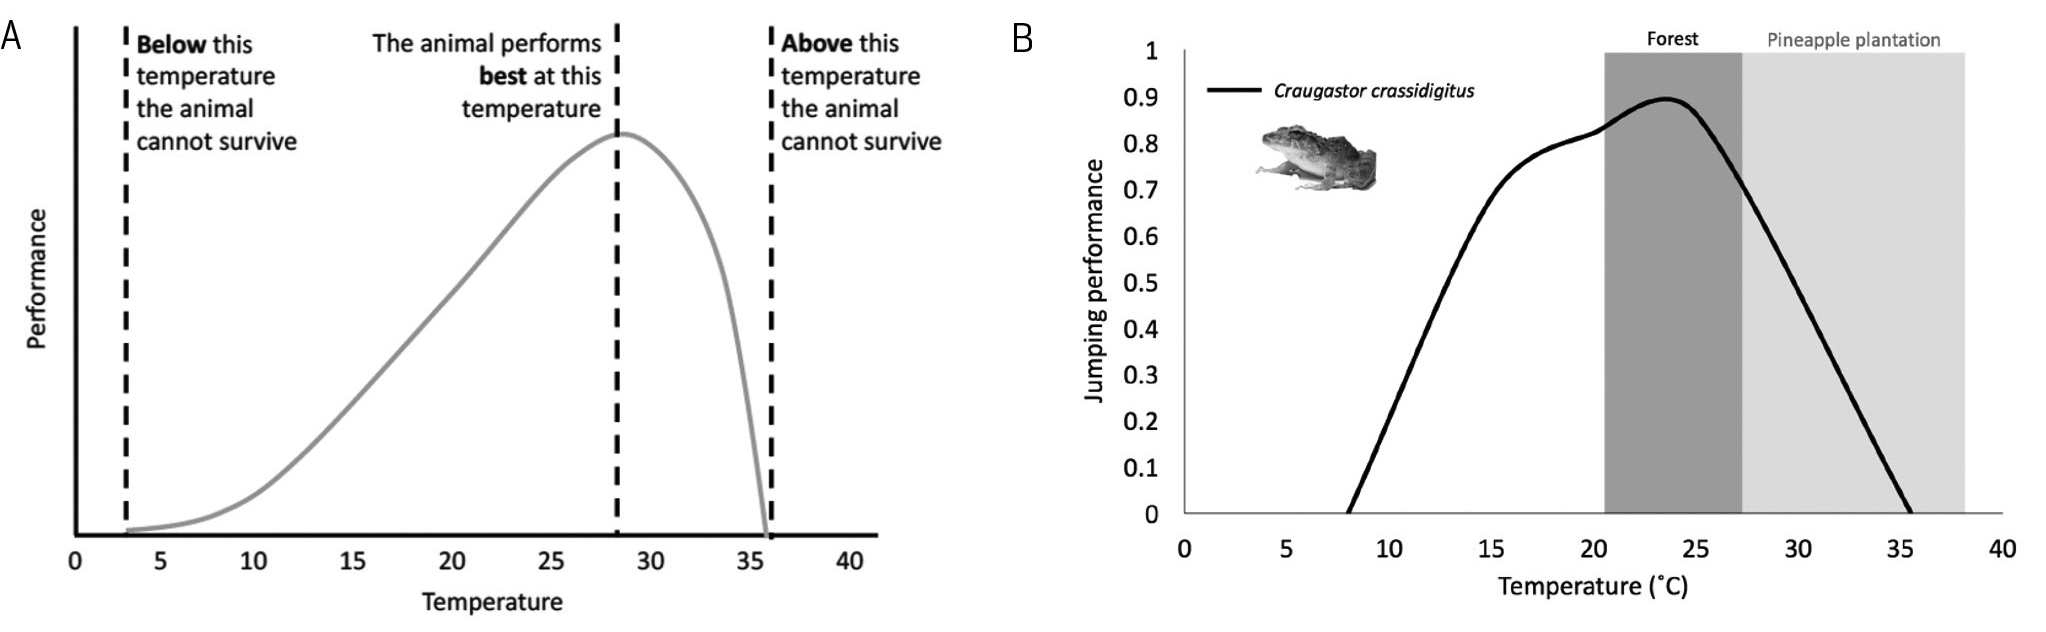
Performance curve (A) and graph displaying the performance of a specific frog species with the temperature of different habitats shaded to infer where that frog may thrive (B).
Explain
Using their histograms of different temperature ranges experienced by the sun frog model versus the shade frog model from the Explore stage, students begin to explain how habitat affects a frog’s performance. A standard method used by scientists to assess how an organism’s performance changes under varying temperature conditions is by using thermal performance curves. An example of a thermal performance curve is when scientists plot the relationship between how far a frog can jump (a measure of physiological performance) and air temperature to assess ideal conditions for performance for that frog species in, say, escaping predators. Each frog species behaves according to the environment to which it has adapted (see Figure 4), and students should consider that frogs living in a more temperate area can adapt to larger shifts in temperature than a frog species from tropical environments. To analyze their histogram data, the students overlay a temperate frog’s performance curve printed on a transparency that can be set on top of their histogram and determine which microhabitat provides more suitable conditions for frog performance. To support their explanations, students should recall what life processes might be affected if frogs spend large amounts of time at temperatures that result in low physiological performance. To do this, students are directed to think about what a frog has to accomplish to remain alive and healthy. If temperatures decrease their ability to jump and move effectively, then a frog might have a difficult time finding food, escaping predators, and finding a mate at temperatures near the upper and lower limits of the performance curve.
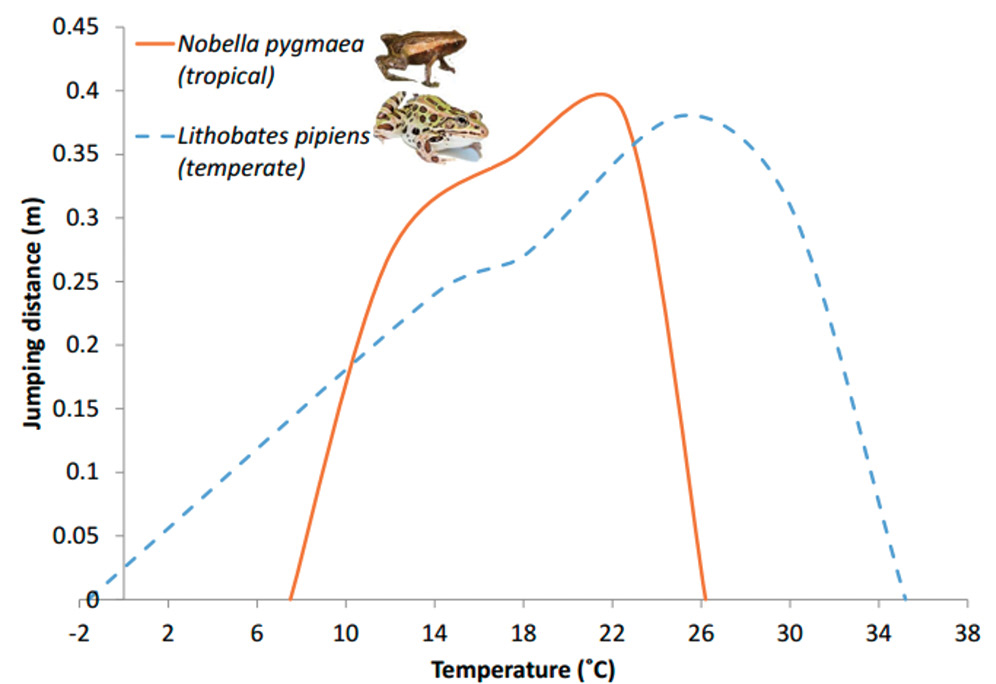
Performance curves of a temperate frog species (Lithobates pipiens) and a tropical frog species (Nobella pygmaea) showing the jumping distance versus temperature.
Elaborate
We encourage students to elaborate on the data they collected by helping them draw connections to current research on global amphibian declines in the news. Students read a Science Daily article entitled “Frogs That Can Take the Heat Expected to Fare Better in a Changing World” (see Online Resources) on how an amphibian’s thermal physiology might determine whether it can survive a deadly fungal infection caused by the chytrid fungus (also known as Bd, a shortened form of its scientific name, Batrachochytrium dendrobatidis) under future climate conditions. We guide students through the article using a worksheet that expands on the concepts learned during their data collection (see Supplemental Materials). The use of the worksheet and suggestions for teachers to guide students through the article will ensure that students at different reading levels are able to understand the concepts presented, especially for students with a lower reading level. This Science Daily article is a middle school–level article, but there are additional articles available for readers at similar or higher levels for advanced students (e.g., articles from National Georgraphic and Science News; see Online Resources).
In the worksheet that accompanies the reading, students are asked to interpret graphs of thermal performance curves to make predictions about how a given frog species will fare under different environmental conditions (Figure 3B) and whether they could escape a fungal infection by moving to warmer microclimates. The students then look at their own data, taking the chytrid fungus performance curve that measures growth rate of the fungus at different temperatures into account, and determine which microhabitat would favor infection and increase the likelihood of frog disease. This type of data analysis solidifies the crosscutting concept of cause and effect through evaluating the frog populations that would be most susceptible to disease and connecting it back to the data they collected.
Throughout the module, students are reminded that the data they collect will be used by researchers at the University of Pittsburgh. Dr. Richards-
Zawacki and her collaborators are currently using the data students collect to test the accuracy of computational models that predict amphibian body temperatures in the field. Teachers can submit the data students collect to the Ectotherm ER website (see Online Resources) so it can be used by Dr. Richards-Zawacki’s laboratory. A more accurate model of amphibian body temperature will help researchers make predictions of the effects of disease and climate change on amphibians into the future. The Ectotherm ER module allows students to take part in the scientific process, providing motivation for contributing the data they collect to this pressing ecological problem.
Evaluate
Throughout the module, students are assessed on their understanding of how climate change can impact amphibian health (example questions include: What life processes of a frog might climate change affect? What could a frog do to maximize its chance for survival in a warmer vs. more variable climate?). Students use data and information presented during the module to deduce logical responses. They are also given example graphs to analyze before making their own histograms. Over the course of the module, teachers can check these worksheets (provided in Supplemental Materials) for understanding as they build on the concepts. By the end of the module, students can summarize their findings in a number of ways. The goal is to have the students think about the investigation as a whole and how both climate and disease impact different frog species. After gathering and analyzing their frog temperature data and discovering how the chytrid fungus can play a role in amphibian health, a class discussion can help tie all of these concepts together.
Here are some questions to address with students:
- Are some frogs more likely to thrive in warmer climates than others? (Answer: Yes)
- Which frogs would you predict to be more susceptible to chytrid fungal infection? (Answer: Frogs that live in areas with temperatures that support survival of the fungus.)
- How might climate change impact overall amphibian health? (Answer: As climates change, life processes of a frog may be affected. While it may allow for some frogs to fight disease, others will not be able to perform basic survival functions in new climates.)
- How would you connect disease, temperature, and declining frog populations? (Answer: As climates change, pathogens may be able to survive in increased locations and result in disease to the animals that live there.)
One way in which teachers can assess student comprehension of the project is through a claim-evidence-reasoning (CER) strategy for the prompt: “Explain how climate change might affect frog performance and the relationship between a frog and the chytrid fungus and how that could impact frog species’ survival. Be sure to include evidence from the ‘Ectotherm ER: Frogs Under the Weather’ module.” Information about climate change is presented in the introductory video, and students should consider that while increasing temperatures could kill the fungus that is harmful for amphibians, this could come at a cost of loss of performance. Teachers can assess the responses according to a CER rubric (McNeill and Krajcik 2008; specific examples given in Supplemental Materials).
Another approach to assessing student learning is through the use of a mini-poster. In this exercise, students visually represent their findings similar to how scientists share their work. Alternatively, students can write and peer-review a final report that takes into account the big picture of the module (templates for the mini-poster and final report with peer review are available in Supplemental Materials). It is important to note that these questions are areas of active research by scientists. The data that the students collect can help scientists better understand the relationships between local climates, the microhabitats amphibians inhabit, and frog body temperatures, all of which can be an important predictor of their susceptibility to chytrid fungal infection. More broadly, these data help provide a clearer overall picture of the health of the global environment.
Conclusions
This curriculum engages students in a topic that is sometimes controversial or difficult to teach. By relating climate change to the global amphibian decline that has been in the news, as well as gathering data from their own school yard, students learn how changes in the environment can impact the planet. •
Acknowledgments
We thank the National Science Foundation and the Grable Foundation for their support of this project.Online Resources
Ectotherm ER website—ectothermer.pitt.edu
National Geographic (“Ground zero of amphibian ‘apocalypse’ finally found”)—https://www.nationalgeographic.com/news/2018/05/amphibians-decline-frogs-chytrid-fungi-bd-animals-science/
NSTA field trip safety document—http://static.nsta.org/pdfs/FieldTripSafety.pdf
Science Daily (“Frogs that can take the heat expected to fare better in a changing world”)—https://www.sciencedaily.com/releases/2016/07/160707171954.htm
Science News (“Chytrid’s frog-killing toll has been tallied—and it’s bad”)— https://www.sciencenews.org/article/frog-killing-bd-chytrid-fungus-death-toll?utm_source=&utm_medium=&utm_campaign=
Video: “Ectotherm ER: Frogs Under the Weather Background”—ectothermer.pitt.edu
Supplemental Materials
Rebecca Gonda (reg11@pitt.edu) is a visiting lecturer and Director of Outreach, Alison Slinskey Legg is a senior lecturer and founding co-director of the Broadening Equity in STEM Center, and Corinne Richards-Zawacki is a professor and PLE director, all in the Department of Biological Sciences at the University of Pittsburgh in Pittsburgh, Pennsylvania. Michel Ohmer is a Biodiversity postdoctoral fellow at the Living Earth Collaborative at Washington University in St. Lous. Laura Brannelly is a research fellow in the Faculty of Veterinary and Agricultural Sciences at The University of Melbourne in Melbourne, Victoria, Australia. Jennifer Kassimer is a teacher in the West Jefferson Hills School District and STEM Education doctoral student in Pittsburgh, Pennsylvania. Stephanie Kubik is a middle school teacher at the Canonsburg Middle School in Canonsburg, Pennsylvania.
Biology Citizen Science Climate Change Curriculum Environmental Science Evolution General Science Inquiry Instructional Materials Labs Lesson Plans Literacy New Science Teachers News Research STEM Middle School