
feature
Cornhole Predicts the Perfect Pitch
A Hands-On Projectile Motion Experience Comparing Models and Data
Science Scope—May/June 2021 (Volume 44, Issue 5)
By Benjamin Galluzzo, Michael W. Ramsdell, Joshua D. Thomas, Kathleen Kavanagh, Corey Ryder, Darlene Bissonette, and Jennifer M. Knack

CONTENT AREA Science and Math
GRADE LEVEL 6–10 (middle school stopping point in text)
BIG IDEA/UNIT Math modeling and physics principals
ESSENTIAL PRE-EXISTING KNOWLEDGE Some knowledge of angles, graphing. For more advanced students, knowledge of equations.
TIME REQUIRED Full activity: two class periods, can be smaller pieces.
COST $10 (if able to borrow cornhole boards); $175 (if purchasing cornhole boards and video analysis software)
SAFETY Use caution when throwing bags.
Projectile motion is an ideal topic to combine physics and mathematics that is accessible across grade levels. We describe an activity that uses the game Cornhole to integrate data collection, analysis, and physical and mathematical modeling. Students predict the possible launch angles and launch speeds for successfully scoring points in a Cornhole match. This lesson was implemented at a STEM camp (Wick et al. 2011) for roughly 80 students in grades 7 to 12. We should note that this camp was not a pay-camp for gifted students; rather, it was a grant-funded camp for students in rural poverty, so there were heterogeneous skill sets. The activities were implemented with the assistance and input from science and math teachers from five school districts.
Cornhole, similar to a bean-bag toss, is a safe game (Slick Woody’s 2017) where players take turns pitching (or throwing) bags of corn toward angled boards placed 18 feet apart (see official Cornhole rules in Online Resources) and try to land the bag onto the board or into a hole at the top of the board. Although the scoring criteria is based on multiple factors, the motivation for this activity is to determine the combination of launch angles and speeds to successfully toss the corn bag directly into the hole (called an airmail).
The activity is conducted in three parts: (1) a computer game that simulates Cornhole so students can brainstorm about relevant factors for a successful toss; (2) an interactive mathematical model using Excel spreadsheets, which helps students to learn about how the launch angle and speed influence the results; and (3) a data collection and analysis phase in which students play Cornhole and collect the trajectory of their tosses, then revisit the mathematical model to reinforce the underlying concepts. By brainstorming collaboratively, collecting their own data using technology, and then analyzing their findings on a computer (visually and numerically), they are continually engaged and communicate their ideas.
This activity provides an opportunity for students to use classical mechanics and mathematics to explore cause-and-effect relationships to make predictions. Mathematical models represent the physical interactions with consideration of the inputs and outputs within the process of projectile motion. The activity also sheds light on more complicated ideas like friction, drag, and properties of right triangles. Students are empowered by having ownership over their learning because multiple solutions provide insight into problem solving. While playing a game, students simultaneously make connections between mathematics, computational thinking, and physics.
Engage
The activity starts with students playing a prebuilt Scratch game (see Online Resources; see also Figure 1) that simulates a round of Cornhole. Scratch is a visual programming language designed to teach children to program. The implementation of the game is simple but allows students to get the general idea of how different launch angles impact where the bag lands. A worksheet (see Online Resources) is used to guide them through the simulation so they see that changing the launch angle and speed produces different landing positions for specific tosses.
Cornhole Scoring and Terminology
A tossed bag that lands in the target hole is worth 3 points.
- a throw of this type is generally called a cornhole.
- a slider refers to a bag that lands in front of the board and slides into the target hole.
- an airmail is a toss that falls directly into the target hole, never touching the board.
A tossed bag that lands on the board but doesn’t fall in the target hole is worth 1 point.
- a throw of this type is commonly called an ace.
A tossed bag that misses the board and doesn’t fall in the hole is worth 0 points. We’ll refer to this type of shot as a miss.
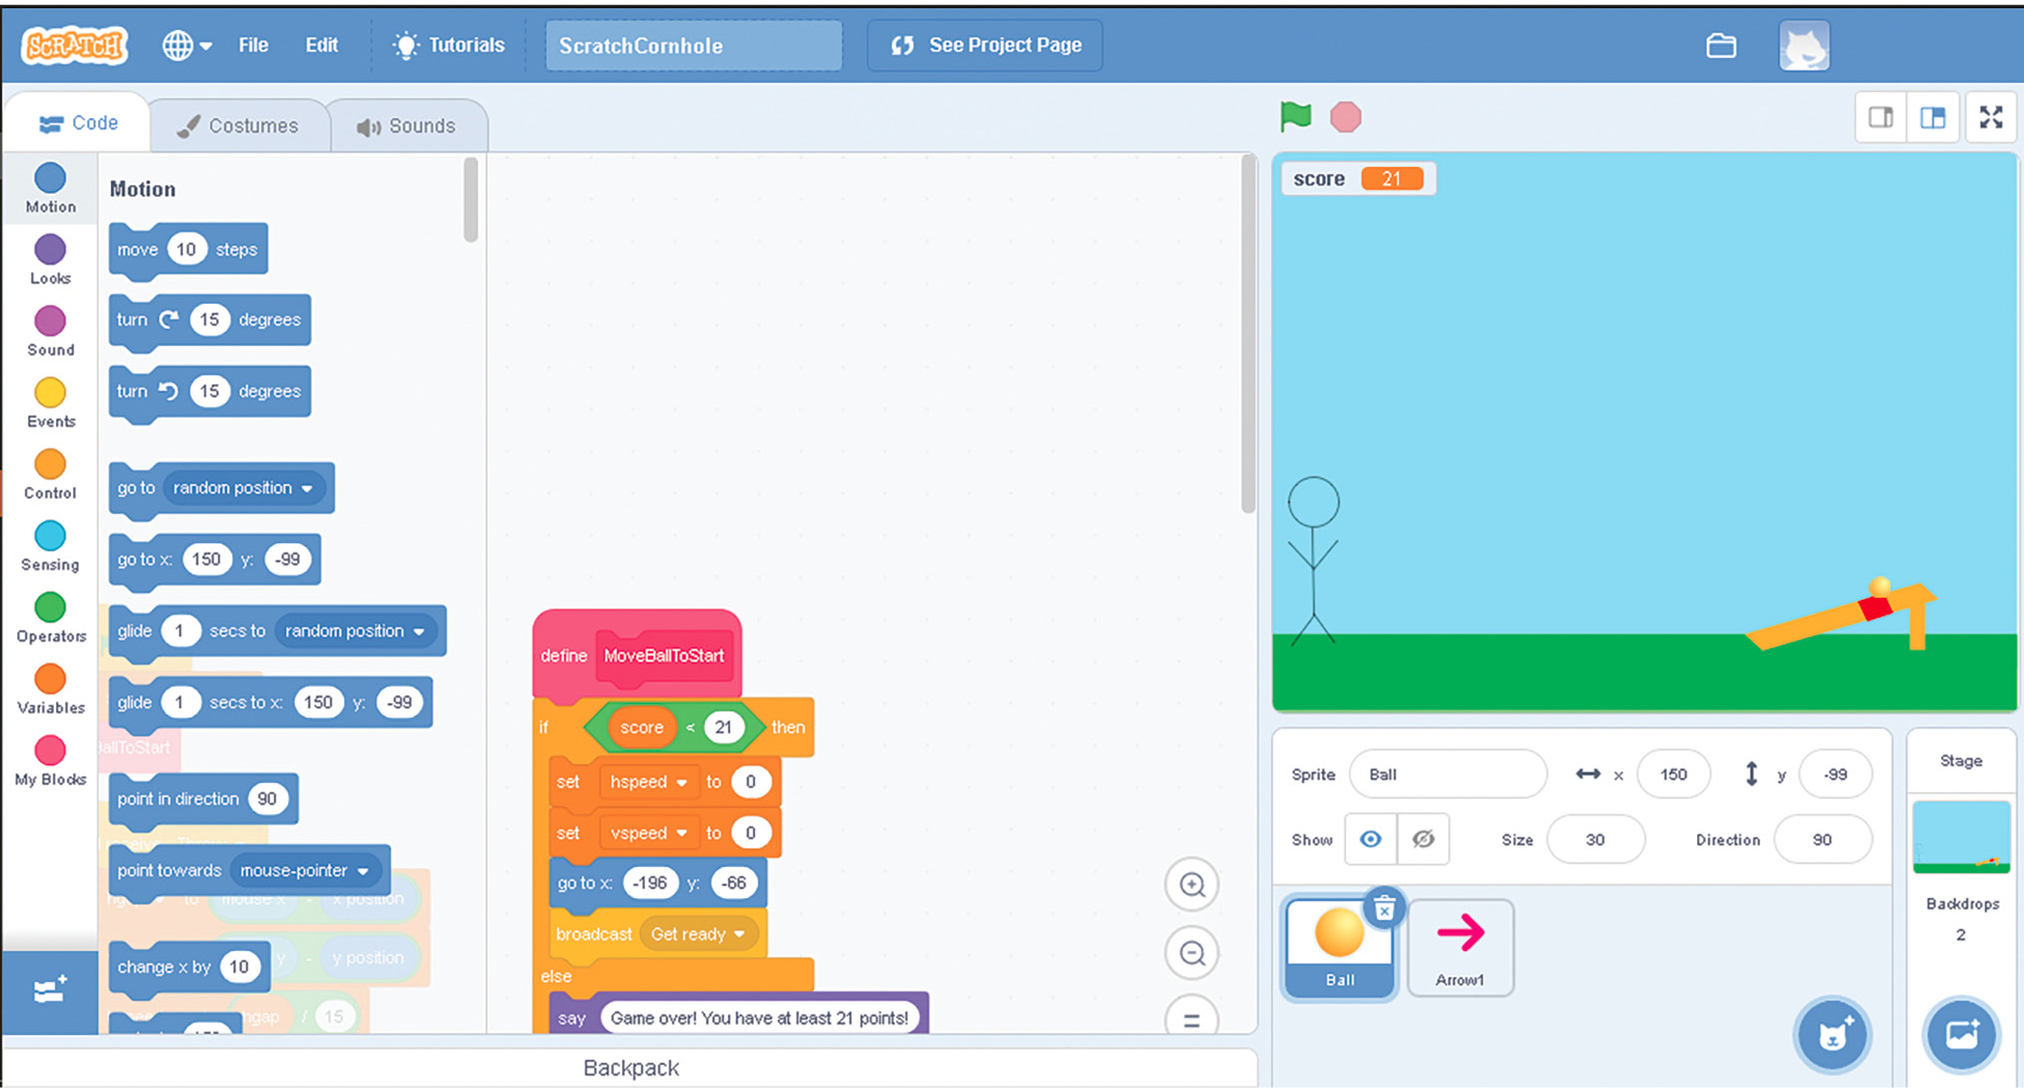
Prebuilt scratch game link available in Online Resources.
The Scratch game also emphasizes some real-world limitations of a model focused on just a few inputs. Using the shared experience of throwing objects, students can discuss how the Scratch Cornhole simulation is different from a real game. In a large-group discussion, students brainstorm factors and variables that impact outcomes when tossing the corn bag at the board. Notably, students are able to list many of the math and physics ideas that are emphasized in the lesson, such as the difference in the horizontal and vertical motion for objects under free fall (investigated in the extend and elaborate phases), as well as a number of factors that are likely beyond the scope of this activity (e.g., friction).
Explore
Students are now able to evaluate how their ideas and understanding are integrated into an Excel model (see Online Resources). Together, students in the group determine the parameters used in a brainstorming session. The parameters identified during brainstorming included initial launch angle, initial velocity, and initial position of release. Working in smaller groups, they predict possible outcomes using the Excel model. Within this preprogrammed spreadsheet, students alter the trajectory (see Figure 2) of the cornhole bag by changing the launch speed and recording the maximum and minimum speeds that result in successful outcomes: aces (bags landing on the board) and airmails (bags that land in the hole). After using the spreadsheet to investigate the parameters necessary for a successful Cornhole game, students play an actual game of Cornhole, during which they collect data to compare against the Excel model.
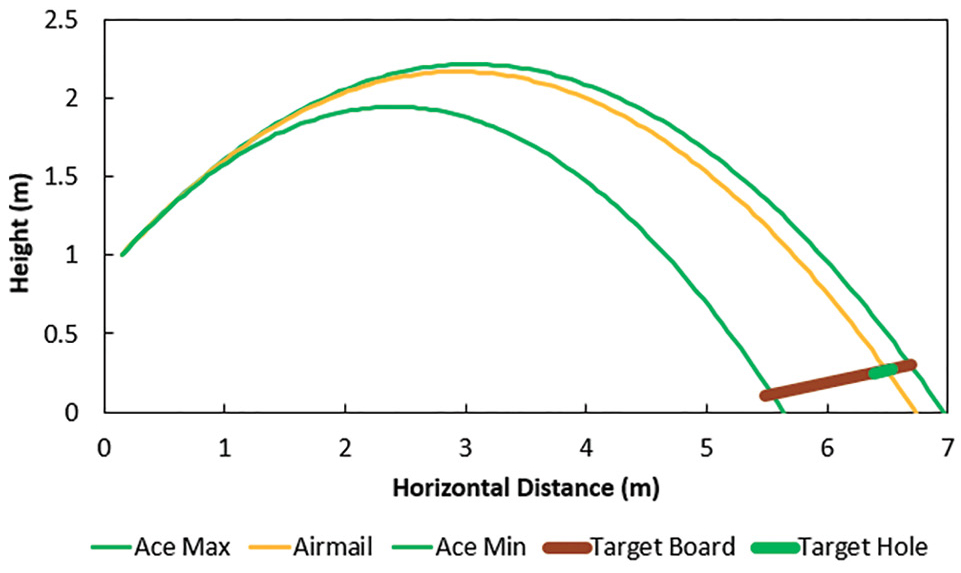
The target board and Cornhole are indicated on the lower right of the plot. Three trajectories are plotted for a launch angle of 40 degrees. The ace throws with max. and min. velocities are in green. The yellow curve illustrates the solution for an airmail throw.
Prior to the start of the game, the Cornhole players are tasked with calibration of the video. Calibration serves two purposes: (1) to convert pixels from the video to meters and (2) to define the plane that contains the bag’s trajectory. Calibration is accomplished by placing the game boards 18 feet (approximately 5.5 meters) apart and holding an object of known height (we used a two-meter stick) at the front edge of each board. These four points (shown as blue dots in Figure 3) define the plane of projectile motion in the data collection app (shown as red dots in Figure 3). Group members are assigned to the following roles: two students act as Cornhole players, one student is the video recorder, and one student serves as note taker.
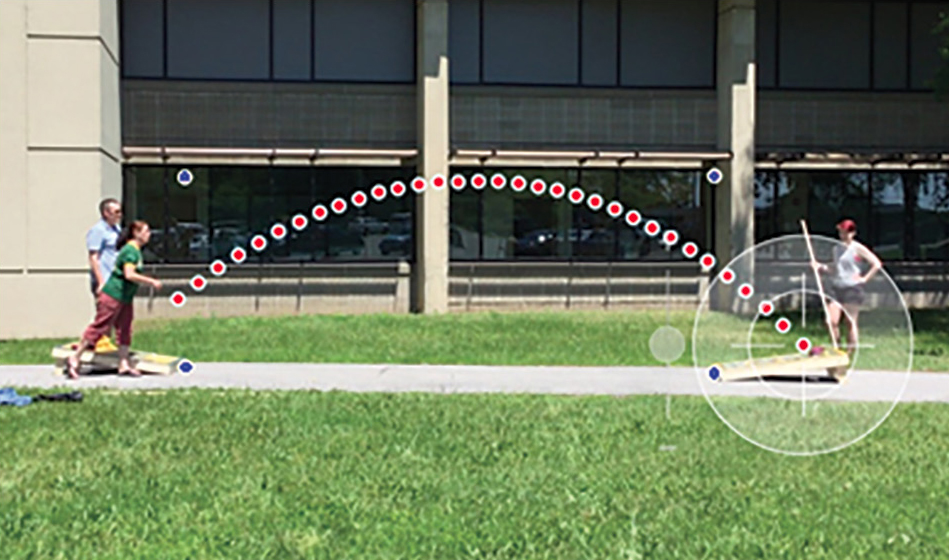
Example of data collection. The trajectory of the corn bag can be seen traced out by the red dots. The white crosshair is placed by the student on the point of interest; the horizontal and vertical coordinates of each dot are recorded to a file. The four calibration points are also shown in blue.
The video recorder uses a tripod and an iPad or tablet to create a video, which begins before the calibration and includes a side view of the game with a full view of both boards as shown in Figure 3. The note taker carefully notes the history of the match including competitor, launch (throw) number, and result. Competitors adjust their throws in each round to improve their game.
Explain
During this phase, students compare data collected from the video of their bag throws to the prediction (model) of the pitch calculated in Excel. Through experimentation and data analysis, they have the opportunity to experience what various throws (airmail, slider, etc.) look like in the real world (see Figure 3) and can compare them to the trajectories predicted by the Excel model (see Figure 2). To do so, students process the toss data through video analysis software such as Tracker or Vernier Video Physics app (provides nice data for use in this application; see Online Resources). Location data from each throw, which is collected and saved independently, connects to locations in a video frame. The students click on the corn bag in each frame of the video during its flight (these positions are indicated by the red dots in Figure 3). The software outputs a table of data containing the position of the bag as a function of time, which is used to determine the initial launch angle (θLaunch) and speed (VLaunch) (see Figure 4).
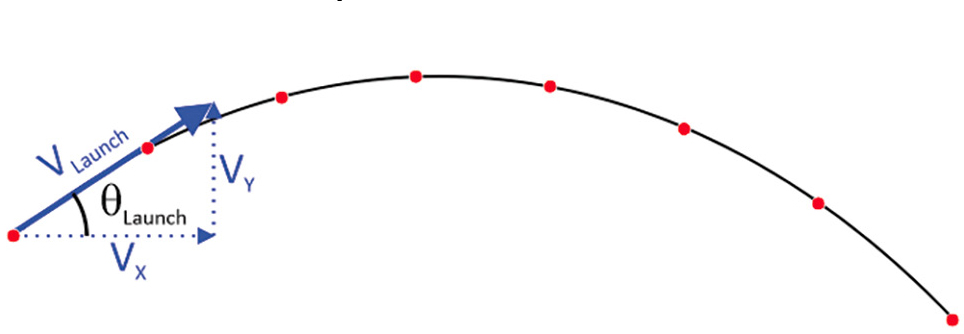
The launch triangle for a projectile path. The launch angle θ (Launch) and launch speed V (Launch) are the critical parameters for determining the bag trajectory. The left-most red dot is the initial launch position.
Correctly modeled tosses are great, but ones that are incorrectly modeled often serve as prompts for rich discussion and highlight the role of the note taker during data collection. For example, students noted how the Excel model does not account for lateral (or side-to-side) movement of the corn bag and how the model assumes each toss was aimed correctly. The students connect the real-world experience of playing Cornhole and the specific results from individual tosses such as a slider, airmail, or long or short miss to the Excel model curves shown in Figure 5. Sense-making is established when students discuss how the results of a toss match the prediction from the Excel model. For the majority of middle school students, completion of this activity/step is an appropriate stopping point.
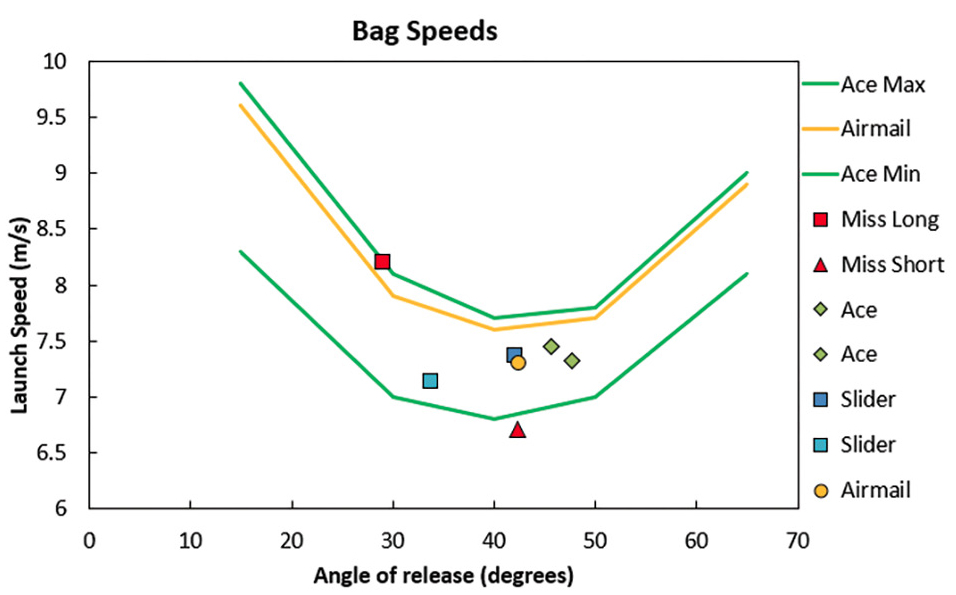
The graph shows how launch speed and angle of release affect the odds of landing on the board, which occurs if the bag falls between the green curves.
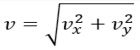
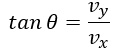
However, advanced students may be interested in a more in-depth explanation of the video analysis software. Figure 6 illustrates how the table of data output from the video analysis software can be used to determine the launch speed and angle. The table of data has the horizontal and vertical positions along with time. The equation of a line (y = mx + b) is compared with the plot of the horizontal position versus time data where the slope (m) is the horizontal component (vx) for the corn bag velocity. Likewise, the equation of a parabola is compared with the plot of the vertical position versus time data where the polynomial coefficient, B, is vy or the horizontal component of the corn bag velocity. The horizontal (vx) and vertical (vy) components of the corn bag velocity are the “legs” of the launch triangle shown in Figure 4. For the highly motivated students that may not have learned some of the underlying mathematics by this point, we include details of the trigonometry that is preprogrammed within the Excel model to find the launch speed, v, and the launch angle, 𝛳, using the Pythagorean theorem,
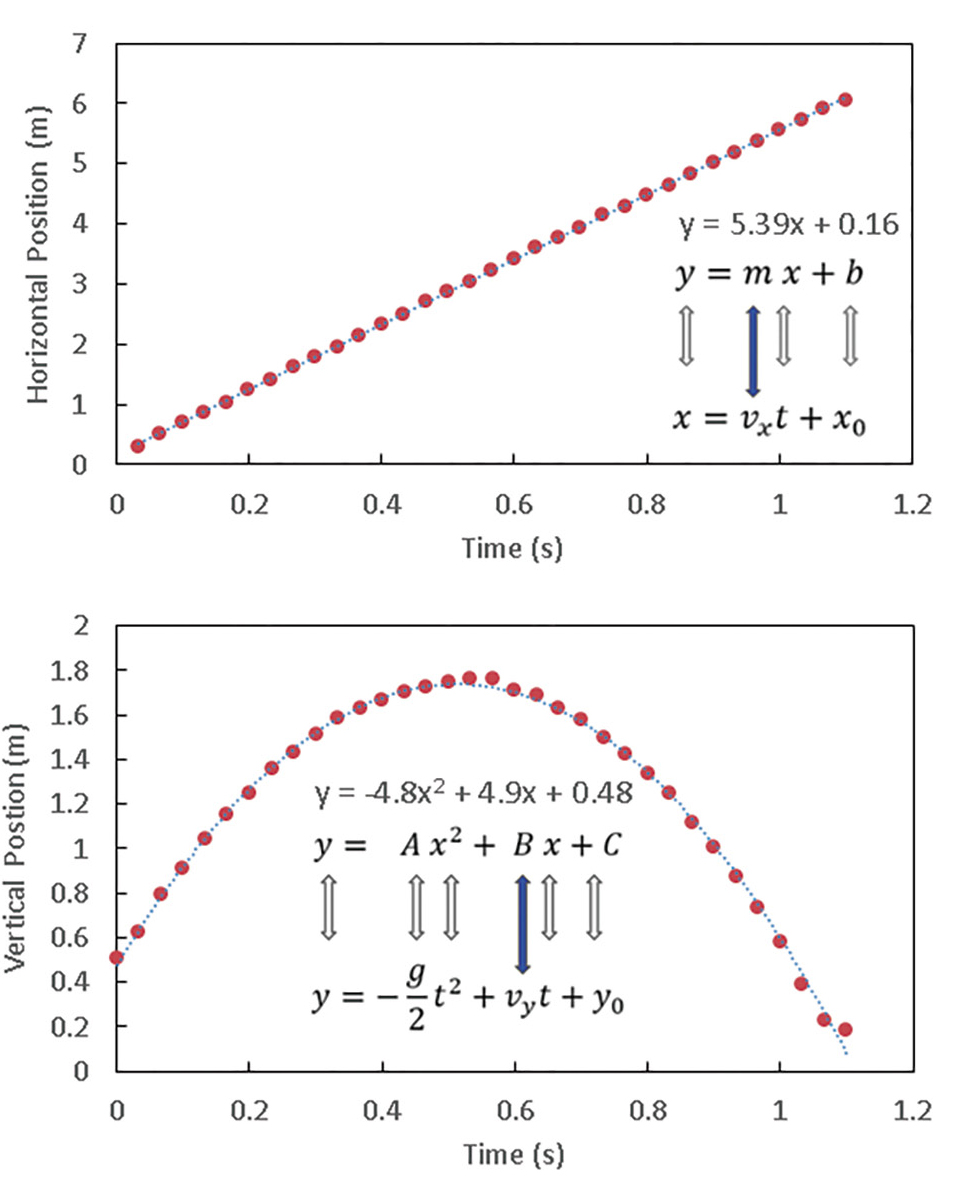
Data for the airmail in Figure 5. The top panel is the horizontal position vs. time and the bottom panel is the vertical position vs. time. Each graph shows the equation of the fit to the data in Excel. The arrows represent how the mathematical representation from standard equations of motion are modified to represent the physical quantities needed to obtain the sides of the launch triangle (see Figure 4).
and tangent function
Extend and elaborate
In addition to launch angle, student data collectors found that their initial launch position was not the same for each pitcher or even each throw of the bag. As a result, students personalize the Excel model by editing their corn bag toss release height (where the bag leaves the hand), angle, and speed using data from the software. The approximate launch height can be measured from the video or estimated with a meterstick. The initial launch angle and speed are determined automatically after data is entered into the provided Excel model. Students enter their data by pasting it into the Experimental Data tab within the preprogrammed Excel model.
The bag speeds graph (see Figure 5) also provides students with a challenging mathematical task, namely interpreting a graphic that uses nontraditional axes and provides a collection of results. By asking students “What does it mean if a corn bag is tossed at a given angle with a given speed?”, we can start to increase visualization fluency where students see and understand how the details of the trajectory shape are connected to the launch parameters. This skill is important when analyzing and interpreting data and ultimately developing useful models.
Moreover, students see there is a variety of solutions given possible launch parameters rather than focusing on only having a single “correct” solution. For example, solutions that result in landing on the board lie between the green curves seen in Figure 5.
Evaluate
The initial implementation of this activity was in a camp setting, so all assessment was informal. We listened to student discussions about the limitations of the models used and what factors could be included to get more accurate results. These factors included launch position, aim, board friction, pitch consistency, and others that allowed us to gauge comprehension. Students demonstrated their ability to connect theory to a real-world experience, their understanding of a range of “correct” answers, and their ability to incorporate updates to their model. We engaged a wide range of students (regardless of mathematical background) to participate in an authentic activity with curricular relevance. By highlighting the connection between the real world and computational thinking, students begin to use mathematics as a tool for exploration. In their exploration, they use quantitative skills to see that the world they live in often does not have a single correct answer to problems.
Conclusion
The design of this activity allows students to use mathematical models and data to test and compare outcomes in the context of projectile motion. The use of a computer simulation, interactive Excel spreadsheets, and iPads to collect the data engage students with digital tools to support the process of scientific inquiry (the interpretation of Figure 5 reveals the successful combination of launch angle and speed; for many students this graphic highlights a new way to visualize real-world phenomena—reinforcing the relationship between mathematics and science).
Students loved engaging in this STEM activity, which was developed through a collaboration between mathematics and physics teachers. The activity described here can be tailored to fit into a smaller time frame or expanded for more depth. The lesson presented here uses technology, but the simple act of tossing an object at a target can get students brainstorming about the connections that math and physics have to projectile motion. Although we have presented one approach, the game of Cornhole offers a wide range of possibilities for students to explore STEM, and this work can facilitate other directions.
Cornhole Data Collection Procedures
1. Set the boards 18 feet apart (approximately 5.5 m) squarely facing each other.
2. Find four calibration points. Place (have two students hold) an object of known height, such as a meter stick at the front edge of each board. In our case, we used the top and bottom of each two-meter stick as calibration points.
3. Record video of corn bag tosses, recording each throw separately. Continue throwing (and recording) until you capture at least two throws of each possible outcome: miss, ace, slider, and airmail.
4. Import select videos into tracking software of choice.
5. Follow tracking app instructions* to connect the location of a corn bag in a time-specific video frame to generate data.
6. Share data processed on the tracking app with Excel model for comparison with model projections.
* Most apps will require the user to orient the screen and identify three (or all four) points for calibration purposes.
Online Resources
Scratch—https://scratch.mit.edu/
Prebuilt Scratch game titled Cornhole that simulates a game—https://scratch.mit.edu/projects/317732284
Instructions, student worksheet, and Excel model—https://drive.google.com/drive/folders/1Ls2NEwBwcGjS5-mNL_M3olqzpeaUAdrQ?usp=sharing
Free tracker software—https://physlets.org/tracker/
Vernier Video Physics app (pay per device app)—https://apps.apple.com/us/app/vernier-video-physics/id389784247
Official Cornhole rules—https://www.playCornhole.org/pages/rules
Supplemental materials
Benjamin Galluzzo is an associate professor in the Institute for STEM Education, Michael W. Ramsdell (mramsdel@clarkson.edu) is an associate professor in the Department of Physics, Joshua D. Thomas is an assistant professor in the Department of Physics, Kathleen Kavanagh is a professor in the Department of Mathematics, Corey Ryder is an undergraduate student in the Department of Education, and Jennifer M. Knack is an associate professor in the Department of Psychology, all at Clarkson University in Potsdam, New York. Darlene Bissonette is a science teacher at St. Lawrence Central School in Brasher Falls, New York.
5E General Science Instructional Materials Interdisciplinary Labs Lesson Plans Mathematics Performance Expectations Physical Science Physics Science and Engineering Practices STEM Technology Middle School High School Grades 6-8 Grades 9-12