
feature
The Eagle Has Fallen
Flatline of the Flathead Lake ecosystem
At the center of more inclusive, equitable education is the student. A student’s science identity, or “identifying as a ‘science person’ is predictive of science success” (Chen et al. 2021). Students from marginalized populations may be less likely to engage in science education and form science identities. Thus, science education should include culturally responsive pedagogy to engage students from diverse cultural and ethnic backgrounds and promote science identity in every student (Mhakure and Otulaja 2017).
I am a high school science teacher from rural Montana, teaching a majority-white population with some American Indian students, and developed a weeklong unit for 10th-grade biology students examining the intersection of Indigenous Science and western science. “Indigenous Science is a broad term that reflects an inter-disciplinary sensibility reflecting Indigenous peoples knowledge and practices past and present” (Spang and Bang 2015).
There are 5.7 million people in the United States classified as American Indian or Alaska Native; around 70,000 American Indians live in Montana. The context in which I teach is unique in that the school is in one of the most rural and remote areas of the contiguous United States. The predominant local industries are cattle ranching and oil, and her students have interests in hobbies like hunting, fishing, and rodeo, and in careers involving range and wildlife management. The area is also near several Indian Reservations, including the Crow Reservation, Northern Cheyenne Reservation, and Fort Peck Indian Reservation. The county is located on the ancestral hunting lands of the Hidatsa, Mandan, Arikara, Sioux, Crow, and Assiniboine tribes.
While there are some American Indian students in the school, most of the interactions with large populations of American Indian students occur when they are playing against each other in sports. When I was implementing Montana’s Indian Education for All standards, I sought to create a space that prioritizes honor and respect, where students learn about the cultural values of Montana’s tribes and how they manage natural resources. I wanted to show value for the American Indian students in her classroom while creating discourse for all students to learn about these complex issues. One method I used was for students to read tribal oral tradition stories to learn more about how they regard and manage natural resources. After students analyzed the data and solved the case, they explored different perspectives of resource management. They engaged in a pinwheel discussion where students could explore the perspectives of tribal governments and state governments to manage the ecological problem.
Indigenous science water ecology
Oral traditions have been a way of conveying information through generations for thousands of years. These stories have reproduced culture, values, and ideals, and are in essence the fabric of humanity. Reading oral tradition stories captured from sovereign tribal nations shows students not only the history of these groups, but also allows them to see how their interaction with the natural world has shaped their culture and values.
Students begin the unit by reading Bull Trout’s Gift: A Salish Story About the Value of Reciprocity by the Confederated Salish and Kootenai Tribes. This is a book about the Jocko River, which flows through the Flathead Indian Reservation. Students learn about how Indigenous people lived along the river for hundreds of years, until their lifestyles changed when Europeans began to change the river. Students also read about an oral tradition story told by Salish elder Johnny Arlee describing how the river dried up and was restored. Then they read about the four Cs that healthy aquatic ecosystems need: cold, clean, connected, and complex. Human manipulation of the watershed altered the river, removing some of these important factors, which students considered throughout the unit.
I encourage students to consider their own cultural perspectives as they read about the values of the Salish and Kootenai tribes. For example, a healthy ecosystem is essential for the tribes’ way of life. Similarly, the students reflect on how land and natural resource management on their own ranches and surrounding areas can affect their ways of life.
Flathead Lake ecosystem background
Students learn that Flathead Lake is located in northwestern Montana and is the largest freshwater lake west of the Missouri in the contiguous United States (Figure 1). The lake used to be part of a large glacial dammed lake, called Lake Missoula, during the last interglacial era. After originally forming along Flathead River, it was dammed in the 1930s at its outlet on Polson Bay. The Kerr Dam, which was established for hydroelectricity and irrigation, raised the water level by three meters. The lake is fed by the Flathead River, as well as Lake McDonald, Whitefish Lake, Ashley Lake, and Swan Lake, making up a very extensive watershed.
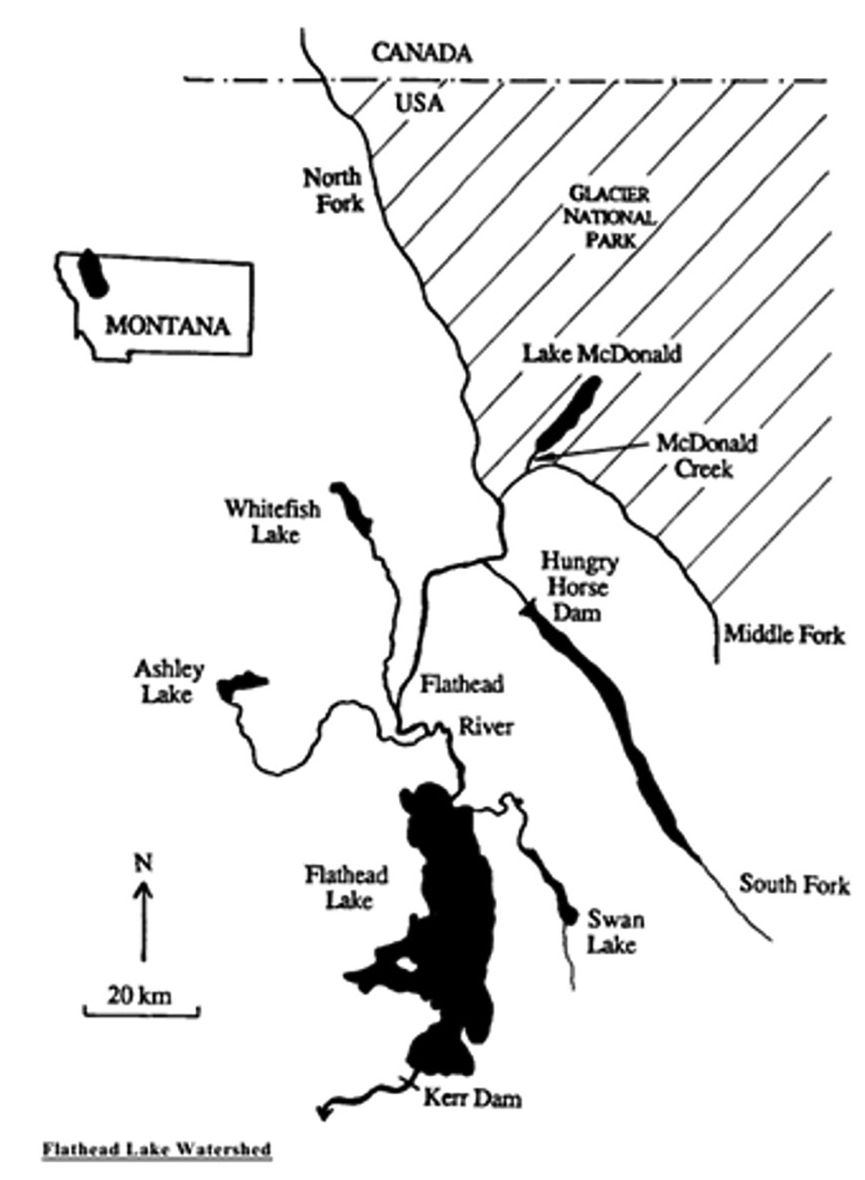
Map of Flathead Lake watershed (from Spencer et al. 1991).
Flathead Lake was originally named Salish Lake by the Salish Indians. It was later mistranslated by Europeans to Flathead Lake. The bottom half of Flathead Lake is on the Flathead Indian Reservation, which is inhabited by the Pend d’Oreille and Salish tribes, who have jurisdiction over how the lake is managed, while the state and federal government have jurisdiction over the northern half.
Originally, there were 11 different species of fish in the lake, including westslope cutthroat trout and bull trout. Around the late 1800s, people managing the lake started adding non-native species for fishing. After the dam was finished, lake managers kept adding even more species, changing the entire ecosystem. Around 1987, the population of Kokanee salmon, one of the introduced fish species, started to plummet, followed by a decline of the bald eagle population in that area.
Developing a food web
To begin exploring the ecosystem on the second day of the unit, groups of two to three students were given information about how the species interacted with each other (Table 1; see Online Connections) to construct a food web showing the feeding relationships, using an example from their textbooks. I provided a Google Slides template and students added textboxes and arrows to create the food web. They placed the bald eagle at the top, as the top predator, and phytoplankton at the bottom as the primary producers. Students then used the information provided to find the rest of the feeding relationships.
Some students also investigated whether organisms were native or non-native and provided a color-coded key. Figure 2 shows a current food web while Figure 3 shows a food web that only included the original organisms as a comparison to the current food web. This helped students visualize how the ecosystem changed with the introduction of new species. I met with each group to ensure that the food webs were accurate, even though each group’s diagram could look different.
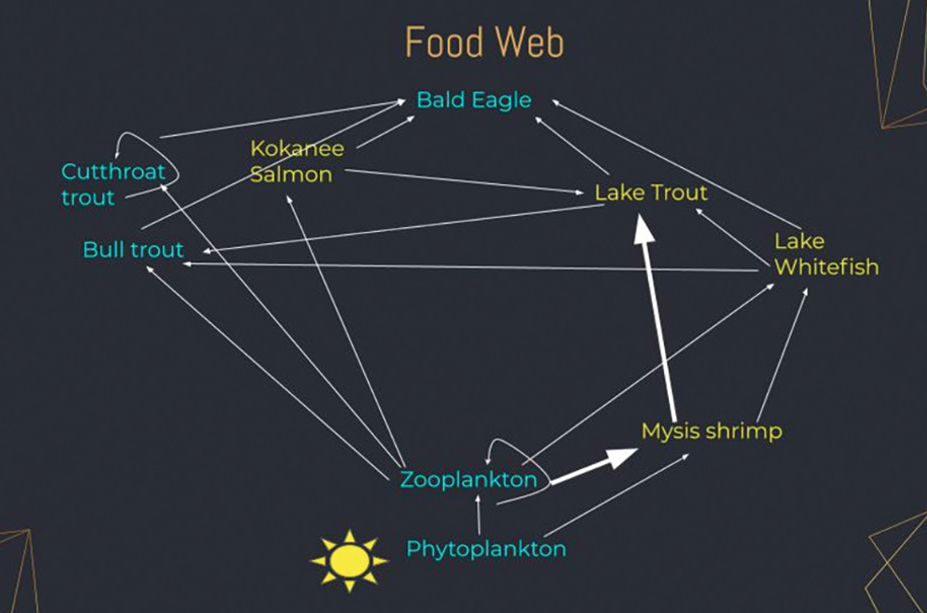
Example food web of the Flathead Lake ecosystem. The organisms in yellow are non-native and those in blue are native to the ecosystem.
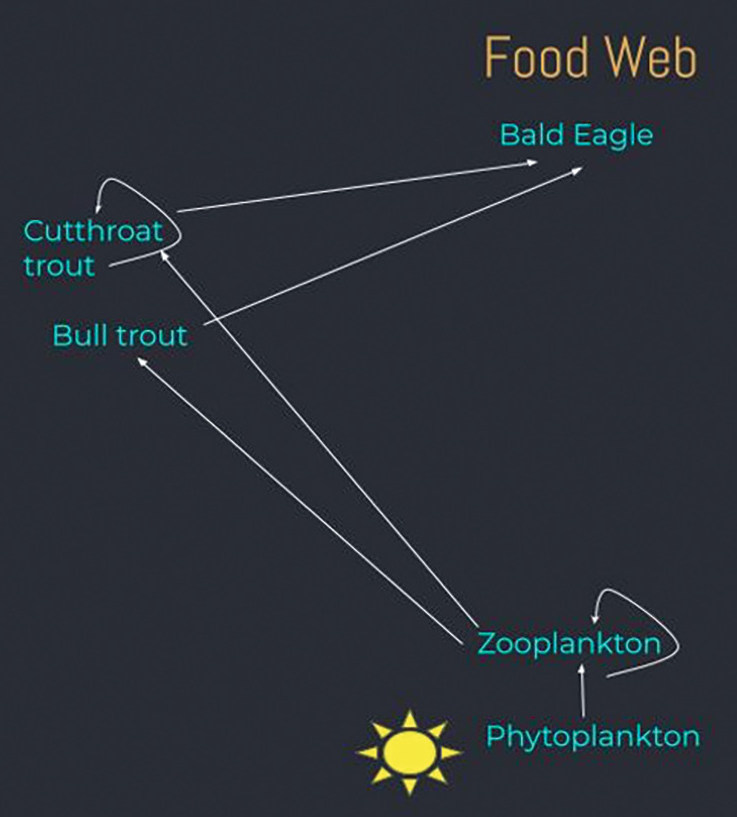
Example food web that shows organisms in the food web prior to the introduction of new organisms.
I then shared a lake-depth model to investigate where the organisms existed within the lake (Figure 4) and discussed with the class how the location of the organisms might influence their feeding relationships in the food web. The native fishes were more likely to live in the upper levels of the lake, while the non-native fishes were more likely to inhabit the lower part of the lake. Modeling the levels of the lake, along with the food web, provided students a more comprehensive understanding of the lake. I also provided a Google Slides template and worked with each group of students to help them develop their food webs and lake depth models.

Classroom photo of pinwheel discussion showing one remote student and three in-person students during the COVID-19 pandemic.
Analyzing data
On day 3, I provided student groups data of the population from their food web from 1979 to 1997 (Tables 2 and 3; see Online Connections). Students used Google Sheets to create three graphs to better understand the data (Figures 5, 6, and 7). They worked together to determine which data sets they should graph based on the essential question: What caused the bald eagle population to plummet? Thus, each group could choose to create different graphs. I facilitated their explorations but did not tell them which populations to graph.
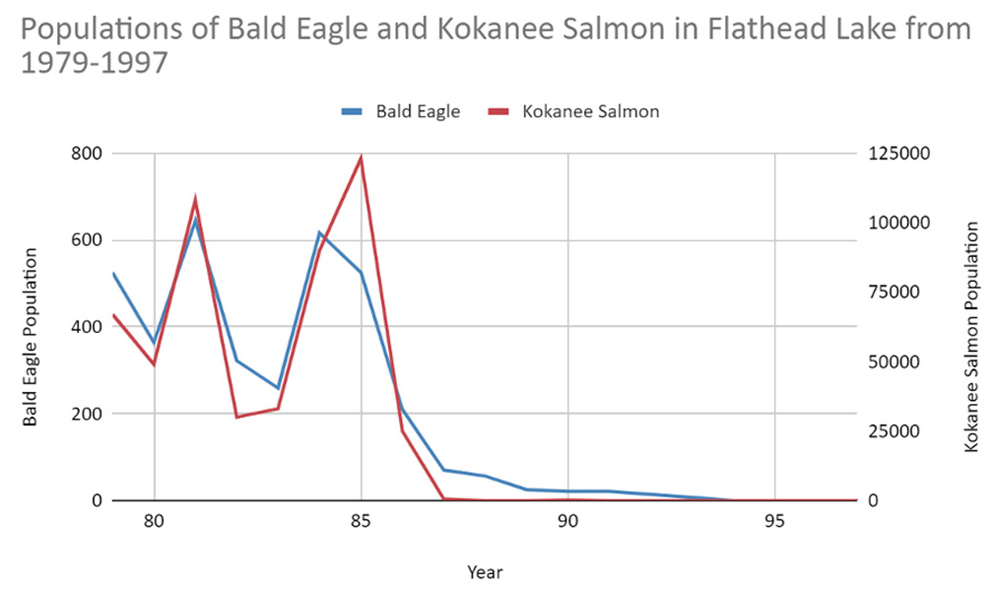
Graph showing bald eagle and Kokanee salmon populations with two axes.
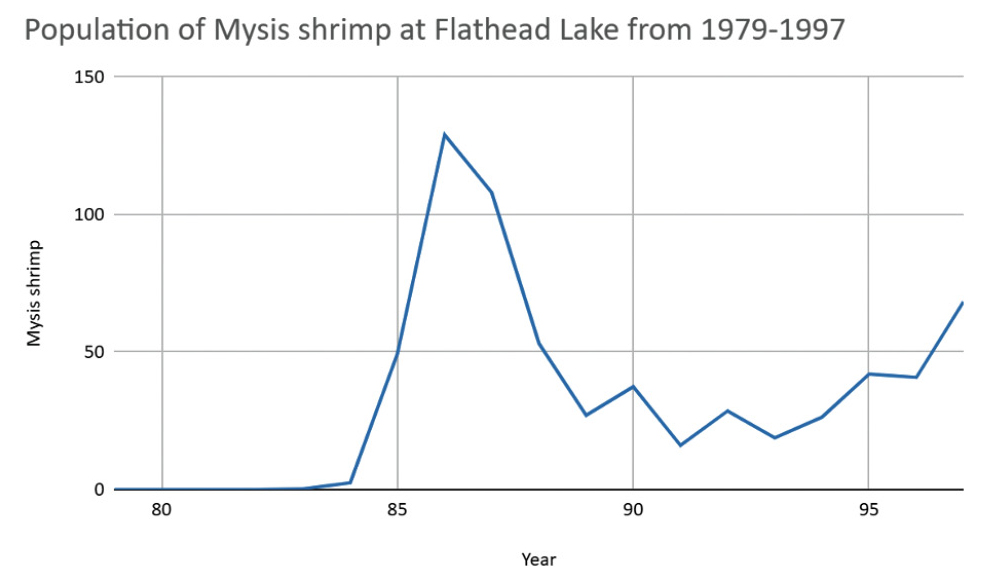
Graph showing Mysis shrimp population.
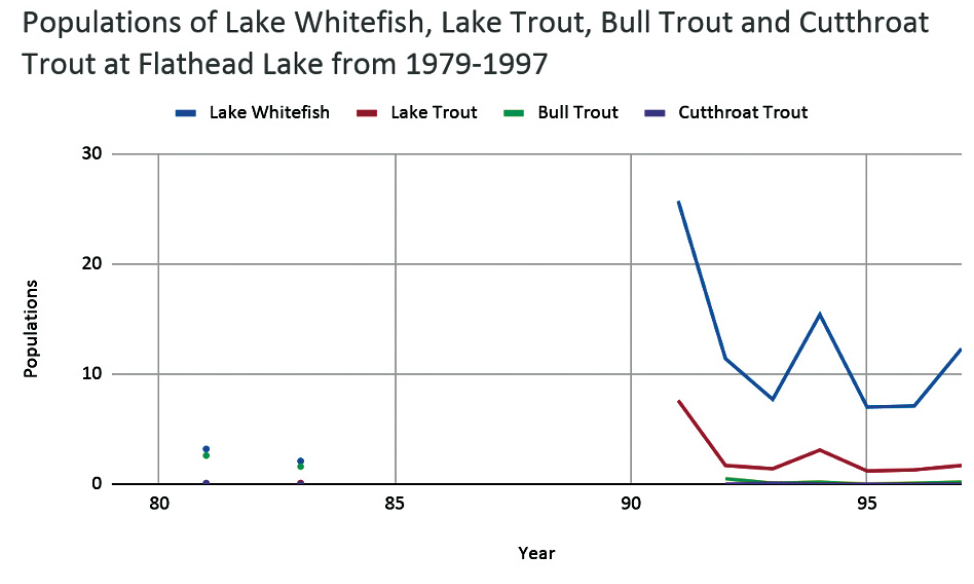
Graph showing other native and non-native fish populations.
Figure 5 shows bald eagle and Kokanee salmon populations with two axes. Some students graphed these together because they recognized there were similarities in the patterns and decline of the two populations. Students also graphed the Mysis shrimp population (Figure 6) separately because they recognized that the numbers started from zero and sharply increased. Many students also created a graph with the four other fish species to investigate how their populations changed (Figure 7). These graphs were also helpful as students tried to determine why the populations of bald eagle and Kokanee salmon sharply declined, but some groups required facilitation and scaffolding to determine how and why the ecosystem changed. Students included complete graph titles and axis labels and added the graphs to their Google Slides templates.
Solving the mystery
The students brought together their food webs and graphs to answer the question: What caused the bald eagle population to plummet? As the salmon population declined and increased in the 1980s, the bald eagle population also mirrored this response (Figure 5). Finally, there was a sharp decline of salmon in the late 1980s, followed by the bald eagle population plummeting to zero and not recovering. Figure 6 shows that the Mysis shrimp population was introduced around 1983 and 1984, rose sharply, peaked in 1986, and then dropped to a stable carrying capacity in 1989.
Students recognized that there may be a relationship between the introduction of the Mysis shrimp and the subsequent decline of the Kokanee salmon population, both of which occurred around the same time. Some non-native fish fed on the non-native Mysis shrimp, while the non-native Kokanee salmon and native fish fed on the zooplankton. However, the introduced Mysis shrimp fed on both the zooplankton and the phytoplankton (Figure 8). Thus, the Mysis shrimp outcompeted the Kokanee salmon and native fish for the zooplankton. This caused the sharp decline of the bald eagle, eventually causing the population to crash.
Finally, each group of students wrote an essay summarizing what happened, including the complex cause-and-effect relationships and evidence to support their claims. They then wrote a proposal explaining how they could restore the bald eagle population, including the pros and cons of their solution. Following this analysis, the class transitioned into the final two days of the project, the pinwheel discussion to consider multiple perspectives.
Pinwheel discussion
A pinwheel discussion is a pedagogical method used to facilitate discussion around different perspectives and opinions. This method has been used in the humanities and social sciences and provides a method for students to humanize diverse points of view and find common ground. The method is loosely reminiscent of talking circles that originated from First Nations leaders. They were developed “to ensure that all leaders in the tribal council were heard, and that those who were speaking were not interrupted” (Currie and Kaminski 2009). The Chiefs would generally start the conversation and ensure that all of the members had an equal chance to share their perspectives.
Similarly, a pinwheel discussion allows for multiple perspectives to be shared from a place of honor and respect. Both methods also shift the power dynamic in the classroom from the teacher or leader to the students or participants. In pinwheel discussions, there is an inner circle and an outer circle (Figure 9). The inner circle includes four students representing each of the groups, one for each perspective represented. The remaining students from each group are in the outer circle. As students discuss each question prompt in the inner circle, they switch with a member of their group in the outer circle for the next question. Thus, each student has the opportunity to engage in the pinwheel discussion and represent their group’s perspective. This method is not only culturally responsive for American Indian students, but also very effective for students from any cultural background and can even create cultural cross-bridges.
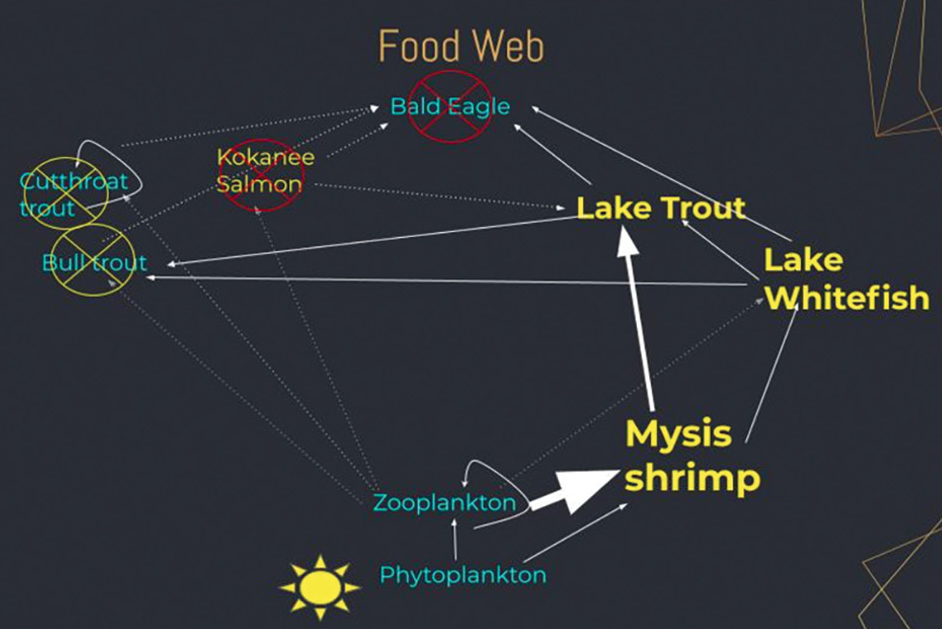
Food web showing how the introduction of the Mysis shrimp influenced the other organisms in the lake, resulting in the population crash of the Kokanee salmon and bald eagle.
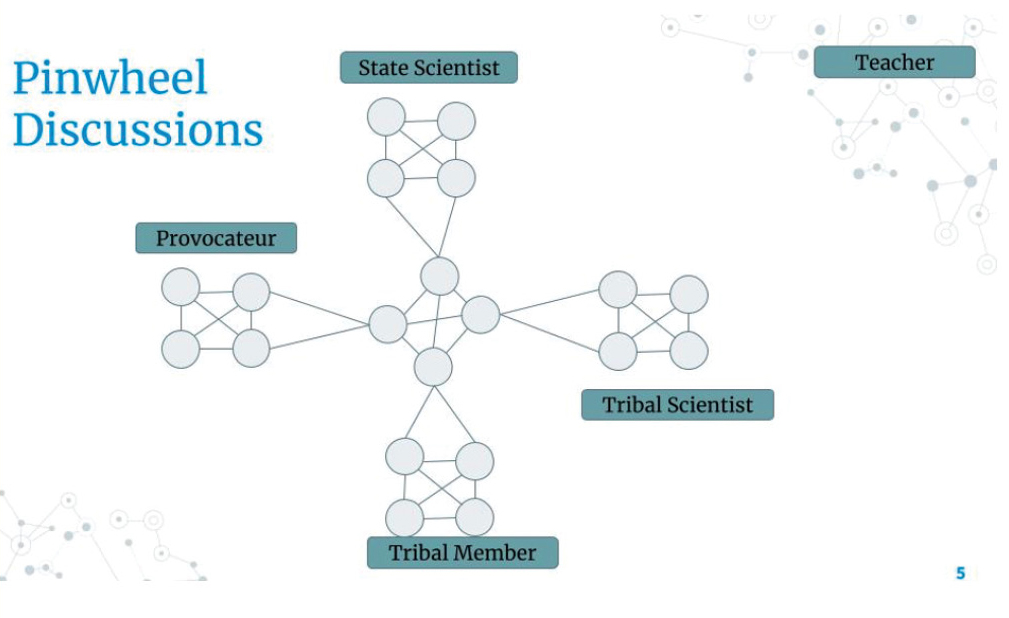
Diagram of pinwheel discussions seating arrangement.
I divided students into the following four groups: tribal scientist, tribal council member, state scientist, and provocateur. They read the job descriptions of the three jobs (Table 4; see Online Connections) and completed a slide in a class-shared Google Slides file summarizing their main takeaways from the job descriptions. The tribal council group found that their role was to make governmental decisions and that the tribe was a sovereign nation. They regulate tribal property and value tribal culture, health, and general welfare. The tribal scientist group protects the natural resources of the reservation while prioritizing cultural values and quality of life. The state scientist group serves the public, works with landowners, and preserves the culture of hunting, fishing, and other recreation. They also manage healthy ecosystems and wildlife. The provocateur group, whose role was to lead the discussion, was given all three job descriptions. Groups gave a short presentation of their slides on the class slide show. Then, they were given the five pinwheel questions, shown below, to prepare in their groups on the shared class slide show.
- What caused the decimation of the bald eagle population in Flathead Lake? What are the steps that led to this? Who or what is at fault?
- A group of people made a decision that contributed to this change in the ecosystem. What values did they base their decision on? How are those values similar to or different from yours?
- How could we have shown good stewardship and prevented this from happening?
- How can we remediate or restore this ecosystem? How could maintaining a Cool, Clean, Connected, and Complex aquatic ecosystem affect the populations?
- How can tribal scientists and state scientists work together to manage this problem?
Prior to beginning the pinwheel discussion, I reviewed some “talk rules” to use during the discussion. They included:
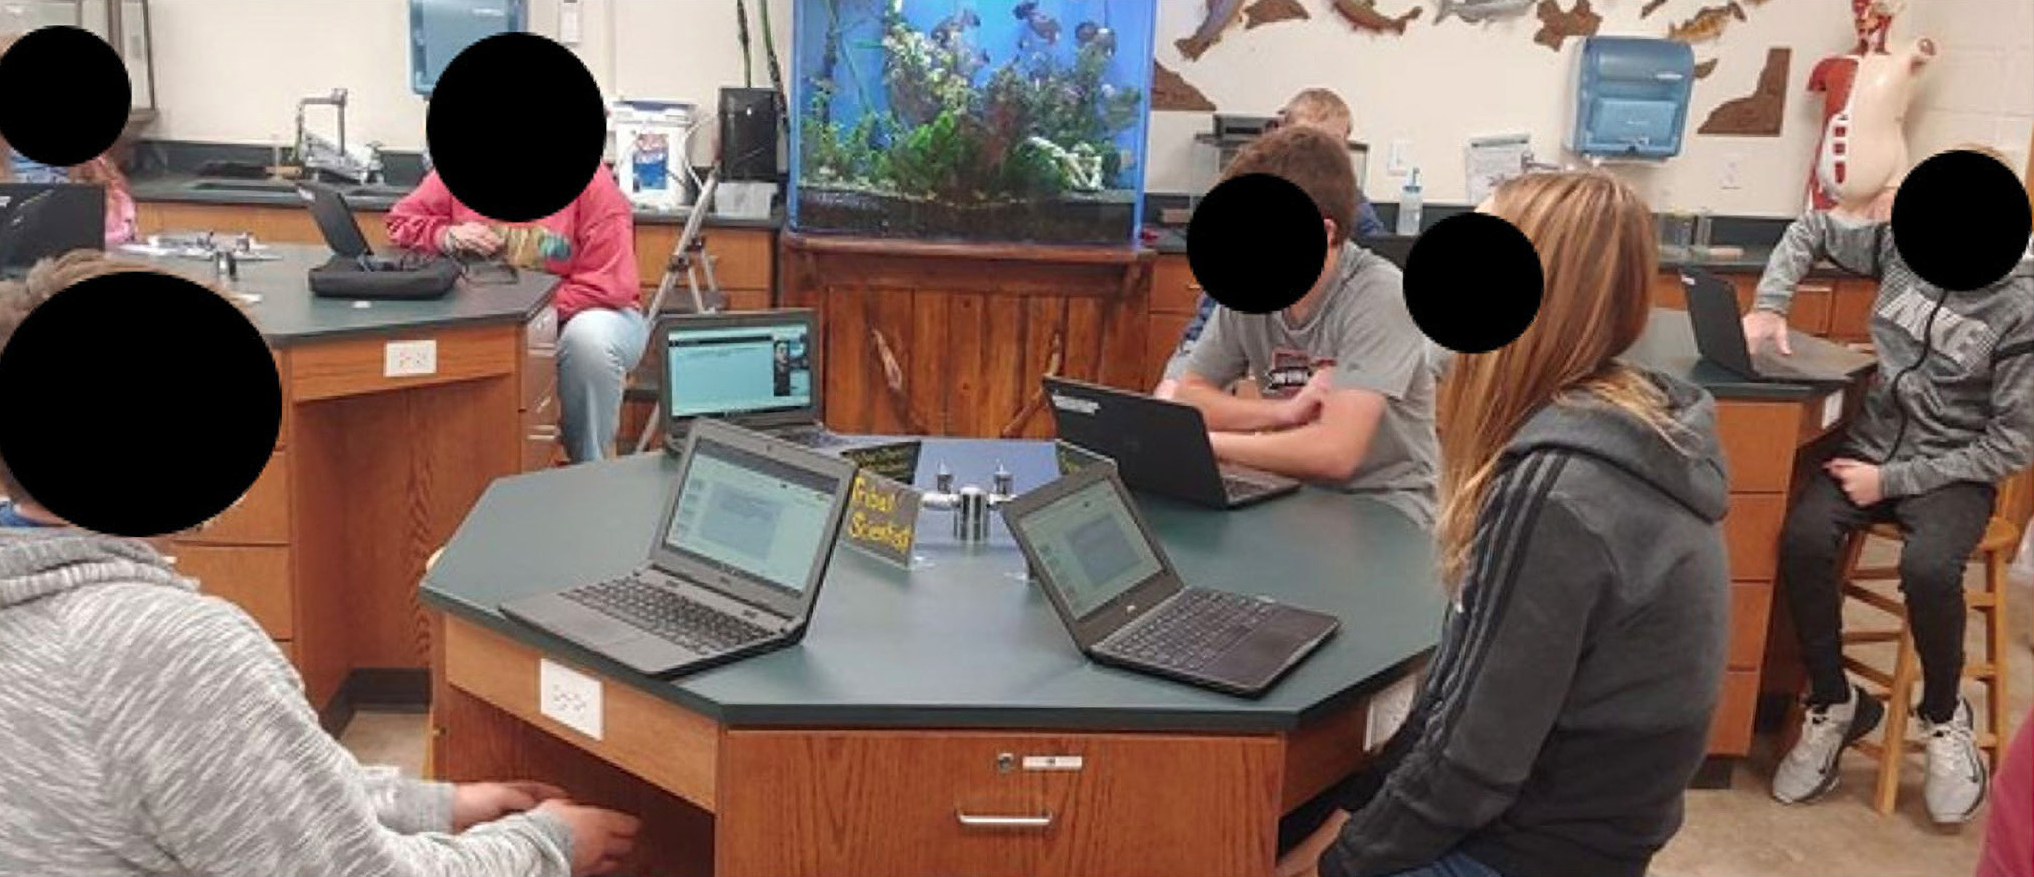
Classroom photo of pinwheel discussion showing one remote student and three in-person students during the COVID-19 pandemic.
- Elicit conversation from other students
- Don’t speak twice in a row
- Try to bridge comments together, i.e., “While I understand your perspective on …., we value …. and think this solution would accomplish both of our goals”
- Look for compromises and common ground
- Honor and respect diverse perspectives
The provocateur’s role was to facilitate the discussion as the Chief would and try to find common ground. I facilitated the discussion by listening and guiding students if they needed help. Groups could also call for timeouts to meet with their group in the outer circle as needed. I assessed students by ensuring that each student provided their group’s perspective during the pinwheel, provided counterpoints, invited others into the conversation, and showed consideration of other perspectives.
Conclusion
This unit provided many connections to NGSS life science performance expectations, practices, and crosscutting concepts, while using culturally responsive pedagogy. The real-world and place-based context of this lesson, along with the two lenses of Indigenous science and western modern science, provided an opportunity for students to consider multiple perspectives while solving problems. Students learned about the introduction of an invasive species that caused an entire ecosystem to crash. The concept of invasive species and their complex effects on ecosystems could be connected to many ecosystems around the world. Likewise, the practice of considering multiple perspectives and values is also a skill that could be utilized in many different contexts. Using culturally responsive pedagogy such as pinwheel discussions, which are akin to talking circles, can be a way for all students to explore these contrasting viewpoints and find common ground. Finally, learning oral tradition stories, as was done at the beginning of the lesson, creates a space where students can learn about the rich, storied histories and cultures of American Indian tribes.
Most of all, this lesson taught students that when decisions are being made, all stakeholders should have a seat at the table, and that all of their perspectives are valuable. All students should be able to see themselves in science; American Indian students should be able to see science from perspectives that are relevant to them. Students who relate more to western science should have opportunities to learn about, value, and respect Indigenous science.
Online Connections
Tables 1–9: https://www.nsta.org/sites/default/files/journal-articles/TST89-6/rost_tables.pdf
Linda Rost (rostl@baker.k12.mt.us) is the 2020 Montana Teacher of the Year, a national finalist, and the 2023 NEA Foundation Award for Teaching Excellence recipient for Montana. She teaches high school science at Baker High School, Baker, MT.
Biology Crosscutting Concepts Curriculum Disciplinary Core Ideas Environmental Science Equity Inquiry Instructional Materials Life Science Multicultural NGSS Pedagogy Science and Engineering Practices Teaching Strategies Technology