
feature
Arctic Feedbacks: Not All Warming Is Equal
Investigating Earth’s climate system to explain the amplified warming in the Arctic
The Science Teacher—March/April 2022 (Volume 89, Issue 4)
By Jonathan Griffith and Margaret Kozick-Kingston
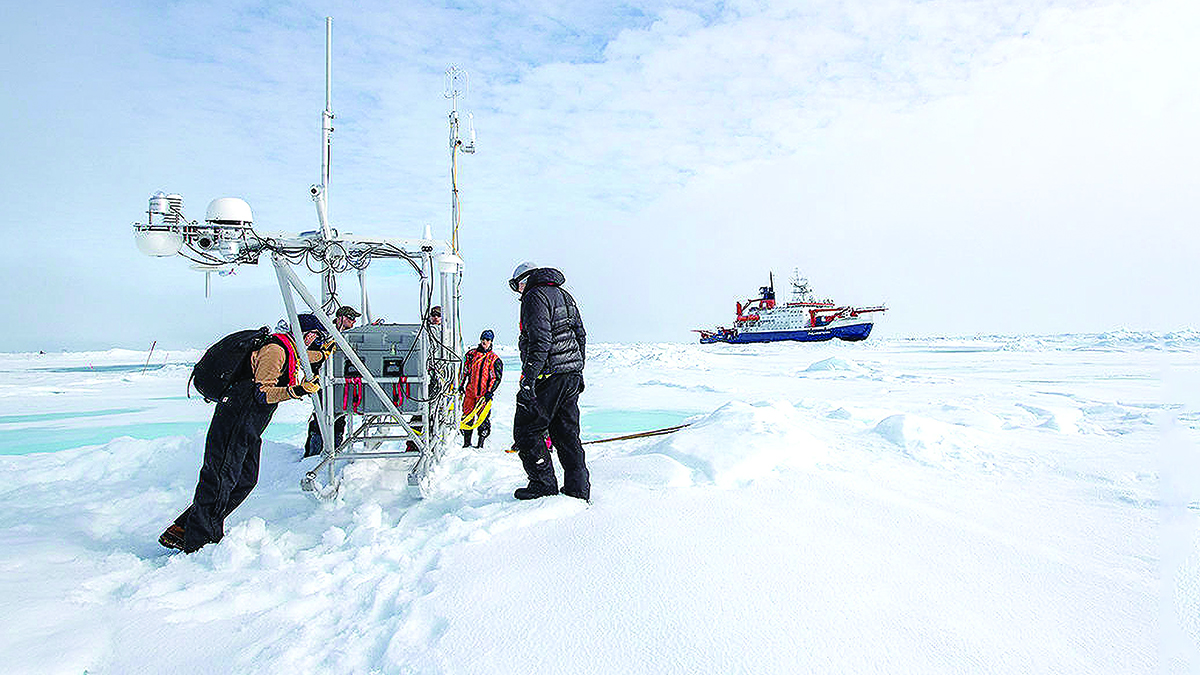
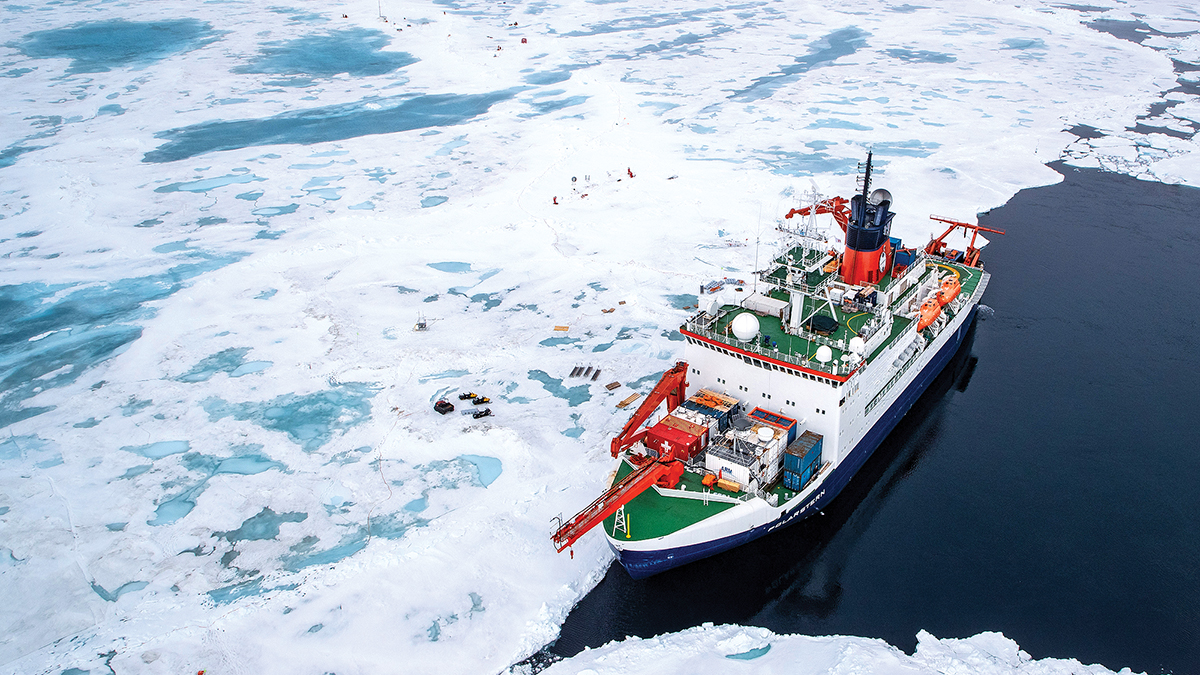
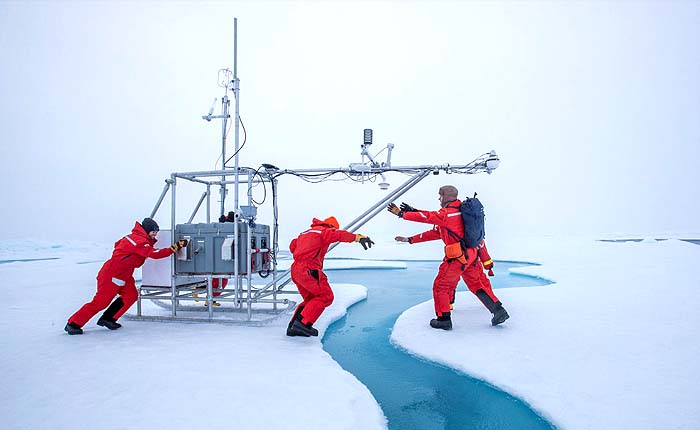
Why would hundreds of scientists from around the world intentionally freeze a ship in Arctic sea ice for an entire year, braving subzero temperatures and months of polar darkness? This may sound like a fictional adventure movie plot, but from September 2019 through October 2020, the MOSAiC (Multidisciplinary drifting Observatory for the Study of Arctic Climate) Arctic research expedition did just this. Currently, the Arctic is warming twice as fast as the global average (a phenomenon known as Arctic amplification) and due to a lack of observations, there is considerable uncertainty in climate models projecting the Arctic climate of the future (Hodson et al. 2012). The MOSAiC expedition’s goal was to better understand the changing Arctic climate system by freezing a ship in sea ice where it would drift with the ice across the Arctic while scientists studied ocean, atmosphere, and sea ice processes. This article describes a 15-day model-based inquiry (MBI) unit on Earth’s systems that investigates the amplified warming in the Arctic (see Online Connections to view the freely available “Arctic Feedbacks” unit).
Model-based inquiry is an instructional framework designed around the construction, revision, and testing of models by students to make sense of and explain a phenomenon (Windschitl et al. 2008). Focusing on explaining natural phenomena provides a specific context for students to learn and apply scientific understandings to and can help engage students in scientific practices (Passmore et al. 2013). Our Earth’s systems MBI unit is connected with the Next Generation Science Standards (NGSS Lead States 2013) and incorporates elements of ambitious science teaching (see Online Connections). We anchored the unit with a puzzling and engaging phenomenon that scientists are actively trying to explain, Arctic amplification. The unit addresses the following question: Why might the Arctic be warming twice as fast as the rest of the world? The driving question allows students to investigate Earth’s energy budget, the electromagnetic spectrum, the greenhouse effect, and feedback loops. These topics, though common in Earth science classrooms, become more engaging and accessible when anchored by a phenomenon.
Lesson sequence
Throughout the unit, students work collaboratively to develop and revise models that reflect their ideas and understandings about the phenomenon. Students will refer to their models and other public records to independently construct an evidence-based explanation for why the Arctic might be warming twice as fast as the rest of the world. The unit is broken down into four phases (Figure 1) that have been adapted from the model-based inquiry framework. See Supplemental Resources for additional unit materials, including a detailed Unit Summary.
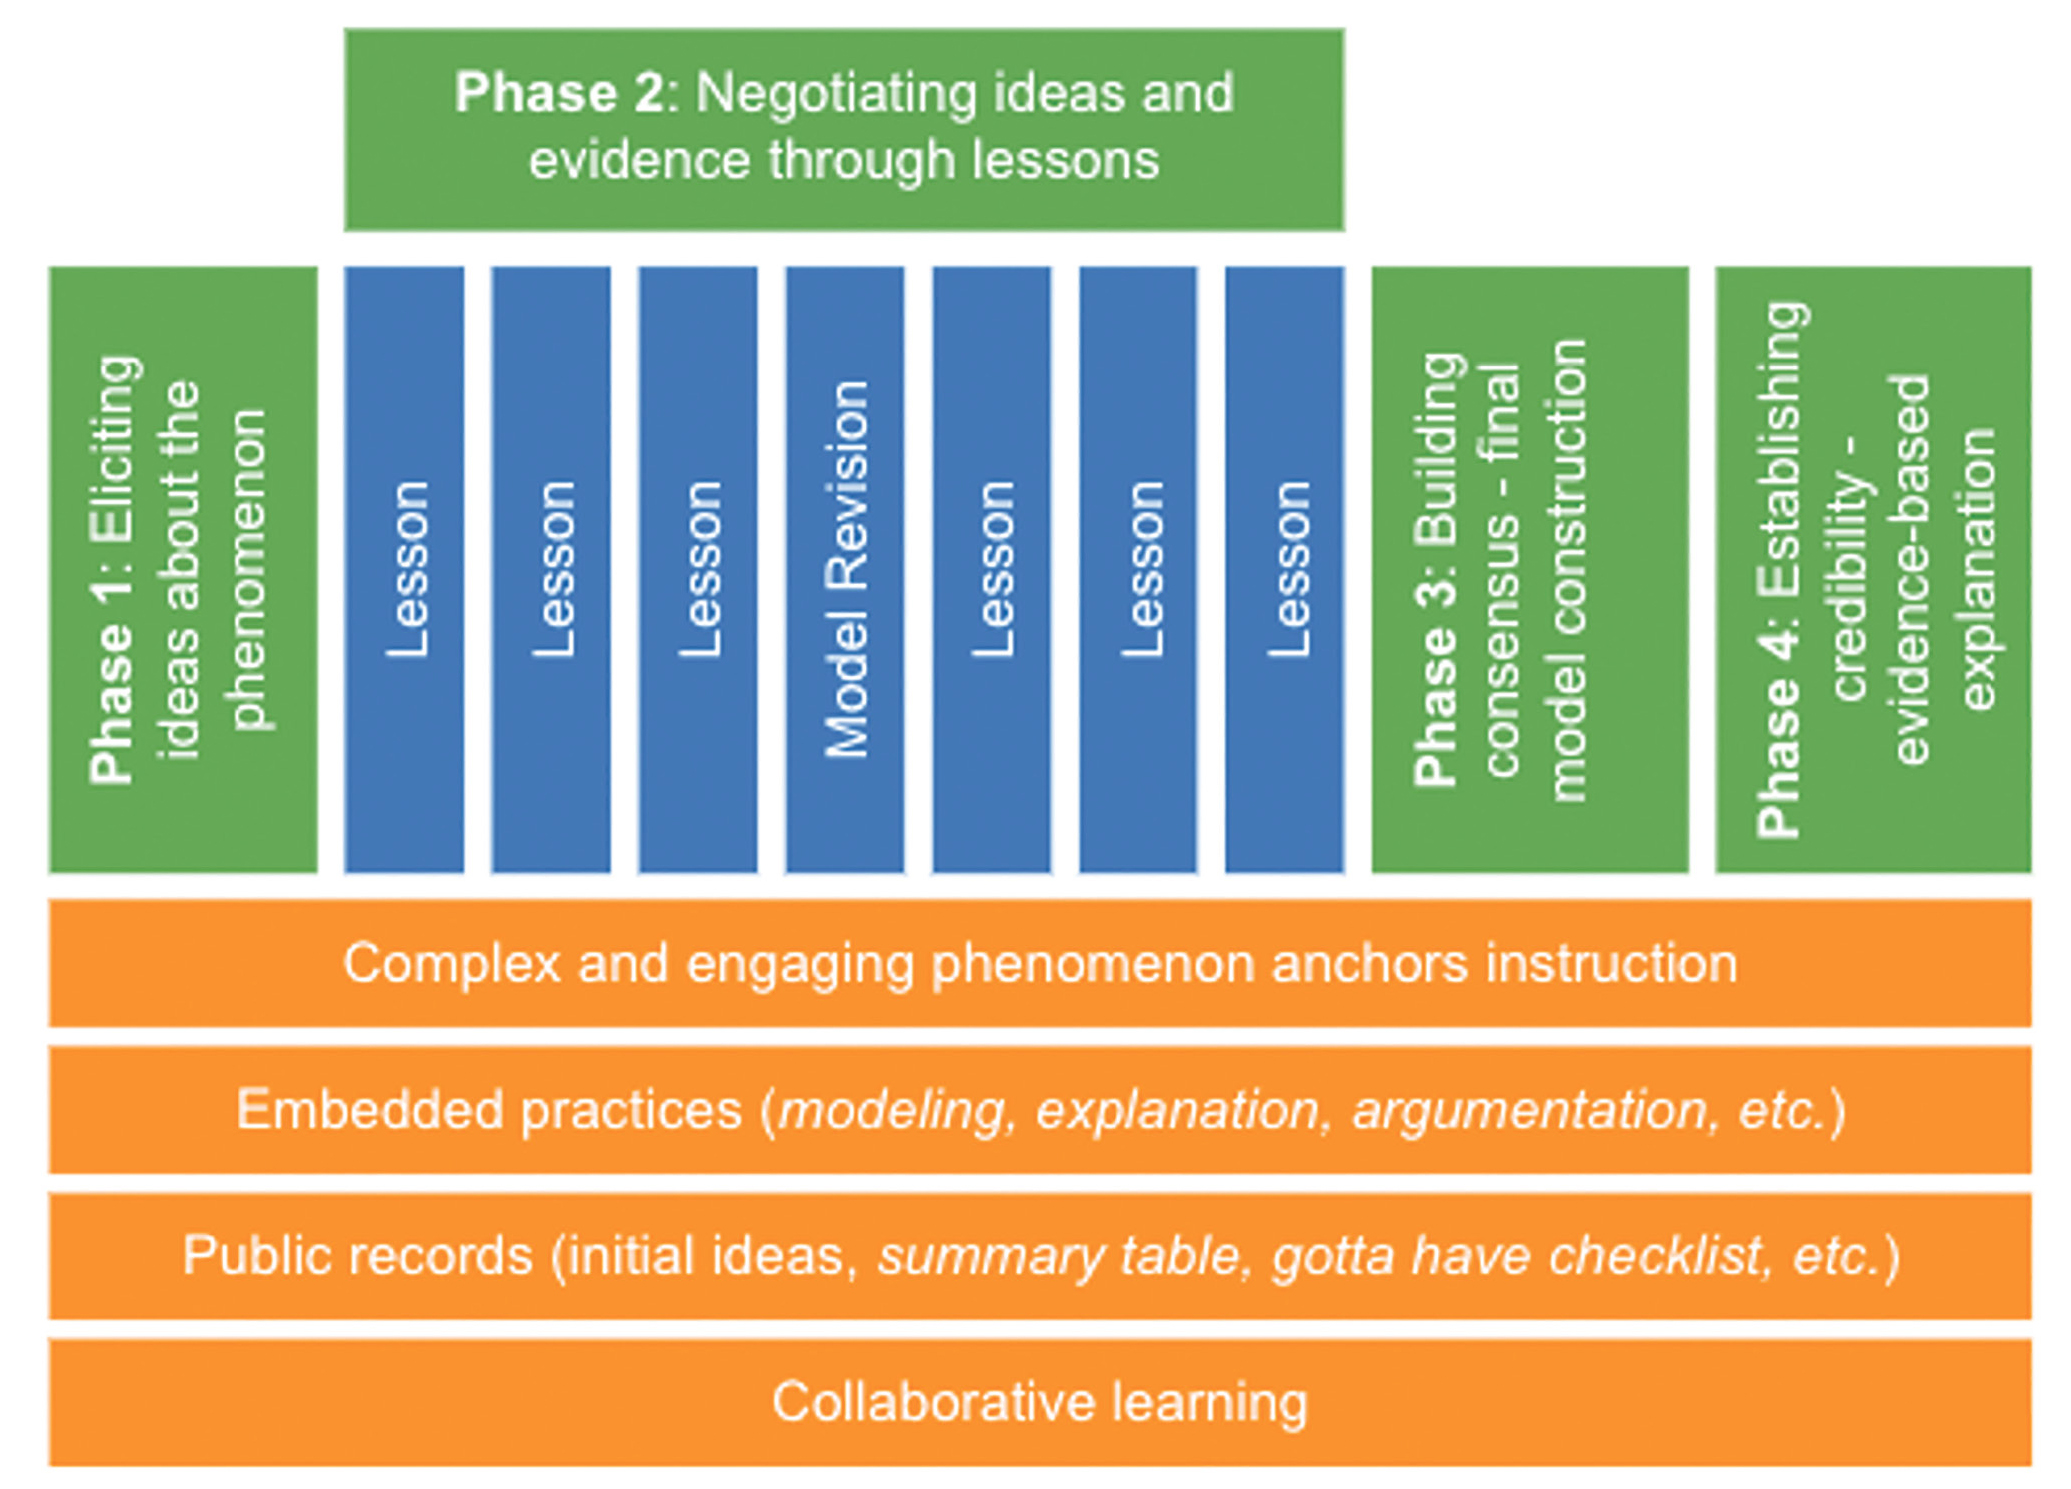
Basic overview of the unit with the four phases of MBI highlighted in green and elements of ambitious science teaching practices in orange.
Figure adapted from Model-based inquiry (see Online Connections)
Phase 1: Eliciting ideas about the phenomenon
The first step in a MBI unit is to introduce the anchoring phenomenon. Students watch a NASA data visualization showing changes in global temperature anomalies from 1880 to 2021 and identify patterns in global warming (see Online Connections).
Then, students are introduced to the driving question, “Why might the Arctic be warming twice as fast as the rest of the world?” and work in pairs to create a list of initial ideas. Through a facilitated discussion, student ideas are added to an “Initial ideas” public record (e.g., large poster, Google Doc, or Google Jamboard), which represents a summary of student thinking/learning (example, Figure 2). Throughout the unit, this public record is referenced and revised as evidence is gathered and new learning takes place.
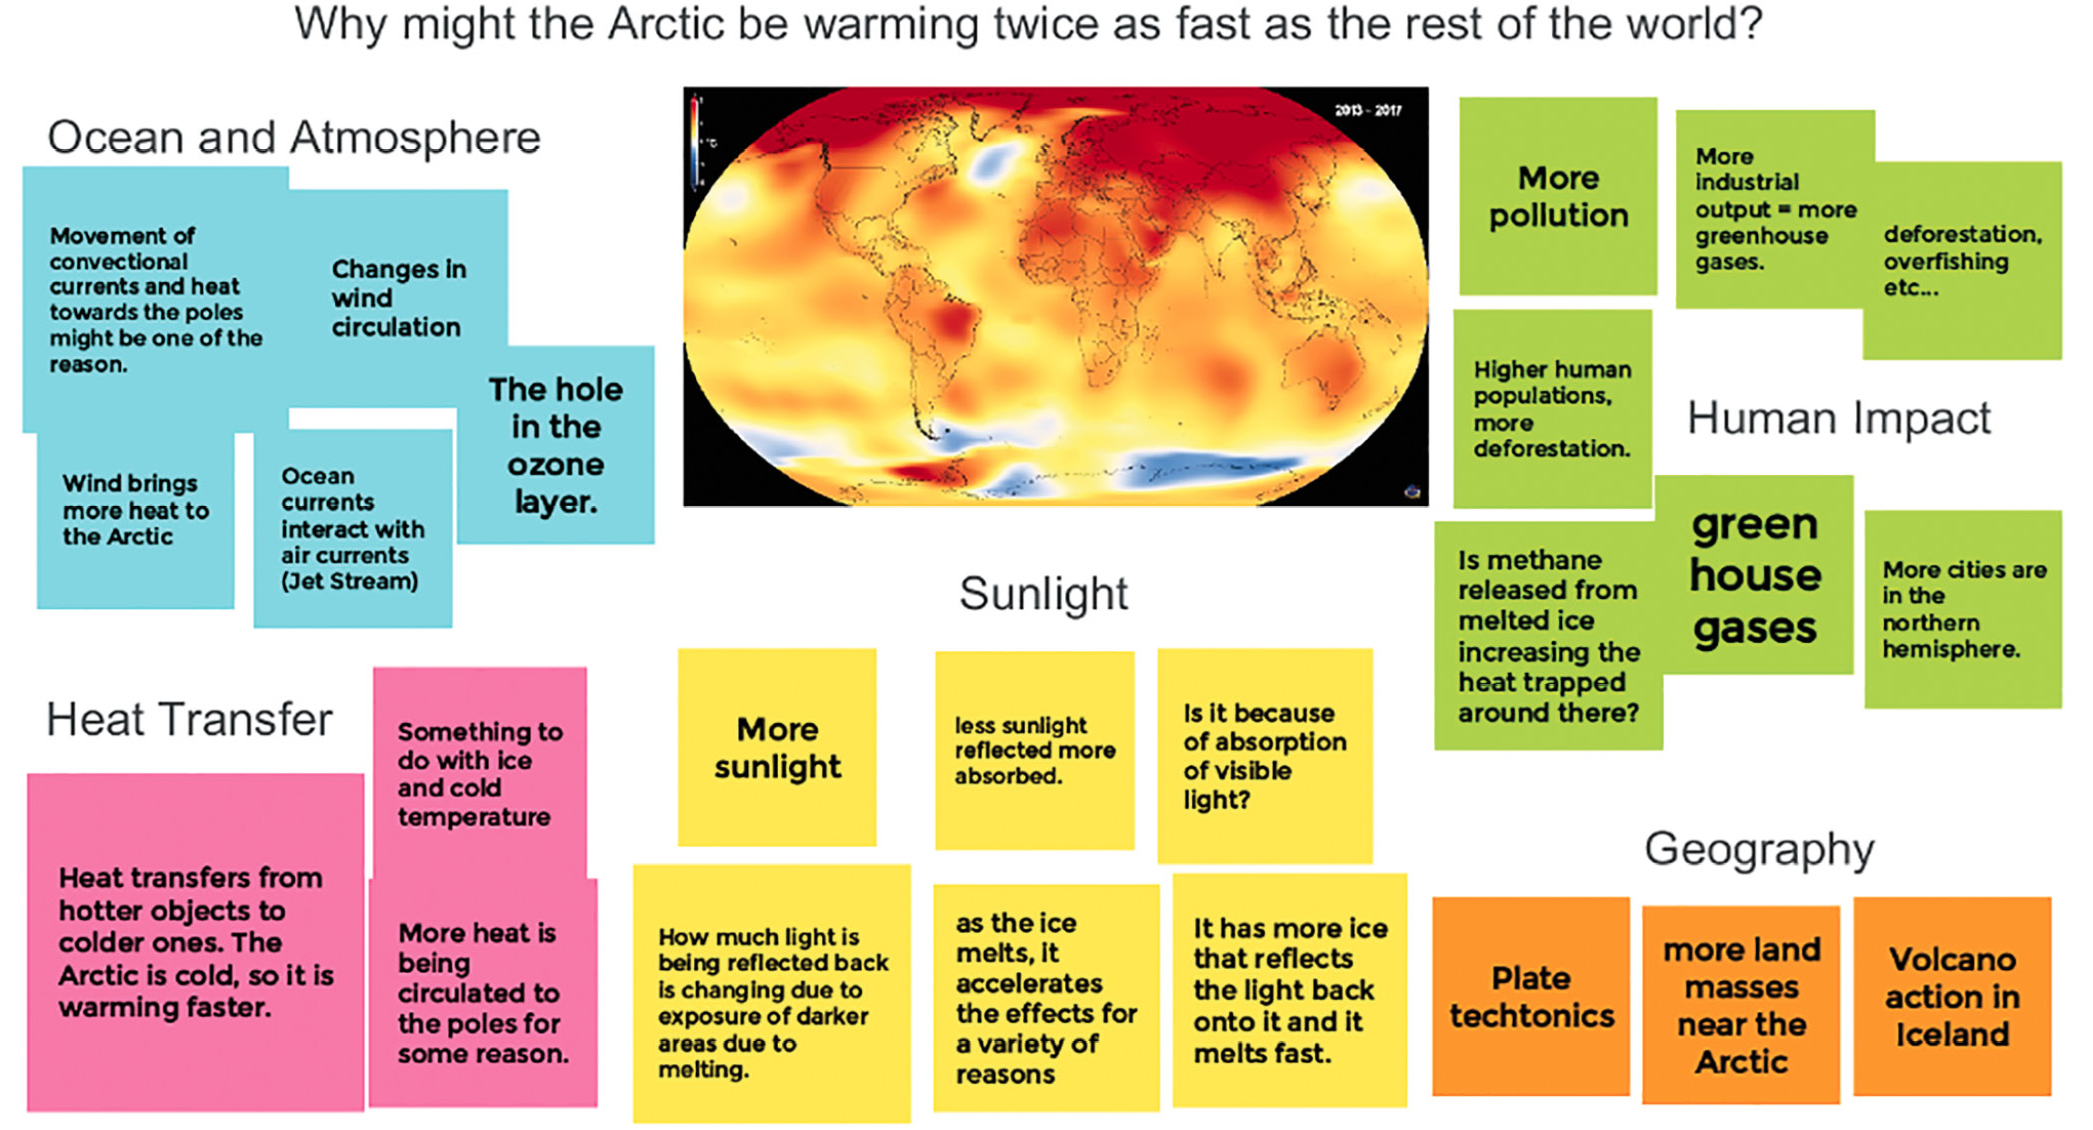
Example of student “Initial ideas” public record.
During the discussion, all student ideas are respected and valued. The teacher should press students to explain their thinking, but refrain from correcting misconceptions or partial understandings. Encouraging students to respond to one another (comparing, testing, and changing ideas in response to new evidence) helps them evaluate and refine their thinking at the community level (Campbell et al. 2016).
Students then form groups of two to three to collaboratively construct their initial descriptive models (example, Figure 3) representing the phenomenon by considering the following questions:
Example of an initial student model of the phenomenon.
Student groups share their descriptive models through a gallery walk where each group is given sticky notes and required to provide constructive feedback when reviewing their peers’ work. Encourage students to compare their own models with others from the class.
- Are the models similar? Different? How?
- Do the evidence or reasoning from another group’s model make you rethink any components of your own?
If time allows, individual groups can revise their initial models to incorporate ideas acquired during the gallery walk. Student ideas generated during Phase 1 are important resources that act as a stepping-stone to future lessons and experiences that will build their understanding of Earth’s systems (Campbell et al. 2016).
Virtual Teaching Strategies
- Zoom can be used as a main collaborative tool with breakout rooms whenever the lesson calls for group work.
- A shared Google Slides presentation could be used for students to upload or use Google Drawings for their initial models with each student required to give positive or constructive feedback through the Google comment feature with the help of sentence frames.
- Another option would be to use Jamboard, which provides students the opportunity to create models at their own pace and to use the sticky note tool to leave comments on each other’s models/frames.
Phase 2: Negotiating ideas and evidence through lessons
Phase 2 makes up the majority of the unit and consists of seven lessons (lessons 2–8) designed to support students’ ongoing changes in thinking as they relate to Earth’s dynamic and interconnected system. Student learning in the context of the anchoring phenomenon is recorded in a whole-class summary table that is updated at the end of each lesson (see Summary Table—Online Connections). As part of lesson 2, students describe parts of the electromagnetic spectrum in the context of Earth’s energy budget by constructing models using specially designed graphics. Through this activity, students discover that when Earth’s energy budget is balanced, the amount of shortwave radiation (sun) coming in is equal to the amount of longwave energy (heat) going out. Students are then presented with observational data demonstrating a rise in global temperatures, evidence of an imbalance in Earth’s energy budget. Students are then given time to consider the “Initial Ideas Public Record” and discuss which of their ideas might contribute to this imbalance.
Virtual Teaching Strategies
- Add graphics to a Google Slide for students to manipulate and demonstrate their understanding of Earth’s energy budget processes.
As part of lesson 3, students describe the greenhouse effect and its impact on Earth’s energy budget. Students engage with a Molecules and Light PhET simulation (see Online Connections) to explore the relationship between shortwave/longwave energy and atmospheric gases with the goal of identifying which of these atmospheric gases are greenhouse gases. Students then predict how changes in greenhouse gas concentrations affect global temperatures, which is confirmed/refuted with observational data sets. The goal of this lesson is to demonstrate that an increase in atmospheric greenhouse gas concentrations (e.g., CO2, H2O, CH4) is causing more outgoing longwave energy (heat) to be absorbed and reemitted in Earth’s atmosphere (greenhouse effect), resulting in an increase in global temperatures. However, greenhouse gas concentrations are not greater in the Arctic than in other parts of the world and therefore the greenhouse effect alone does not explain Arctic amplification.
Virtual Teaching Strategies
- A “Lesson 3 Virtual Slide Model” (see Supplemental Resources) was created for students to directly tie the molecules in the PhET simulation to the greenhouse gases in our atmosphere. In this exercise, students created at least two new textboxes to explain the behavior of the atmospheric gases when they interact with longwave and shortwave energy.
In lesson 4, students visit MOSAiC expedition field sites in a 360-degree virtual tour (see Online Connections) and analyze authentic data sets to explore how changes in the amount of energy coming in (shortwave) and going out (longwave) might be contributing to amplified warming in the Arctic. Students discover that the amount of incoming shortwave energy the Arctic receives has remained relatively constant over the past two decades, while the amount of outgoing longwave energy from the Arctic has increased significantly, an observation that seems to be related to an increase in Arctic temperatures (Figure 4).
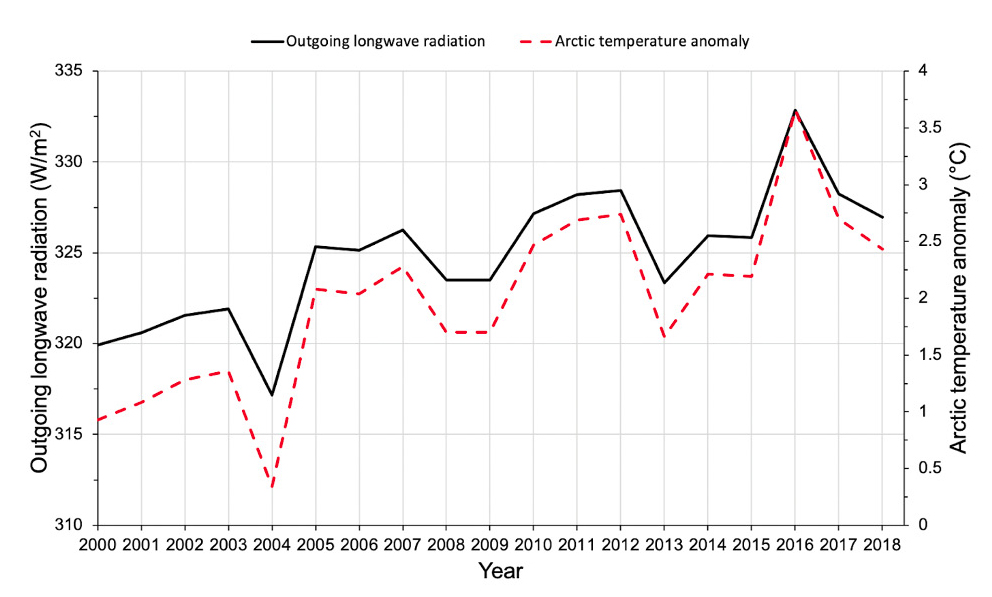
Outgoing longwave radiation from the Arctic (black line) compared with Arctic temperature anomalies (dashed line) from 2000 to 2018.
Virtual Teaching Strategies
- The graphing exercises are great opportunities to teach Google Sheets (YouTube tutorials are provided in teacher guides), which can go further into scaling and evaluating if all necessary components are present in the graph.
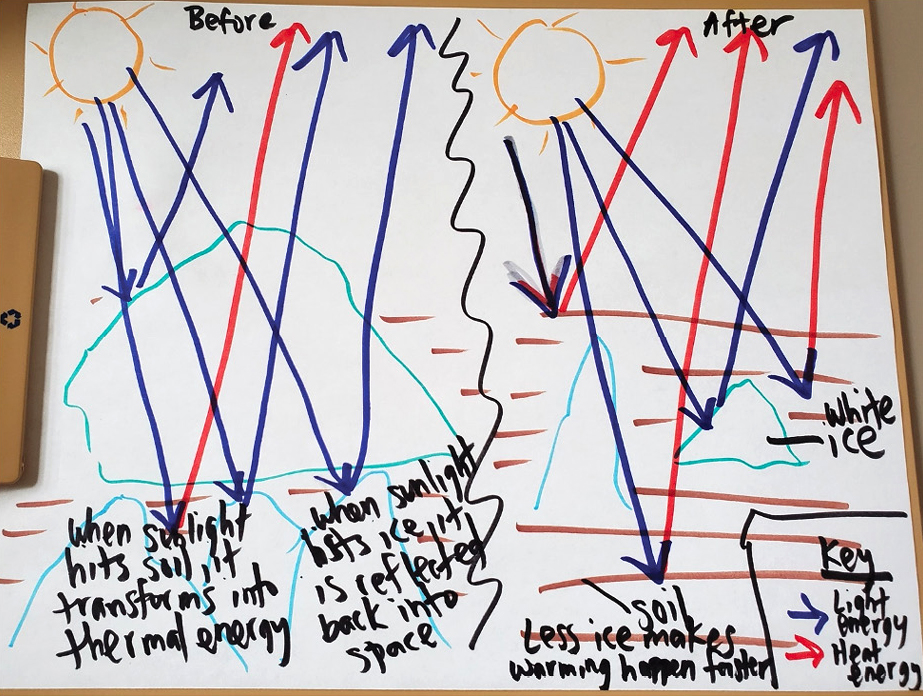
In lesson 5, student groups revise their initial ideas, incorporating new concepts and evidence gathered from previous lessons (Figure 5) into revised descriptive models (example, Figure 6). Students are encouraged to use academic vocabulary in their model revisions such as Earth’s energy budget, shortwave energy, longwave energy, and the greenhouse effect. The teacher should be prepared with back-pocket questions, which are prompts that probe for deeper understanding and require students to cite activities as evidence of learning. The revised model is a tool to make students’ thinking visible and help generate new ideas.
Concepts from lessons 2–4 as they relate to the phenomenon.
Mid-unit understandings
- Rising atmospheric CO2 concentrations are responsible for increasing global temperatures (enhanced greenhouse effect); however, the greenhouse effect alone does not explain the amplified warming in the Arctic.
- The amount of incoming shortwave energy from the Sun to the Arctic has not changed over the past two decades.
- The amount of outgoing longwave radiation emitted by the Arctic has increased over the past two decades.
- Rising Arctic temperatures appear to be related to an increase in the amount of longwave radiation (heat) emitted by the Arctic. (This becomes the focus of lessons 6–8).
Data source(s): Outgoing longwave radiation and Arctic temperature anomaly data from NOAA (see Online Connections).
Example of a revised model of the phenomenon after several lessons.
Virtual Teaching Strategies
- Jamboard could be used again with another round of constructive or positive feedback from the students.
The focus of lessons 6–8 is for students to determine factors contributing to the rise in longwave energy (heat) being emitted from the Arctic. Students first explore the concept of albedo using the Albedo: A Reflectance app (see Online Connections) to measure the albedo of different-colored surfaces and discover that lighter surfaces have a higher albedo (reflect more shortwave energy) than darker objects. Then, during a rate of ice melt demonstration, students measure the rate at which ice melts when placed on light- and dark-colored surfaces (representing the sea ice and ocean, respectively). Through these engagements, students predict that a decline in sea ice would expose more of the darker ocean, which would result in more energy being absorbed (by the dark ocean) and lead to further melting of sea ice—a positive feedback loop known as the ice-albedo feedback. Students test this prediction by graphing and analyzing empirical data of the Arctic’s sea ice extent, albedo, and temperature over the past two decades (Figure 7). These data support the ideas that (1) declining sea ice is causing the albedo of the Arctic to decrease, and (2) the Arctic’s decreasing albedo is associated with increasing temperatures in the region. Finally, students work in pairs addressing the following questions (see Answer Key: Lesson 8 in Supplemental Resources):
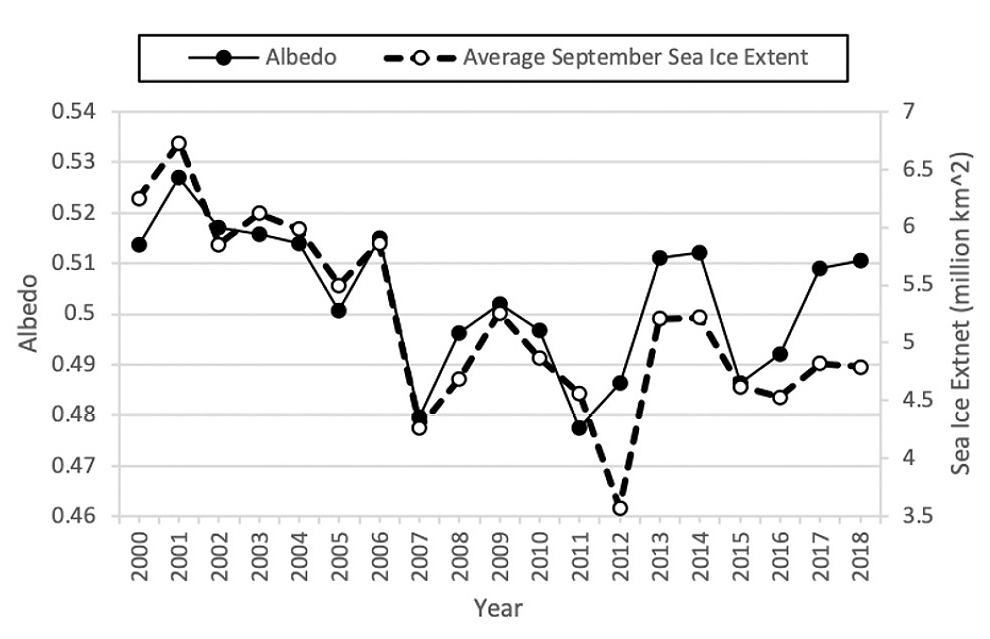
Changes in Arctic sea ice extent and albedo from 2000 to 2018.
- Why are global temperatures increasing?
- How have rising global temperatures affected Arctic sea ice?
- How has the decline in Arctic sea ice affected the albedo of the Arctic?
- What is the ice-albedo feedback and how has it contributed to amplified warming in the Arctic?
Virtual Teaching Strategies
- In areas where the type of tech is not reliable among students, a live demo of the albedo app can be very beneficial on Zoom with students choosing the different surfaces to test and predicting what the broad albedo will be.
- For the experimental setup of ice melting, students were required to post a picture of their setup under the procedure. Students designed their own experiment using available resources; students were told that the surface where the ice was placed must be the same type with a different color (i.e., black and white shirt, black and white concrete, etc.).
Phase 3: Building consensus—final model construction
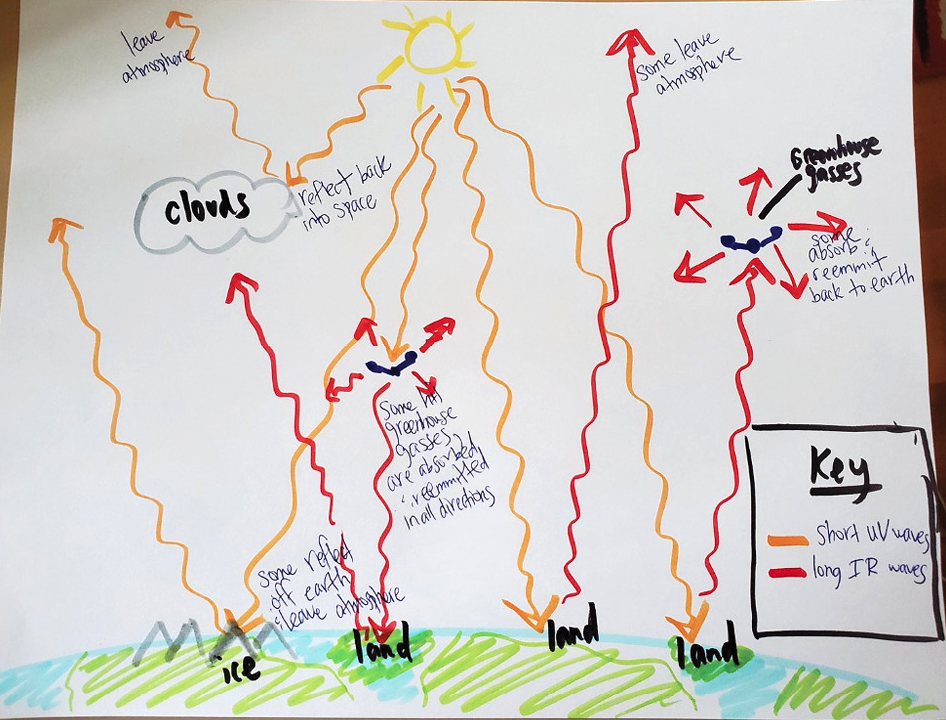
In lesson 9, students work in groups of two to three to reflect on their learning by answering questions designed to help connect the “conceptual dots” as they relate the phenomenon. Then, student groups construct their final descriptive model representing the anchoring phenomenon (example, Figure 8). Students are encouraged to refer to evidence (e.g., data sets, summary table, etc.) when constructing their final models. After the final models have been constructed and shared, the teacher facilitates the discussion and development of a “Gotta-Have Checklist,” a list of bulleted ideas, concepts, and evidence that the entire class agrees should be present in their final evidence-based explanations of the phenomenon (see the Gotta-Have Checklist in Supplemental Resources).
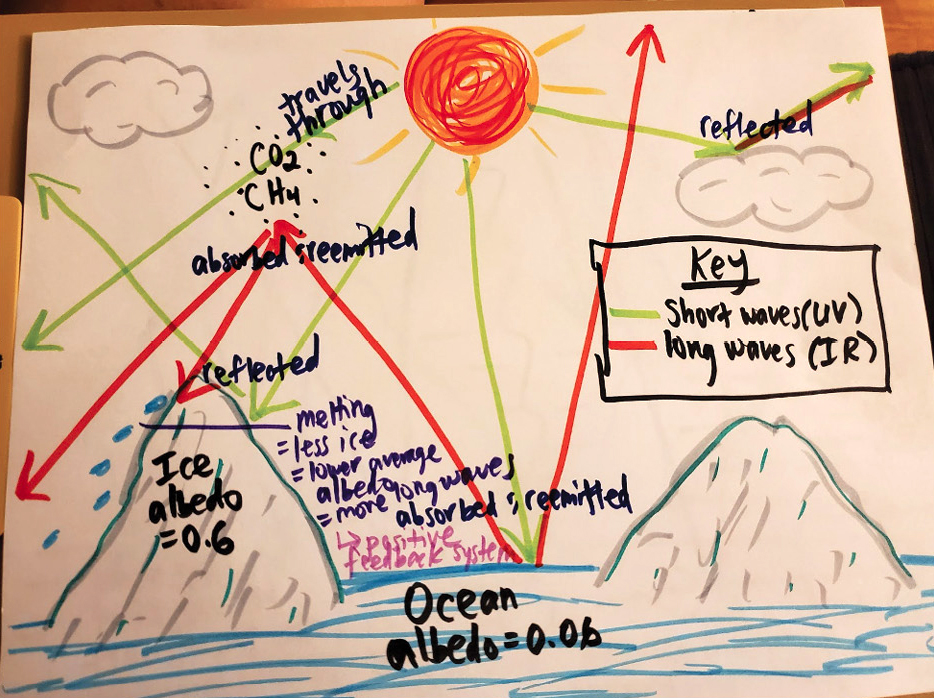
An example of a final model at the end of the unit.
Virtual Teaching Strategies
- Zoom breakout rooms and chat can help establish the common list.
Phase 4: Establishing credibility—evidence-based explanation
Students refer to evidence (e.g., Gotta-Have Checklist, data sets, Summary Table, etc.) and work independently to write an evidence-based explanation of the phenomenon. An evidence-based explanation incorporates three parts:
- the story of what happened,
- important science concepts necessary to explain what happened, and
- evidence of how we know each part of the explanation.
The evidence could be scientific/empirical (e.g., ice extent, albedo, temperature data sets) or the name of an activity, video, or simulation (e.g., Molecules and Light PhET simulation). Review the Supplementary Resources to find examples of final evidence-based explanations.
Virtual Teaching Strategies
- Emphasis was placed on the similarity to the process scientists go through to develop and support a concept through scientific methodology and modeling.
Conclusion
This article provides an example model-based inquiry unit in which students collaborate to construct, revise, and test models as they seek to explain a natural phenomenon, Arctic amplification. These lessons help build an understanding of Earth’s dynamic and interconnected system, placing student ideas about the phenomenon at the center of the unit.
Online Connections
Arctic Feedbacks unit: https://cires.colorado.edu/outreach/resources/unit/arctic-feedbacks-not-all-warming-equal/
Ambitious Science Teaching: https://ambitiousscienceteaching.org/
Model-Based Inquiry: https://sites.google.com/view/modelbasedinquiry/home?authuser=0
Global Temperature Anomalies From 1880 to 2021 Visualization: https://svs.gsfc.nasa.gov/4964
Molecules and Light PhET Simulation: https://phet.colorado.edu/en/simulation/molecules-and-light
MOSAiC virtual experiences: https://mosaic.colorado.edu/mosaic-virtual-expeditions
Albedo: A Reflectance App: https://play.google.com/store/apps/details?id=com.h2optics.albedo&hl=en_US
NOAA Radiation And Temperature Anomaly Data: https://psl.noaa.gov/data/gridded/data.gistemp.html
NASA Sea Ice Extent Data: https://climate.nasa.gov/system/internal_resources/details/original/1929_Arctic_data_1979-2019.txt
NASA Radiation Data: https://eosweb.larc.nasa.gov/project/ceres/ebaf-toa_ed4.1
Supplemental Resources
Unit Summary: https://bit.ly/3GXGxZ6
Final Summary Table: https://bit.ly/3oUTzRh
Lesson 3 Virtual Slide Model: https://bit.ly/3gVigZ9
Lesson 8 Answer Key: https://bit.ly/3Bq3jrH
Gotta-Have Checklist: https://bit.ly/3GW0KyO
Final Explanation: https://bit.ly/3gQvS86
Connecting to the Next Generation Science Standards: https://bit.ly/3IWxQjs
Jonathan Griffith (jonathan.griffith@colorado.edu) is is an education and outreach associate with the Cooperative Institute for Research in Environmental Sciences at the University of Colorado Boulder; Margaret Kozick-Kingston is a teacher at Mission Viejo High School, Mission Viejo, CA.
Climate Change Crosscutting Concepts Curriculum Disciplinary Core Ideas Earth & Space Science Environmental Science General Science Inquiry Instructional Materials Labs Learning Progression Lesson Plans NGSS Pedagogy Phenomena Three-Dimensional Learning