
feature
Visualize Your Pulse With Physical Computing
Turn on the flashlight and camera on your smartphone. Put your finger over the light and watch as the light changes with each beat of your heart. You can see your pulse in real time (see Figure 1). What is a pulse? Every time your heart beats, blood is pumped through your circulatory system producing a rhythm, which is the pulse. The rhythm is a signal we can measure. First, there is the lub or systole (SIS-toe-lee), which is the point of highest pressure in a heartbeat, and then your heart relaxes and refills with blood during the dub or the diastole (die-ASS-toe-lee).
Index finger held over smartphone light.
So how does light equal blood flow? When light enters the skin, the blood in the capillaries absorbs some light and reflects some back. When blood volume in the capillaries is highest during the systole, more light is absorbed, so less light is reflected. By putting a sensor right next to the light source, we can measure this change in light reflected from the capillaries. More light means less blood at that moment. If you shine light into a fingertip, you can measure these parts of the pulse as the volume of blood changes during the cycle. Green light works particularly well for this purpose (Kamshilin and Margaryants 2017).
In this three-day integrated 5E inquiry lesson that includes physics, engineering, and biology concepts, we will use physical computing and photoplethysmography to learn about our pulse. The main learning objective is to have students communicate how wave phenomena, like a pulse, can be analyzed using sensors, which is called physical computing. Physical computing is incorporated by having students collect data directly from their environment using sensors connected to a microcontroller, which can pass the data over to code running on a computer to be analyzed and visualized (Grillenberger and Romeike 2014). This lesson was piloted in two physics classes where students worked in small groups. Each group had an Arduino board and a single pulse sensor. The Arduino was attached to a laptop computer. Every effort was made to be sure student names were not connected to the collected data and that no student who was uncomfortable collecting biological data was coerced into doing so. The anonymized data was used for the group analysis. Although the content in this activity involves biological concepts, the course in which it was implemented was a physics course. The rubric and guiding questions reflect the physics content goals like understanding a repeating signal using data and using engineering concepts to address questions.
Photoplethysmography will be included by using technological devices that employ the principles of wave behavior and wave interactions with matter to transmit and capture information and energy (Figure 2). Photoplethysmography uses light to measure blood volume variation in a fingertip (Allen 2007). If we create a plot of brightness versus time, we have a photoplethysmogram (PPG). A PPG signal starts as a sharp rise to the systolic peak or point of maximum pressure in each heartbeat. The capillaries are flooded with excess blood. Then as the heart relaxes and refills, the blood volume in the capillaries drops. The waveform that results from visualizing the PPG has some distinct parts. Figure 2 shows one full beat of the first author’s heart from a typical PPG. A PPG signal is inherently a wave phenomenon with a known repeating pattern.
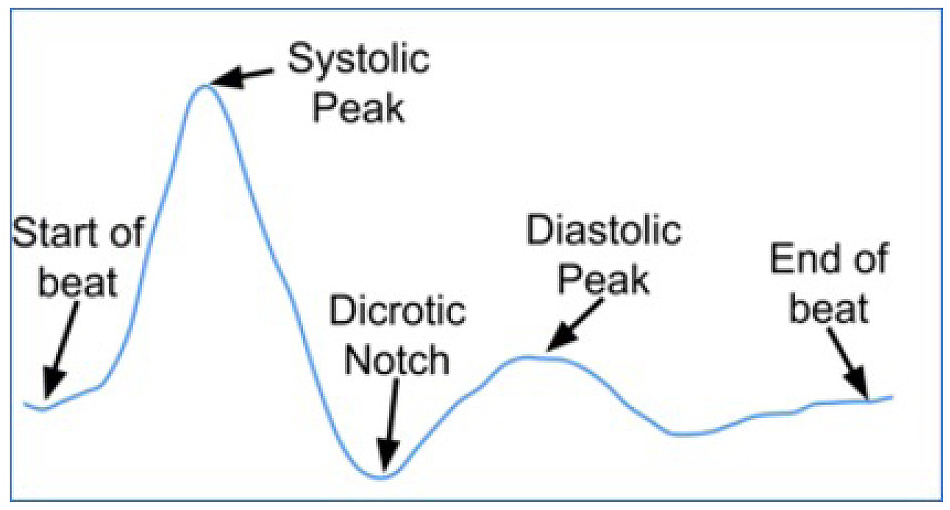
PPG with key features labeled.
Lesson materials
This lesson will require the following materials:
- Arduino Uno
- LED, breadboard, and resistor
- Pulse sensor
- Laptop computer with Arduino IDE (1 per group or pair). Available on Windows, macOS, and Chrome OS; Not iPad compatible
- Spreadsheet software
- Internet access is recommended to install the PulseSensor Playground library via the Arduino IDE
We recommend using the World Famous Electronics open-hardware pulse sensor, which works with various microcontrollers and is inexpensive (Murphy and Gitman 2018). Although many sensors can also be used for this lesson, we recommend the World Famous Electronics pulse sensor because it is the best device for this lesson. In addition, we recommend this device because the benefit of a ready-made pulse sensor for students is that the data is clean and ready for analysis once you get your readings into the computer. This lab was tested in class with the Arduino Uno and used student laptop computers (Figure 3). Arduino-compatible boards are available from a variety of vendors.
Arduino information.
What is an Arduino? These small computer-like boards were designed to be cheap and easy to replicate. Both the hardware and the software are open, meaning others can remix the bits and make something new and different. The philosophy behind the open source movement is that derived works are not only allowed but encouraged. Arduino hardware and software is published under a Creative Commons license. For more information about the open source movement and the Arduino philosophy, check out these links:
https://opensource.org/docs/osd
For example, Arduino-compatible boards are available for $18 per board at the time of this writing, with a discount for bulk orders. Visit www.adafruit.com/product/50 for more information. Visit www.adafruit.com/product/1093 for more information about purchasing the pulse sensor. The cost for a breadboard (www.adafruit.com/?q=breadboardandsort=BestMatch), LEDs (www.adafruit.com/product/4204), and resistors (www.adafruit.com/product/2780) for one table setup is around $6. If you need to buy all the parts, the total cost per group is about $40. Note that the entire activity can be completed by students with at least one Arduino board and one pulse sensor per group if the breadboards, LEDs, or resistors are not available.
Staying safe
Physical computing uses devices designed for classroom use. Danger from electric shock is almost as low as using a battery-powered calculator. Sometimes the boards, wires, and LEDs can have sharp points, but that is the biggest danger to students and teachers. Everyone should practice the same safety protocols used in any classroom physics activity.
However, this activity deals with gathering data about the human body. That means students should be allowed to opt out of using their data if they feel uncomfortable. Students should be allowed to work in groups such that no one person is the only source of data. Anonymize the data by using nonidentifying titles to help protect the data privacy of the learners. The activity is not about making a medical diagnosis but rather understanding how we use sensors to gather and visualize data about the human body.
Engage
Start the lesson by asking students what they know about their bodies. If necessary, prompt students to list organ systems and parts of the body. As students discuss, help them narrow the focus to the circulatory system. Try to guide them to identify heart rate and pulse. Then ask students what they know about their pulse and how it is measured. Initiate a KWHL chart on the board. As students discuss what they know about their pulse, write up the ideas under “K,” which is what they know.
After students have discussed what they know about the pulse, prompt students to use a light source, such as the flashlight from their smartphones, to observe their pulse. A good trick to doing this is having students make short videos of their pulses using a smartphone: Students push their index finger or middle finger up against the smartphone’s camera and keep the smartphone flashlight turned on. This technique works best in pairs. A smartphone works well because most have front-facing cameras and a bright light close by the camera. Holding a bright light behind a finger would also allow students to see the pulse change as the light gets brighter and dimmer with each heartbeat.
Ask students to share what they see. Prompt students to recognize they see their pulse. Ask students what causes their pulse and gather students’ prior knowledge about this topic. Add to the “K” column of the KWHL chart. Ask students to think about the many ways they can collect and analyze data on their pulse. Ask them why this information is important to know. Then, ask students what they want to know about their pulse. Write the questions down under the “W” column, representing what the students want to know. Some examples for guiding questions might be, “How much time do you think there is between your heartbeats based on what you see?” and “What does it mean that the light changes brightness in a very rhythmic way?”
Explore
Students will write some code during the Explore phase. We recommend the Arduino Integrated Development Environment (IDE) software, which is what programmers call the software used to write software. The PulseSensor Playground is a library from World Famous Electronics that can be installed directly from the Arduino IDE. Arduino libraries are written to handle a particular task or allow the use of a particular bit of hardware. Arduino libraries often come with a guide and some examples of using the code provided.
You can install the PulseSensor Playground in the Arduino software by clicking on the Sketch menu and selecting Include Library option, and then clicking the Manage Libraries option. Once the Library Manager appears, you can search for Pulse Sensor (no space) in the search box. If the library is already installed, you can choose to update it if there is a newer version. See the World Famous Electronics website for more images and videos about installing the PulseSensor Playground (https://pulsesensor.com/pages/installing-our-playground-for-pulsesensor-arduino).
The students load the code from the provided PulseSensor Playground and run it. Once the Arduino software is open and the PulseSensor Playground is installed, select File, then Examples, and then PulseSensor Playground, and select the GettingStartedProject. The code should now be loaded into the Arduino editor as shown in Figure 4.
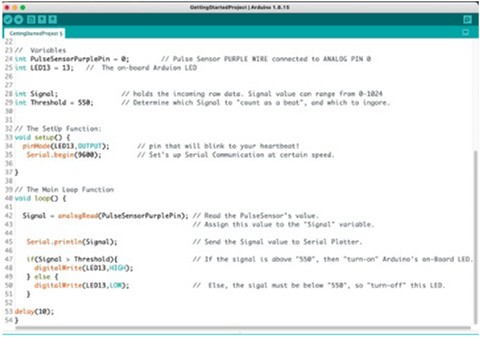
GettingStartedProject from PulseSensor Example Code.
Students will need a resistor and some wires. Using a breadboard makes placing LEDs, resistors, and wires easier, but is not required. We used a 330 W resistor like the 220 W mentioned in the GettingStartedProject example and whatever light-emitting diodes (LEDs) we had on hand. Figure 5 shows the completed circuit with the parts labeled. This part of the activity can be skipped if any of the components are not available. The idea here is to create a way to visualize a pulse with a blinking light. However, since the students will be gathering live pulse data in the next step, this part is not required as such.
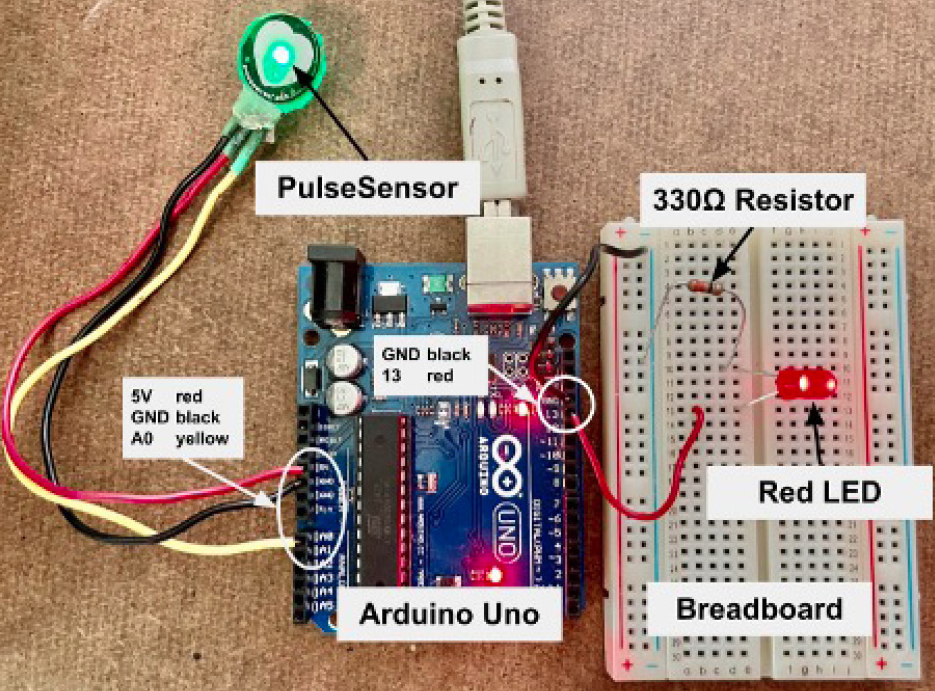
Completed pulse sensor circuit.
Using the pulse sensor
Students can now add the pulse sensor to the same circuit they built before. The sensor plugs directly into the microcontroller. When the pulse sensor is on, a small LED glows. Students place the sensor LED and camera against a finger (Figure 6). The index finger or middle finger works well. Challenge the students to collect the clearest signal. Have students sit down, keep still, and breathe normally.
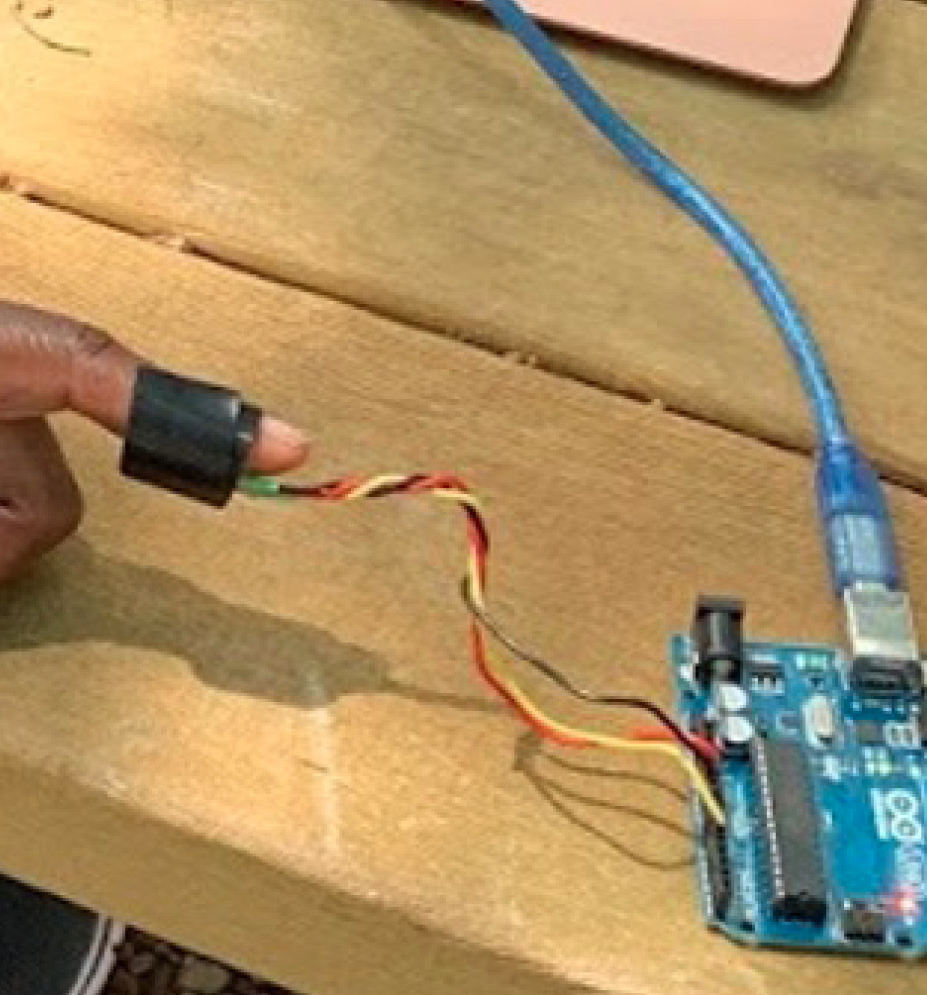
Finger with a pulse sensor attached.
Students need to modify the GettingStartedProject code to get data for their heartbeat. Look at line 42 in the code where the signal is gathered and printed, as shown in Figure 7. Add the current time in milliseconds to the print statement, and make sure to separate the two variables by a tab character, as shown in Figure 8. Having the tab makes it easier to copy and paste into a spreadsheet. The modified Arduino sketch is available via GitHub: https://git.io/Jyfy1.
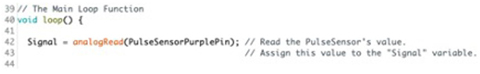
Line 42 shows the analogRead line near where students add code.
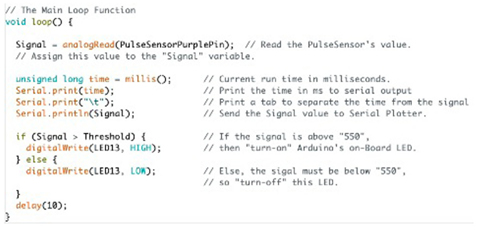
A modified version of GettingStartedProject from pulse sensor example.
Have small groups take the starter code and modify it to read a pulse and display the light data as numerical values. From the Arduino software, students can see the live data by selecting the Tools menu and selecting Serial Monitor; data is displayed live in a new window.
After the student teams have created their device, they should collect data for at least one minute. Once everyone is comfortable using the device and understands how to collect and interpret the data, challenge students to see if they can change their pulse. Have students discuss a few ideas to test. Have groups share their ideas and how they will test and write under “H” in the KWHL chart, which stands for how they will learn. For example, students can sit still and jump up and down. Encourage groups to have unique ideas to avoid repetition. Provide time for students to conduct their tests and collect data for a minute during the challenge activity.
Plotting your pulse
Once more than 10 seconds worth of data is available, students can click the Autoscroll button to turn off scrolling so they can use the mouse to highlight and select 10 seconds worth of data. Then ask students to copy and paste this data into a spreadsheet like Microsoft Excel or Google Sheets to generate a plot of the signal versus time. Prompt students to think about what should be plotted on the x-axis and y-axis. Next, guide them to place 10 seconds of clean data in which milliseconds should be on the x-axis and signal on the y-axis. Students can change the range of the displayed data to focus on one or two heartbeats. Let students know they will be showing their plots to their classes during the Explain phase. Some examples of guiding questions might be, “What sort of math functions have you used that resemble the features you see from your pulse plots?” or “What do the highest and lowest points of the plot represent in your pulse?” The typical pulse pattern should resemble a repeating set of high and low points, similar to what students might see in a trigonometry lesson about sine and cosine functions.
Explain
Start this section with a gallery walk. Have the teams prepare their plots to show others. Have one student stay at their original place to explain what they did and what they found to other groups that visit their station. After a while, switch out the person who stayed behind with another team member, so everyone has a chance to view other groups’ data. Ask teams to compare their method with other teams’ methods for measuring pulses and plotting data. An example plot of a heartbeat is shown in Figure 9. Students can find what parts of their heartbeat plot match the labeled heartbeat plot featured in Figure 2.
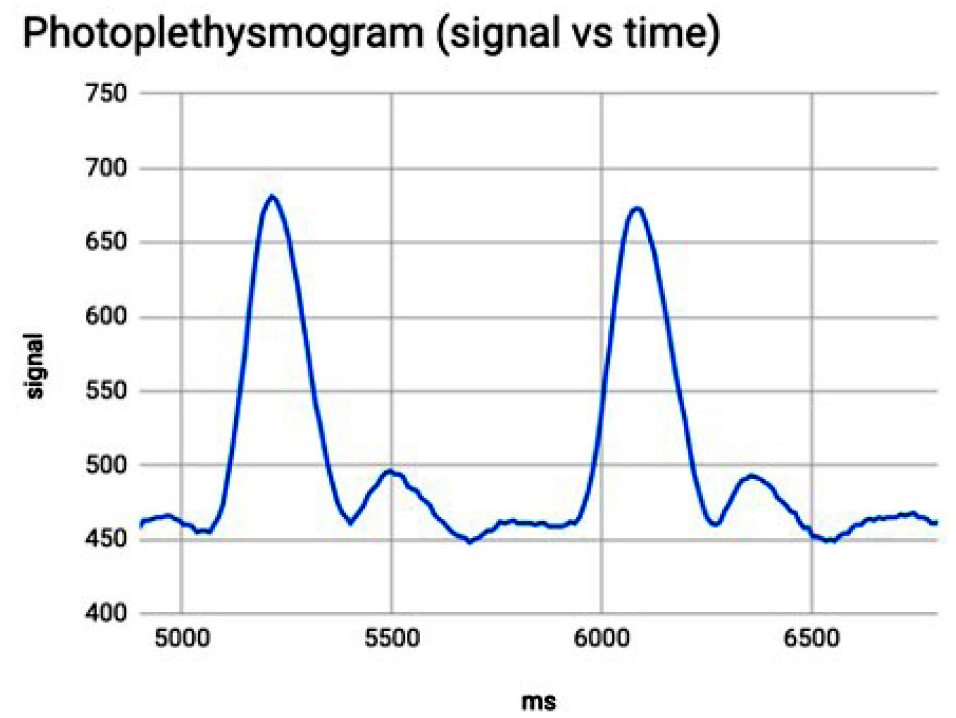
PPG plot from spreadsheet software.
Ask teams to collaborate and think of three to four things they have learned thus far. As they share, write down the ideas under “L” of the KWHL chart, which is what they’ve learned. The first three Es should complete the KWHL chart. Some guiding questions that might help students make sense of the different pulse plots they see are, “How are the maxima and minima different from one group to another?” or “Which pulse appears to be shortest and which appears to be longest?” or “Where in the pulse plot is the heart force at a maximum and where is the heart force at a minimum?”
Elaborate
Once you have ensured that the class has understood the main concepts from the first three Es of the lesson, ask them if they have ever heard of the interbeat interval (IBI). Collect ideas of what they know and write these new ideas under “K” on the KWHL chart. You can use a different color to show the KWHL from the first three Es versus the last two Es of this lesson. Guide students to review the data they collected during the Explore phase and understand that the time between peaks in a heartbeat is called the IBI (Van Gent et al. 2019). Students can use the spreadsheet to subtract one peak time from the next and store the IBI values in a new column. Ask students what they want to know about their interbeat interval and write it under the “W” column of the KWHL chart. Then ask students what they will do to calculate their heartbeat and write it under the “H” of the KWHL chart.
Calculating the heart rate
If we want to know how often something like a heartbeat happens, we need to find the frequency. Figure 10 shows how to calculate the beats per minute (BPM). Have students convert the IBI to BPM and store that in a new column. Divide 1 by the IBI, which is in milliseconds. Then multiply this by 1,000 to convert the IBI to seconds. Then multiply that quantity by 60 to convert it into BPM.
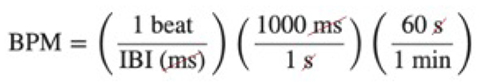
How to calculate BPM from IBI.
Have groups present their findings at the front of the class to share results with their peers. At the end of the Elaborate phase, ask students about the limitations of the devices they built. Write the groups’ findings and limitations under “L” to complete the KWHL for this part of the lesson.
Evaluate
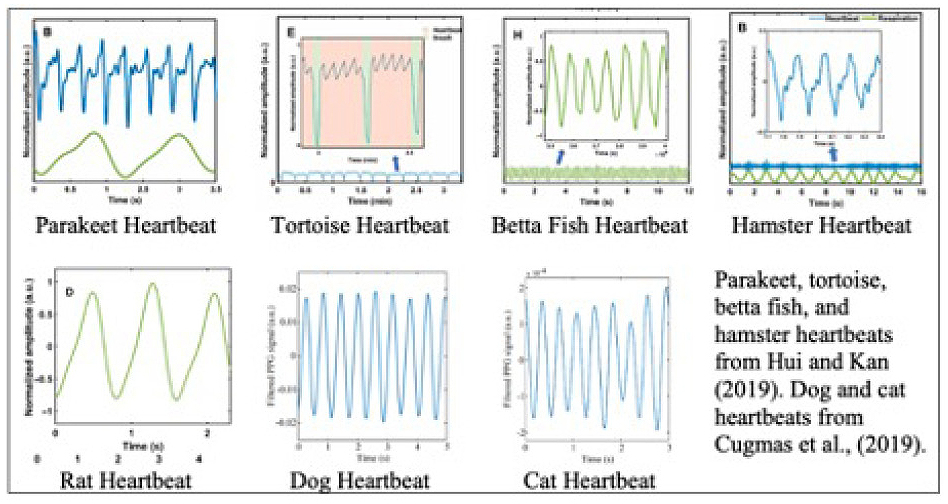
To evaluate, provide heart rate data from native wildlife found in the area to pairs of students. Figure 11 provides some examples of animals and their heartbeat signals. You can provide a list of possible animals to the students, but do not tell them which animal they have. For fun, have students guess what animal they have and explain why they think what they do. Ensure student understanding by checking that students can identify the heart rate using the interbeat interval. Challenge students to connect what they learned with relevance to real-life situations. The teacher can use the suggested rubric to evaluate student responses (Table 1; see Online Connections). Finally, have students guess what the animal is and let them know which animal’s data they analyzed.
Conclusion
This lesson highlights computational thinking as a fundamental science and engineering skill by allowing opportunities to visualize data, simulate phenomena, solve problems with computer code, and see how a body system functions. In this lesson, students engaged in planning and carrying out investigations; analyzing and interpreting data; and obtaining, evaluating, and communicating information. In addition, students use their bodies as a source for investigation, which makes learning more relevant to their own lives. When students experienced this lesson in a physics course, the interactive and direct nature of the data collection led to a very lively classroom experience. The idea is for students to use real data to connect how wave phenomena can lead to the meaningful application of physics in a biological context.
Online Connectioins
Table 1. Rubric for evaluating student responses: https://bit.ly/3RAWp9i
James Newland (jnewlan@uh.edu) is a doctoral student and Sissy S. Wong is an Associate Professor in the Department of Curriculum and Instruction in the College of Education at the University of Houston, Houston, TX.
Biology Computer Science Crosscutting Concepts Curriculum Instructional Materials Interdisciplinary Labs Makerspace Phenomena Science and Engineering Practices STEM Technology Three-Dimensional Learning High School