
feature
A Problem-Solving Experiment
Using Beer’s Law to Find the Concentration of Tartrazine
The Science Teacher—January/February 2022 (Volume 89, Issue 3)
By Kevin Mason, Steve Schieffer, Tara Rose, and Greg Matthias
A problem-solving experiment is a learning activity that uses experimental design to solve an authentic problem. It combines two evidence-based teaching strategies: problem-based learning and inquiry-based learning. The use of problem-based learning and scientific inquiry as an effective pedagogical tool in the science classroom has been well established and strongly supported by research (Akinoglu and Tandogan 2007; Areepattamannil 2012; Furtak, Seidel, and Iverson 2012; Inel and Balim 2010; Merritt et al. 2017; Panasan and Nuangchalerm 2010; Wilson, Taylor, and Kowalski 2010).
Floyd James Rutherford, the founder of the American Association for the Advancement of Science (AAAS) Project 2061 once stated, “To separate conceptually scientific content from scientific inquiry,” he underscored, “is to make it highly probable that the student will properly understand neither” (1964, p. 84). A more recent study using randomized control trials showed that teachers that used an inquiry and problem-based pedagogy for seven months improved student performance in math and science (Bando, Nashlund-Hadley, and Gertler 2019). A problem-solving experiment uses problem-based learning by posing an authentic or meaningful problem for students to solve and inquiry-based learning by requiring students to design an experiment to collect and analyze data to solve the problem.
In the problem-solving experiment described in this article, students used Beer’s Law to collect and analyze data to determine if a person consumed a hazardous amount of tartrazine (Yellow Dye #5) for their body weight. The students used their knowledge of solutions, molarity, dilutions, and Beer’s Law to design their own experiment and calculate the amount of tartrazine in a yellow sports drink (or citrus-flavored soda).
Beer’s Law
According to the Next Generation Science Standards, energy is defined as “a quantitative property of a system that depends on the motion and interactions of matter and radiation with that system” (NGSS Lead States 2013). Interactions of matter and radiation can be some of the most challenging for students to observe, investigate, and conceptually understand. As a result, students need opportunities to observe and investigate the interactions of matter and radiation. Light is one example of radiation that interacts with matter.
Light is electromagnetic radiation that is detectable to the human eye and exhibits properties of both a wave and a particle. When light interacts with matter, light can be reflected at the surface, absorbed by the matter, or transmitted through the matter (Figure 1). When a single beam of light enters a substance at a perpendicularly (at a 90° angle to the surface), the amount of reflection is minimal. Therefore, the light will either be absorbed by the substance or be transmitted through the substance. When a given wavelength of light shines into a solution, the amount of light that is absorbed will depend on the identity of the substance, the thickness of the container, and the concentration of the solution.
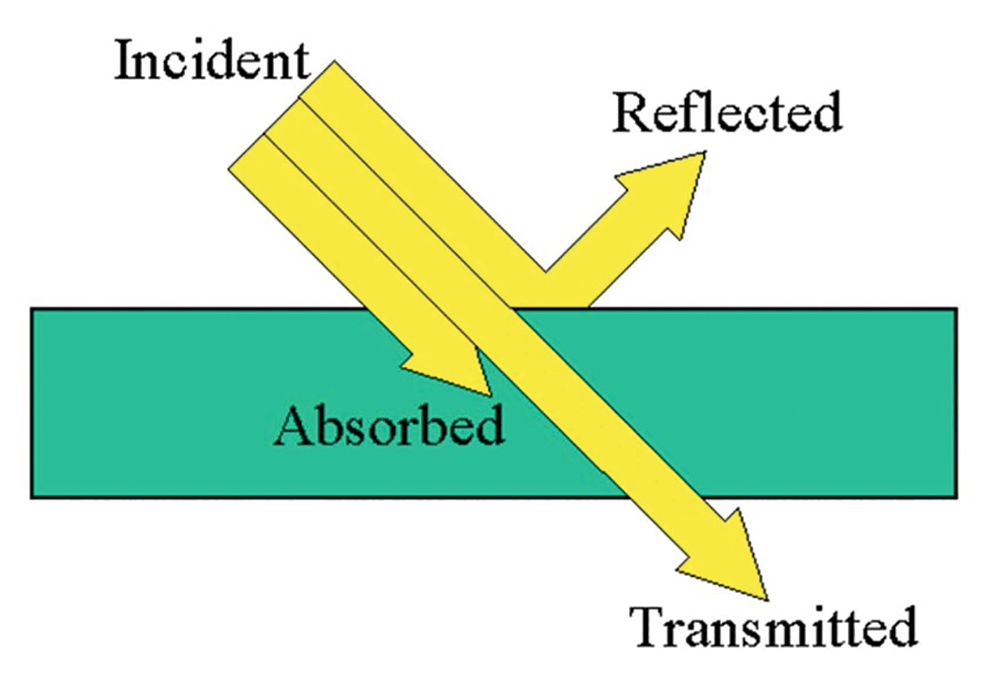
Light interacting with matter.
(Retrieved from https://etorgerson.files.wordpress.com/2011/05/light-reflect-refract-absorb-label.jpg).
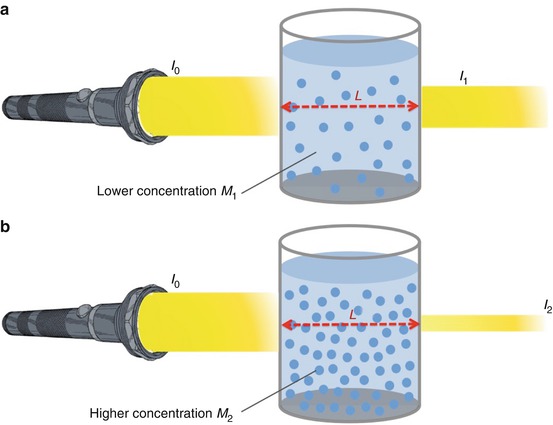
Beer’s Law states the amount of light absorbed is directly proportional to the thickness and concentration of a solution. Beer’s Law is also sometimes known as the Beer-Lambert Law. A solution of a higher concentration will absorb more light and transmit less light (Figure 2). Similarly, if the solution is placed in a thicker container that requires the light to pass through a greater distance, then the solution will absorb more light and transmit less light.
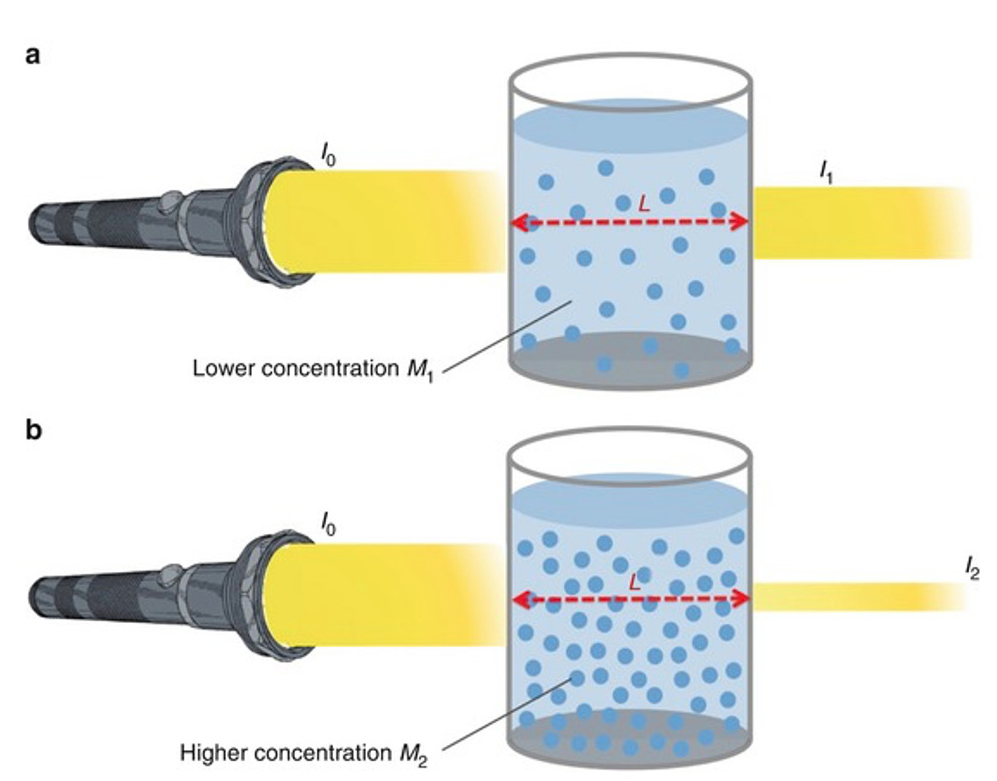
Light transmitted through a solution.
(Retrieved from https://media.springernature.com/original/springer-static/image/chp%3A10.1007%2F978-3-319-57330-4_13/MediaObjects/432946_1_En_13_Fig4_HTML.jpg).
Definitions of key terms.
Absorbance (A) – the process of light energy being captured by a substance
Beer’s Law (Beer-Lambert Law) – the absorbance (A) of light is directly proportional to the molar absorptivity (ε), thickness (b), and concentration (C) of the solution (A = εbC)
Concentration (C) – the amount of solute dissolved per amount of solution
Cuvette – a container used to hold a sample to be tested in a spectrophotometer
Energy (E) – a quantitative property of a system that depends on motion and interactions of matter and radiation with that system (NGSS Lead States 2013).
Intensity (I) – the amount or brightness of light
Light – electromagnetic radiation that is detectable to the human eye and exhibits properties of both a wave and a particle
Molar Absorptivity (ε) – a property that represents the amount of light absorbed by a given substance per molarity of the solution and per centimeter of thickness (M-1 cm-1)
Molarity (M) – the number of moles of solute per liters of solution (Mol/L)
Reflection – the process of light energy bouncing off the surface of a substance
Spectrophotometer – a device used to measure the absorbance of light by a substance
Tartrazine – widely used food and liquid dye
Transmittance (T) – the process of light energy passing through a substance
The amount of light absorbed by a solution can be measured using a spectrophotometer. The solution of a given concentration is placed in a small container called a cuvette. The cuvette has a known thickness that can be held constant during the experiment. It is also possible to obtain cuvettes of different thicknesses to study the effect of thickness on the absorption of light. The key definitions of the terms related to Beer’s Law and the learning activity presented in this article are provided in Figure 3.
Overview of the problem-solving experiment
In the problem presented to students, a 140-pound athlete drinks two bottles of yellow sports drink every day (Figure 4; see Online Connections). When she starts to notice a rash on her skin, she reads the label of the sports drink and notices that it contains a yellow dye known as tartrazine. While tartrazine is safe to drink, it may produce some potential side effects in large amounts, including rashes, hives, or swelling. The students must design an experiment to determine the concentration of tartrazine in the yellow sports drink and the number of milligrams of tartrazine in two bottles of the sports drink.
While a sports drink may have many ingredients, the vast majority of ingredients—such as sugar or electrolytes—are colorless when dissolved in water solution. The dyes added to the sports drink are responsible for the color of the sports drink. Food manufacturers may use different dyes to color sports drinks to the desired color. Red dye #40 (allura red), blue dye #1 (brilliant blue), yellow dye #5 (tartrazine), and yellow dye #6 (sunset yellow) are the four most common dyes or colorants in sports drinks and many other commercial food products (Stevens et al. 2015). The concentration of the dye in the sports drink affects the amount of light absorbed.
In this problem-solving experiment, the students used the previously studied concept of Beer’s Law—using serial dilutions and absorbance—to find the concentration (molarity) of tartrazine in the sports drink. Based on the evidence, the students then determined if the person had exceeded the maximum recommended daily allowance of tartrazine, given in mg/kg of body mass. The learning targets for this problem-solving experiment are shown in Figure 5 (see Online Connections).
Pre-laboratory experiences
A problem-solving experiment is a form of guided inquiry, which will generally require some prerequisite knowledge and experience. In this activity, the students needed prior knowledge and experience with Beer’s Law and the techniques in using Beer’s Law to determine an unknown concentration. Prior to the activity, students learned how Beer’s Law is used to relate absorbance to concentration as well as how to use the equation M1V1 = M2V2 to determine concentrations of dilutions. The students had a general understanding of molarity and using dimensional analysis to change units in measurements.
The techniques for using Beer’s Law were introduced in part through a laboratory experiment using various concentrations of copper sulfate. A known concentration of copper sulfate was provided and the students followed a procedure to prepare dilutions. Students learned the technique for choosing the wavelength that provided the maximum absorbance for the solution to be tested (λmax), which is important for Beer’s Law to create a linear relationship between absorbance and solution concentration. Students graphed the absorbance of each concentration in a spreadsheet as a scatterplot and added a linear trend line. Through class discussion, the teacher checked for understanding in using the equation of the line to determine the concentration of an unknown copper sulfate solution.
After the students graphed the data, they discussed how the R2 value related to the data set used to construct the graph. After completing this experiment, the students were comfortable making dilutions from a stock solution, calculating concentrations, and using the spectrophotometer to use Beer’s Law to determine an unknown concentration.
Introducing the problem
After the initial experiment on Beer’s Law, the problem-solving experiment was introduced. The problem presented to students is shown in Figure 4 (see Online Connections). A problem-solving experiment provides students with a valuable opportunity to collaborate with other students in designing an experiment and solving a problem. For this activity, the students were assigned to heterogeneous or mixed-ability laboratory groups. Groups should be diversified based on gender; research has shown that gender diversity among groups improves academic performance, while racial diversity has no significant effect (Hansen, Owan, and Pan 2015). It is also important to support students with special needs when assigning groups. The mixed-ability groups were assigned intentionally to place students with special needs with a peer who has the academic ability and disposition to provide support. In addition, some students may need additional accommodations or modifications for this learning activity, such as an outlined lab report, a shortened lab report format, or extended time to complete the analysis. All students were required to wear chemical-splash goggles and gloves, and use caution when handling solutions and glass apparatuses.
Designing the experiment
During this activity, students worked in lab groups to design their own experiment to solve a problem. The teacher used small-group and whole-class discussions to help students understand the problem. Students discussed what information was provided and what they need to know and do to solve the problem. In planning the experiment, the teacher did not provide a procedure and intentionally provided only minimal support to the students as needed. The students designed their own experimental procedure, which encouraged critical thinking and problem solving. The students needed to be allowed to struggle to some extent. The teacher provided some direction and guidance by posing questions for students to consider and answer for themselves. Students were also frequently reminded to review their notes and the previous experiment on Beer’s Law to help them better use their resources to solve the problem. The use of heterogeneous or mixed-ability groups also helped each group be more self-sufficient and successful in designing and conducting the experiment.
Students created a procedure for their experiment with the teacher providing suggestions or posing questions to enhance the experimental design, if needed. Safety was addressed during this consultation to correct safety concerns in the experimental design or provide safety precautions for the experiment. Students needed to wear splash-proof goggles and gloves throughout the experiment. In a few cases, students realized some opportunities to improve their experimental design during the experiment. This was allowed with the teacher’s approval, and the changes to the procedure were documented for the final lab report.
Conducting the experiment
A sample of the sports drink and a stock solution of 0.01 M stock solution of tartrazine were provided to the students. There are many choices of sports drinks available, but it is recommended that the ingredients are checked to verify that tartrazine (yellow dye #5) is the only colorant added. This will prevent other colorants from affecting the spectroscopy results in the experiment. A citrus-flavored soda could also be used as an alternative because many sodas have tartrazine added as well. It is important to note that tartrazine is considered safe to drink, but it may produce some potential side effects in large amounts, including rashes, hives, or swelling. A list of the materials needed for this problem-solving experiment is shown in Figure 6 (see Online Connections).
This problem-solving experiment required students to create dilutions of known concentrations of tartrazine as a reference to determine the unknown concentration of tartrazine in a sports drink. To create the dilutions, the students were provided with a 0.01 M stock solution of tartrazine. The teacher purchased powdered tartrazine, available from numerous vendors, to create the stock solution. The 0.01 M stock solution was prepared by weighing 0.534 g of tartrazine and dissolving it in enough distilled water to make a 100 ml solution. Yellow food coloring could be used as an alternative, but it would take some research to determine its concentration. Since students have previously explored the experimental techniques, they should know to prepare dilutions that are somewhat darker and somewhat lighter in color than the yellow sports drink sample. Students should use five dilutions for best results.
Typically, a good range for the yellow sports drink is standard dilutions ranging from 1×10⁻³ M to 1×10⁻⁵ M. The teacher may need to caution the students that if a dilution is too dark, it will not yield good results and lower the R2 value. Students that used very dark dilutions often realized that eliminating that data point created a better linear trendline, as long as it didn’t reduce the number of data points to fewer than four data points. Some students even tried to use the 0.01 M stock solution without any dilution. This was much too dark. The students needed to do substantial dilutions to get the solutions in the range of the sports drink.
After the dilutions are created, the absorbance of each dilution was measured using a spectrophotometer. A Vernier SpectroVis (~$400) spectrophotometer was used to measure the absorbance of the prepared dilutions with known concentrations. The students adjusted the spectrophotometer to use different wavelengths of light and selected the wavelength with the highest absorbance reading. The same wavelength was then used for each measurement of absorbance. A wavelength of 650 nanometers (nm) provided an accurate measurement and good linear relationship. After measuring the absorbance of the dilutions of known concentrations, the students measured the absorbance of the sports drink with an unknown concentration of tartrazine using the spectrophotometer at the same wavelength. If a spectrophotometer is not available, a color comparison can be used as a low-cost alternative for completing this problem-solving experiment (Figure 7; see Online Connections).
Analyzing the results
After completing the experiment, the students graphed the absorbance and known tartrazine concentrations of the dilutions on a scatter-plot to create a linear trendline. In this experiment, absorbance was the dependent variable, which should be graphed on the y-axis. Some students mistakenly reversed the axes on the scatter-plot. Next, the students used the graph to find the equation for the line. Then, the students solve for the unknown concentration (molarity) of tartrazine in the sports drink given the linear equation and the absorbance of the sports drink measured experimentally.
To answer the question posed in the problem, the students also calculated the maximum amount of tartrazine that could be safely consumed by a 140 lb. person, using the information given in the problem. A common error in solving the problem was not converting the units of volume given in the problem from ounces to liters. With the molarity and volume in liters, the students then calculated the mass of tartrazine consumed per day in milligrams. A sample of the graph and calculations from one student group are shown in Figure 8. Finally, based on their calculations, the students answered the question posed in the original problem and determined if the person’s daily consumption of tartrazine exceeded the threshold for safe consumption. In this case, the students concluded that the person did NOT consume more than the allowable daily limit of tartrazine.
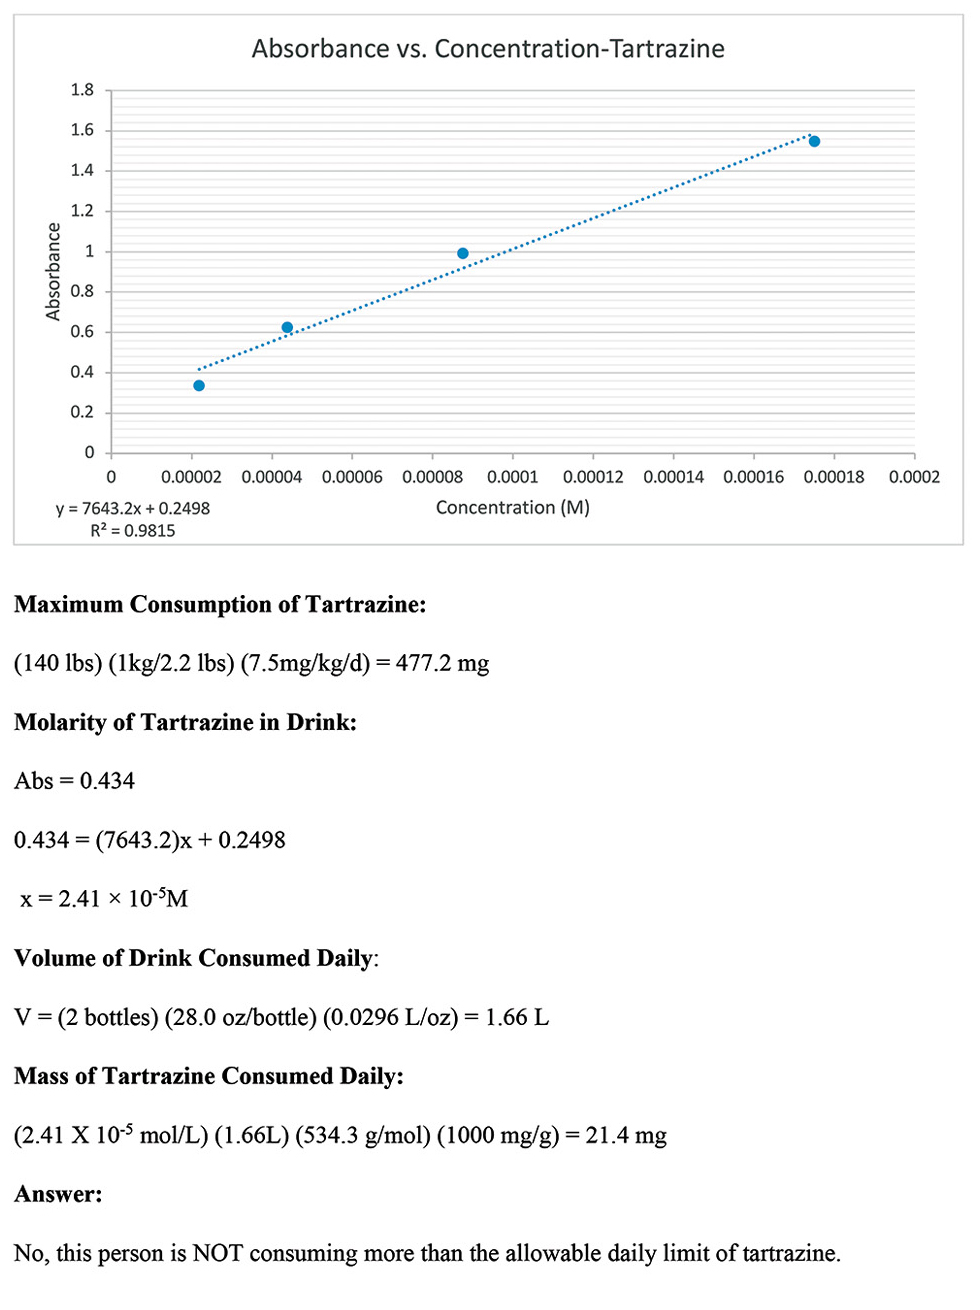
Sample graph and calculations from a student group.
Communicating the results
After conducting the experiment, students reported their results in a written laboratory report that included the following sections: title, purpose, introduction, hypothesis, materials and methods, data and calculations, conclusion, and discussion. The laboratory report was assessed using the scoring rubric shown in Figure 9 (see Online Connections). In general, the students did very well on this problem-solving experiment. Students typically scored a three or higher on each criteria of the rubric. Throughout the activity, the students successfully demonstrated their ability to design an experiment, collect data, perform calculations, solve a problem, and effectively communicate those results.
This activity is authentic problem-based learning in science as the true concentration of tartrazine in the sports drink was not provided by the teacher or known by the students. The students were generally somewhat biased as they assumed the experiment would result in exceeding the recommended maximum consumption of tartrazine. Some students struggled with reporting that the recommended limit was far higher than the two sports drinks consumed by the person each day. This allows for a great discussion about the use of scientific methods and evidence to provide unbiased answers to meaningful questions and problems.
The most common errors in this problem-solving experiment were calculation errors, with the most common being calculating the concentrations of the dilutions (perhaps due to the use of very small concentrations). There were also several common errors in communicating the results in the laboratory report. In some cases, students did not provide enough background information in the introduction of the report. When the students communicated the results, some students also failed to reference specific data from the experiment. Finally, in the discussion section, some students expressed concern or doubts in the results, not because there was an obvious error, but because they did not believe the level consumed could be so much less than the recommended consumption limit of tartrazine.
Conclusion
The scientific study and investigation of energy and matter are salient topics addressed in the Next Generation Science Standards (Figure 10; see Online Connections). In a chemistry classroom, students should have multiple opportunities to observe and investigate the interaction of energy and matter. In this problem-solving experiment students used Beer’s Law to collect and analyze data to determine if a person consumed an amount of tartrazine that exceeded the maximum recommended daily allowance. The students correctly concluded that the person in the problem did not consume more than the recommended daily amount of tartrazine for their body weight.
In this activity students learned to work collaboratively to design an experiment, collect and analyze data, and solve a problem. These skills extend beyond any one science subject or class. Through this activity, students had the opportunity to do real-world science to solve a problem without a previously known result. The process of designing an experiment may be difficult for some students that are often accustomed to being given an experimental procedure in their previous science classroom experiences. However, because students sometimes struggled to design their own experiment and perform the calculations, students also learned to persevere in collecting and analyzing data to solve a problem, which is a valuable life lesson for all students. ■
Online Connections
The Beer-Lambert Law at Chemistry LibreTexts: https://bit.ly/3lNpPEi
Beer’s Law – Theoretical Principles: https://teaching.shu.ac.uk/hwb/chemistry/tutorials/molspec/beers1.htm
Beer’s Law at Illustrated Glossary of Organic Chemistry: http://www.chem.ucla.edu/~harding/IGOC/B/beers_law.html
Beer Lambert Law at Edinburgh Instruments: https://www.edinst.com/blog/the-beer-lambert-law/
Beer’s Law Lab at PhET Interactive Simulations: https://phet.colorado.edu/en/simulation/beers-law-lab
Figure 4. Problem-solving experiment problem statement: https://bit.ly/3pAYHtj
Figure 5. Learning targets: https://bit.ly/307BHtb
Figure 6. Materials list: https://bit.ly/308a57h
Figure 7. The use of color comparison as a low-cost alternative: https://bit.ly/3du1uyO
Figure 9. Summative performance-based assessment rubric: https://bit.ly/31KoZRj
Figure 10. Connecting to the Next Generation Science Standards: https://bit.ly/3GlJnY0
Kevin Mason (masonk@uwstout.edu) is Professor of Education at the University of Wisconsin–Stout, Menomonie, WI; Steve Schieffer is a chemistry teacher at Amery High School, Amery, WI; Tara Rose is a chemistry teacher at Amery High School, Amery, WI; and Greg Matthias is Assistant Professor of Education at the University of Wisconsin–Stout, Menomonie, WI.
Chemistry Crosscutting Concepts Curriculum Disciplinary Core Ideas General Science Inquiry Instructional Materials Labs Lesson Plans Mathematics NGSS Pedagogy Science and Engineering Practices STEM Teaching Strategies Technology Three-Dimensional Learning High School