
feature
From Local to Global
Calculating and appreciating the value of trees and forests
The Science Teacher—May/June 2021 (Volume 88, Issue 5)
By Nancy Trautmann, Laura Branch, Rebecca Rehder Wingerden, Michelle Watkins, Janet Ort, and Kelsey Deal
Every year brings one environmental calamity after another—wildfires in California, flooding in Texas, “bomb cyclone” storms along the East coast. How can we inspire students to connect deeply with nature and become engaged as environmental scientists? Research into these questions revealed that teens gain confidence and ability to effectively address environmental issues when they participate in scientific investigations of complex issues in their home communities, including rigorous data collection and sharing of findings with external audiences (Ballard, Dixon, and Harris 2017).
A recent article in The Science Teacher presents activities that engage students in modeling the carbon cycle and developing ideas for local solutions to anthropogenic climate change (Hoover 2019). We build on these activities, providing guidance for student investigations focusing on the role of trees in carbon cycling at both local and global scales. These activities address an issue that has become especially urgent in the midst of news of escalating burning of the Amazon Rainforest.
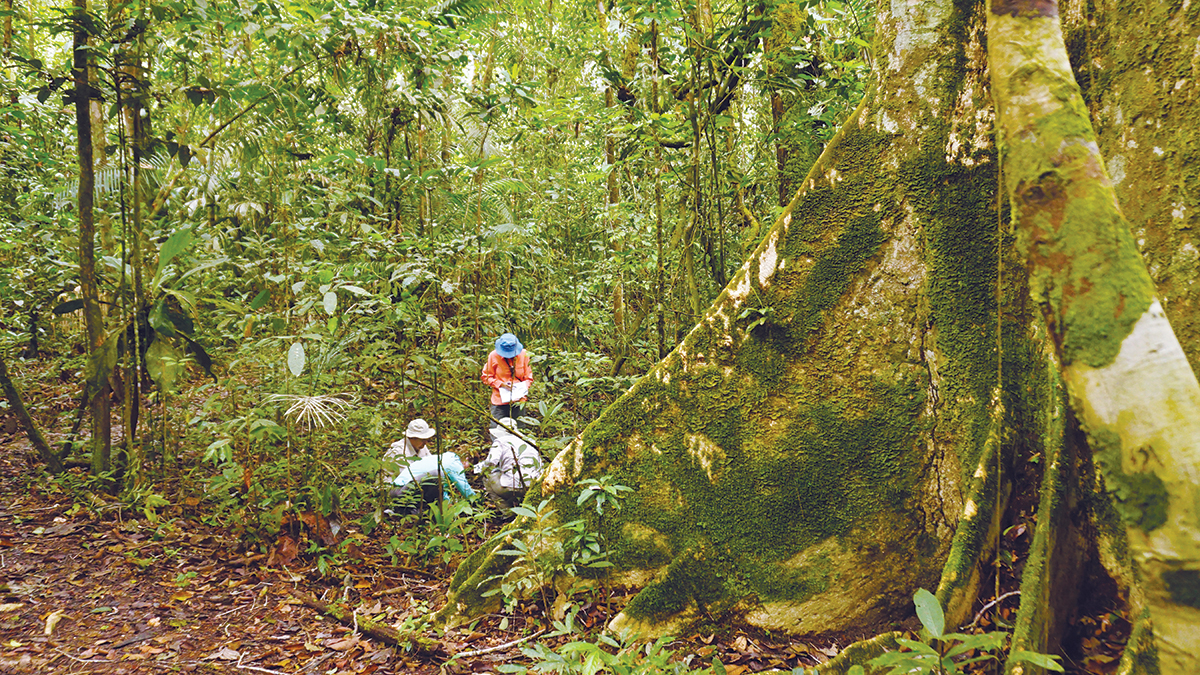
We (the authors of this article) have participated in intensive professional development in the Peruvian Amazon and brought this firsthand experience of the rainforest back to our classrooms. However, the activities presented here are designed to be accessible and inspirational to all students, regardless of whether they or their teachers have traveled beyond their hometowns. With experiences in urban and rural California, Alabama, New York, and Oklahoma schools, we present ways to weave investigations of the ecological roles of local trees together with activities that raise students’ awareness of global connections and build their capacities as environmental scientists and global citizens.
Activity: Measuring the value of a tree
In their biology and environmental science classes in Santa Maria, California, Laura Branch and Rebecca Wingerden focus student investigations on two questions related to the capacity of trees to store carbon: (1) Why should we care about carbon sinks? and (2) How much carbon is stored in individual trees on our campus? Their students explore these questions through this 5E lesson.
Engage
Student thinking about the global importance of photosynthesis and carbon uptake by plants is triggered through watching the video, “Timelapse: Photosynthesis Seen From Space” (see Online Connections). Noticing patterns of seasonal changes in abundance of global plant matter and correlations with atmospheric carbon dioxide levels, students record observations or questions about this video, which are then shared with a partner. This Engage activity concludes with a class discussion about the role of photosynthesis in global carbon cycling and reconnects students to their prior knowledge of the global carbon cycle.
Explore
Students work in groups to complete a jigsaw activity and graph decade-long subsets of the data represented in the Keeling Curve, which shows the accumulation of carbon dioxide in Earth’s atmosphere based on daily measurements taken at the Mauna Loa Observatory on the island of Hawai’i from 1958 to the present. Each group shares its graph and summarizes the relationships observed in their atmospheric carbon dioxide data over time, noting that the Keeling Curve demonstrates both annual variation and long-term trends. The class then organizes all subset graphs into chronological order to reveal the combined data set. Class discussion continues around student questions and observations related to the trends evident in the compiled graph. Students are challenged to argue from evidence to explain evident patterns in this data and to make predictions for future trends in atmospheric carbon dioxide levels.
Explain
Through guided discussion, students ponder the meaning and importance of carbon sinks for global systems. The importance of forests is discussed, recognizing their value both as key carbon sinks and as economic resources. Some students are surprised to learn that trees increase in mass by taking up carbon primarily from the air, not the soil, drawing in atmospheric carbon dioxide to build organic compounds through photosynthesis.
Continuing the conversation, students consider why the global rate of deforestation is a matter of concern. They learn that the amount of carbon in each tree depends on its species, size, and age. In general, the faster a tree grows, the more quickly it will add carbon to its stores, and the larger the tree, the more carbon it can store. They also discuss what happens when a tree dies, recognizing that its carbon may be released through decomposition and reincorporated into new plant growth, or it may continue to be stored in wood that is preserved as lumber.
Extend
After being introduced to Project Learning Tree’s protocol for calculating the amount of carbon stored in a tree, the students visit 10 trees on campus that have been monitored by previous classes (see How Much Carbon Is in a Tree? in Online Connections). They measure the circumference and height of these trees, then determine the amount of carbon stored in each. The students in Santa Maria use a specialized app and website created by Wingerden for this purpose (Figure 1). Alternate approaches for students in other locations are discussed in the Adaptations section below.
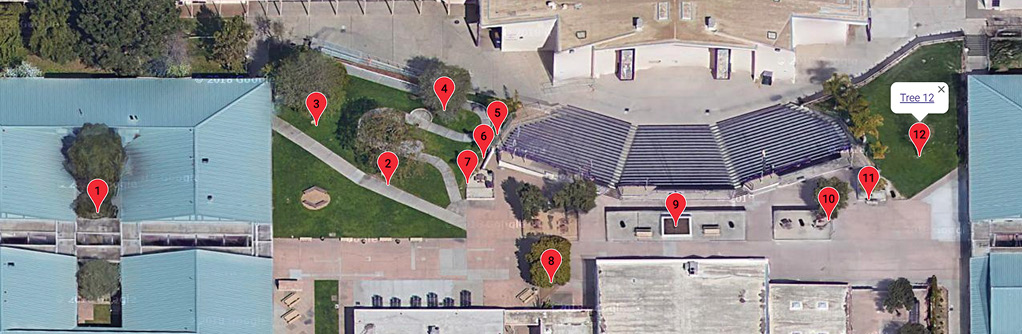
Locations of trees on the school site.
Evaluate
To evaluate potential trends in carbon capture on their campus, students create a graph using the tree data they collected, and the data collected by students in previous years. After analyzing this data set, students use the Claim, Evidence, and Reasoning (CER) framework to address the prompt: “How has the amount of carbon stored in the sample trees changed over time?” (Figures 2 and 3). Students reflect on the influence of the local trees they have studied on the microclimate of their area, and they predict how this might change as the trees grow or if they were to be removed. Students are then invited to reconnect with the Engage phenomenon and respond to the prompt, “Why should we care about carbon sinks?”
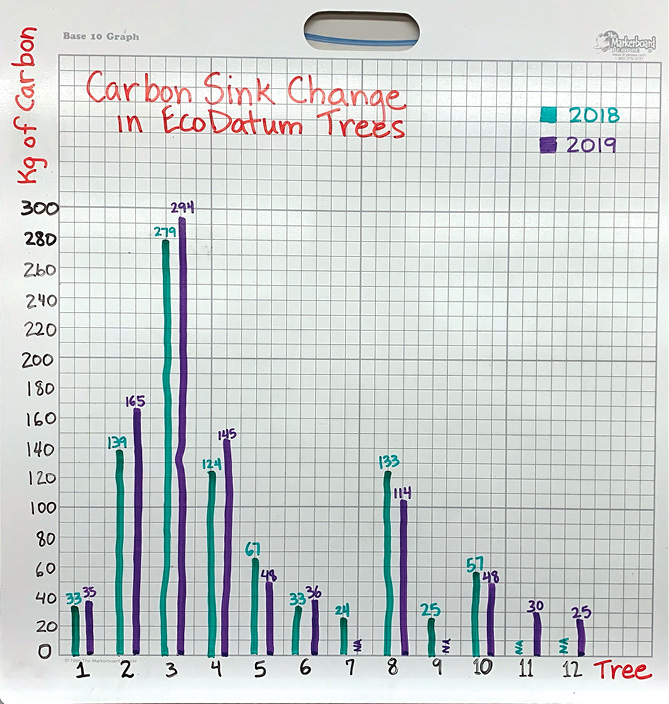
Student graph of carbon sink change in EcoDatum trees.
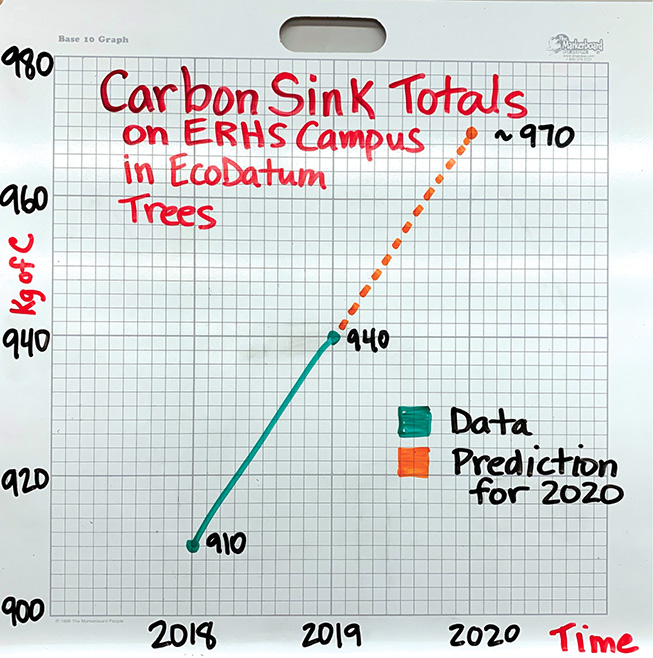
Carbon sink totals in EcoDatum trees.
Adaptations
Without the specialized data collection and analysis tools created for the Santa Maria school, Michelle Watkins engages her classes in the rural community of Beaver River, New York, in estimating the amount of carbon stored in selected trees using a conversion chart offered by Project Learning Tree (see How Much Carbon Is in a Tree? in Online Connections). Assembling their carbon capture data into a shared spreadsheet, they contribute to a longitudinal data set that can be shared from one year to the next for student use in analyzing carbon capture trends in their local trees.
Applying the practices used by foresters in their region, students also estimate the volume of standing timber in their selected trees. (While foresters use standard estimation strategies to estimate the number of board feet in a tract of land, this activity challenges students to become more cognizant of the impacts of individual trees.) First, they learn how to measure a tree’s diameter at breast height (DBH). Then they estimate the height of the tree using a clinometer, or a simple handmade version made out of cardboard, straws, string, and washers (see How to Make a Clinometer in Online Connections). They measure the height of the tree by backing away until they see the crown in the sites of the viewer, then calculate tree height as the distance from the base of the tree plus the height of the student who has conducted the measurement. These data enable students to estimate each tree’s potential yield in board feet of lumber, which they then use with stumpage price reports (see Stumpage Price Reports in Online Connections) to predict the current market value of its timber (Figure 4).
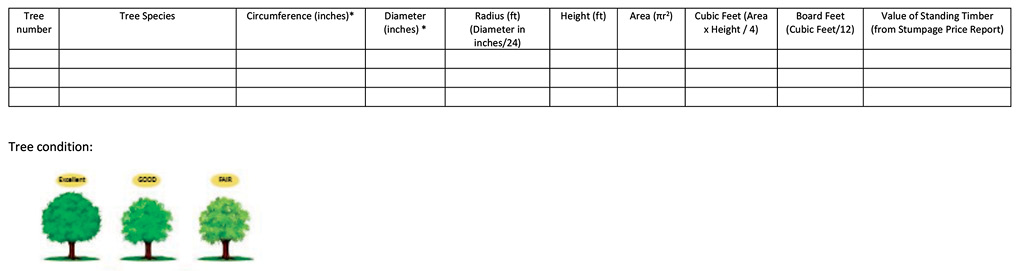
Student data sheet.
To take this further, Watkins challenges her students to analyze research into how forest management practices affect climate change, such as addressing the question of how mature forests compare with young ones in terms of carbon uptake and storage (e.g., Koberstein and Applegate 2019).
Activity: Appreciating ecosystem services provided by trees
Using i-Tree Design software created by the U.S. Forest Service and partners, students can estimate the value of ecosystem services provided by individual trees (see Online Connections), for example, improving air quality, intercepting stormwater, and lowering energy use in adjacent buildings (Figure 5). Comparing these values with the value of timber if the trees were to be logged, students grapple with real-world questions related to local and global ecology and economics.
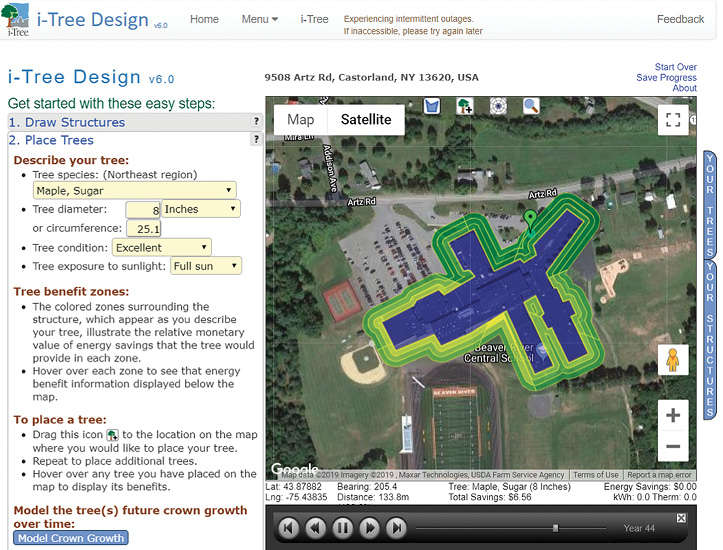
iTree main display.
In Birmingham, Alabama, Janet Ort’s students observe leaves from five tree species and predict which leaves might produce the most water through transpiration. They place the leaves in sealed bags overnight, then measure water volume in each by weighing the bags and pouring any accumulated water into graduated cylinders. The students calculate surface area of each leaf using graph paper and compare the relative transpiration amounts. After compiling and comparing the class data, they discuss what variables might be influencing their results. Using fingernail polish leaf casts, they compare stomata among the various types of leaves, then relate their findings to the role of trees in cycling of water.
Activity: Connecting from local to global
After conducting tree biomass calculations, Ort’s students pinpoint their trees on Google Earth and zoom out to view them as forest remnants that provide a buffer zone protecting the Cahaba River, their city’s source of drinking water. Zooming out farther, they travel via Google Earth to the Amazon River and reflect on the role of the vast Amazon Rainforest in regulating global cycling of both water and carbon. Janet helps her students recognize the role of transpiration in the Amazon by showing a picture of misty clouds rising from the rainforest, a visually compelling example of transpiration in action.
Similarly, Michelle Watkins encourages students in New York State’s Adirondack Mountain region to think about relationships between their local environment and the distant Amazon Rainforest, recognizing the crucial role played by the Amazon biome in global cycling of carbon, oxygen, and water, as well as in regulating climate change. When rampant burning of the Amazon Rainforest hit the airwaves, students discussed whether some of this news might be exaggerated or inaccurate (e.g., Butler 2019). To address this question, Watkins challenged them to gather articles from a variety of sources that addressed the influence of palm oil production on fires in the Amazon. Using the Science Friction…Real News or Fake News? Rubric (see Online Connections), they used critical-thinking skills to evaluate the veracity of information presented in each article. Ultimately they produced a list of Top 10 helpful articles along with the “Dirty Dozen” or “Science Friction” ones that communicate incorrect or misleading information.
Appreciation of the global-scale ecosystem services provided by the Amazon Rainforest has become increasingly urgent, as indicated in recent scientific projections of environmental calamities that will result if a critical tipping point is reached when the Amazon ceases to be a carbon sink and turns instead into a source of carbon emissions (Pearce 2019). Delving into controversies over how deforestation data are compiled and reported provides opportunities for students to go beyond headlines and apply critical thinking to what they are seeing or hearing in the news.
Activity: Taking positive action
Extending beyond scientific investigations to design and conduct conservation-related projects in their local communities cultivates students’ appreciation of roles they can play in maintaining ecosystem health both locally and globally. For example, after learning about air pollution in their city of Birmingham, Alabama, a student research team at Janet Ort’s school used handheld sensors to measure ultrafine particle pollution consisting of solid or liquid droplets that can negatively affect people’s health. Using the AirCasting app, they documented the role of trees in mitigating particle pollution (Figure 6), then promoted trees as a means of improving air quality in their city. This project twice received national recognition as a winner in the Lexus Eco Challenge, which rewards students for successfully tackling environmental issues in their communities. Participating students won scholarships, and their school was awarded grant money that Ort is using to continue engaging her students in tree planting, mapping, and public awareness initiatives.
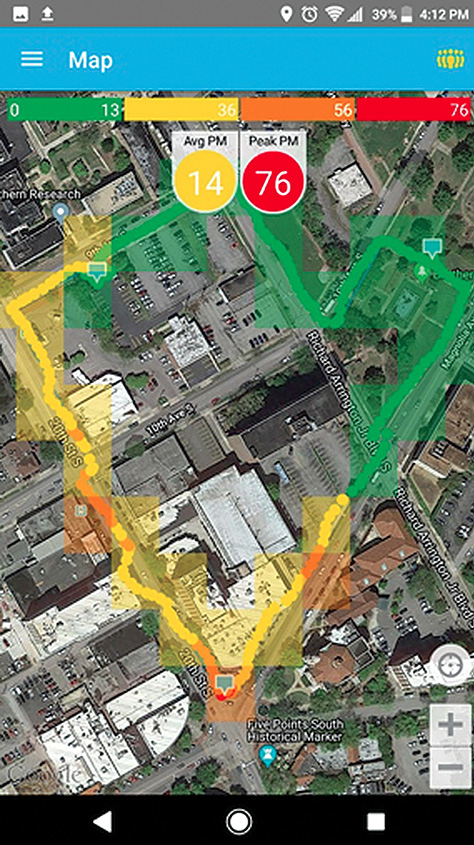
AirCast main display.
Another way for students to take positive action is to investigate the rainforest connections of many of our popular foods. The link between chocolate and climate change may seem far-fetched until students learn the difference between rainforest destruction for agriculture versus practices designed for sustainable harvest as part of maintaining a thriving ecosystem. After learning the importance of growing products such as coffee, tea, cocoa, and palm oil in environmentally sustainable ways, students can investigate various products and certification systems.
Furthermore, students can calculate the carbon footprint of food items to increase their understanding of the connections between their everyday choices and potential impacts on the biosphere. Students in Kelsey Deal’s biology class in Oklahoma City began this process with a video that illustrates how to estimate the amount of carbon dioxide produced for each part of a sandwich (see How Your Sandwich Changed the World in Online Connections). This example of estimating the net carbon produced per slice of bread or tomato can be repeated using other foods that students would like to research, empowering them to make conclusions about the role they play in contributing to global carbon emissions.
The need to build students’ global competence is recognized by the Organization for Economic Co-operation and Development (OECD) as a crucial part of the United Nations’ call for quality education for all, including learning to live sustainably (Schleicher 2017). OECD recently began assessing students’ global competence as part of the annual PISA exams: “Globally competent students can draw on and combine the disciplinary knowledge and modes of thinking acquired in school to ask questions, analyse data and arguments, explain phenomena, and develop a position regarding a local, global or cultural issue” (OECD 2018).
As California teacher Laura Branch recently stated in a Forbes magazine article about climate change, “Incorporating climate science into teaching is extremely important for students and our planet. Why? Students are our next generation. They are our future. They must work to solve climate issues to heal the Earth and live sustainably so there is a habitable Earth for their children” (Milgrom-Elcott 2019). ■
Acknowledgment
We wish to thank the Morpho Institute’s Educator Academy in the Amazon for bringing us together and catalyzing our collaboration on designing activities to build students’ capacities as environmental scientists and global citizens.
Online Connections
Video: “Timelapse: Photosynthesis Seen From Space”: https://youtu.be/Nsmdzd2NSjQ
How Much Carbon Is in a Tree?, Project Learning Tree: https://www.plt.org/wp-content/uploads/pdf/PLTFocusOnForests_Activity-8_Climate-Change-and-Forests_Student-Page_How-Much-Carbon-is-in-a-Tree-English-units.pdf
How to Make a Clinometer: https://www.wikihow.com/Make-a-Clinometer
Stumpage Price Reports: https://www.dec.ny.gov/lands/5259.html
iTree Design software: https://design.itreetools.org/
Teaching With i-Tree, Project Learning Tree: https://www.plt.org/curriculum/teaching-with-itree/
Ecodatum website: http://www.rwingerden.com/EcoDatum/
Video: “How Your Sandwich Changed The World”: https://www.npr.org/sections/thesalt/2017/06/20/533128467/how-your-sandwich-changed-the-world
Connecting to the Next Generation Science Standards: https://bit.ly/38ufINQ
Science Friction…Real News or Fake News? Rubric: https://bit.ly/3t6nWDY
Amazon Teaching Resources
Morpho Institute: https://morphoinstitute.org/resource-bank/
Climate Educator Guide: A Guatemala Case Study by The Rainforest Alliance: https://www.rainforest-alliance.org/curricula/climate
Professional development opportunities in the Peruvian Amazon: https://morphoinstitute.org/professional-development/
Nancy Trautmann (nancy.trautmann@cornell.edu) is retired Director of Education at the Cornell Lab of Ornithology in Ithaca, NY, Laura Branch and Rebecca Rehder Wingerden are science teachers at Ernest Righetti High School in Santa Maria, CA, Michelle Watkins is a science teacher at Beaver River High School in Beaver Falls, NY, Janet Ort is a science teacher at Hoover High School in Hoover, AL, and Kelsey Deal is a science teacher at Advanced Science and Technology Education Charter Schools in Oklahoma City, OK.
5E Biology Climate Change Crosscutting Concepts Disciplinary Core Ideas Earth & Space Science Environmental Science General Science Inquiry Instructional Materials Interdisciplinary Labs Life Science NGSS Science and Engineering Practices STEM Teaching Strategies Three-Dimensional Learning High School