
special issue
Going Viral!
A Hands-on Science Kit Examining Viruses, Bacteria, Vaccines, and the Immune System
The Science Teacher—January/February 2023 (Volume 90, Issue 3)
By Delaney Worthington, Andrew Warnock, Mike Viney, Victoria Jordan, Jennifer Mclean, Karina Hassell, Lynne Judish, and Courtney Butler
Health literacy levels play a significant role in the spread of misinformation about microbes, vaccines, and the immune system. Studies show that individuals who have lower health literacy (HL) are more likely to be susceptible to health misinformation (Scherer et al. 2021). Thus, it is concerning that over half of U.S. college students in a recent study self-reported low HL scores (Patil et al. 2021). These findings may seem surprising; however, microbiology, immunology, and health concepts are not represented clearly in the Next Generation Science Standards (NGSS), despite this being the guide that many states use to develop K–12 science curricula (NGSS Lead States 2013). This gap in the education system leaves our students vulnerable to health misinformation, even as they enter college and become independent young adults. The overarching effects of low HL are reflected clearly by the COVID-19 pandemic. SARS-CoV-2 vaccine hesitancy and the inability to detect fake news have both been associated with a lack of HL (Montagni et al. 2021).
We believe it is important for students to start learning about pathogens, vaccines, and the immune system early in the K–12 educational pathway so they can begin to develop HL sooner and feel empowered to make educated health decisions. To this aim, we have created the STEM kit Going Viral!, a self-guided inquiry with five activities that facilitate student exploration of the microscopic world of bacteria, viruses, and the human immune system (Figure 1). Going Viral! helps students model how a pathogen can spread through a population of both vaccinated and unvaccinated individuals. The kit also helps students compare the size of common microbes and model an immune response. Finally, it helps students connect the immune response to how vaccinations work. Upon completing this kit, students will gain an important understanding of key processes in their bodies that work to protect them from pathogens and develop an awareness of microbes they interact with every single day.
Activity 1: Germs
This activity helps students explore how a pathogen spreads (Table 1). Safety note: This activity requires the use of dilute sodium hydroxide (NaOH); students must wear indirectly vented chemical splash goggles, nitrile gloves, and nonlatex aprons throughout the duration of the activity. To begin, students open their Going Viral! instruction booklet and read a short passage that teaches them about microbes. This helps them discover what a pathogen is and models how pathogens spread from person to person.
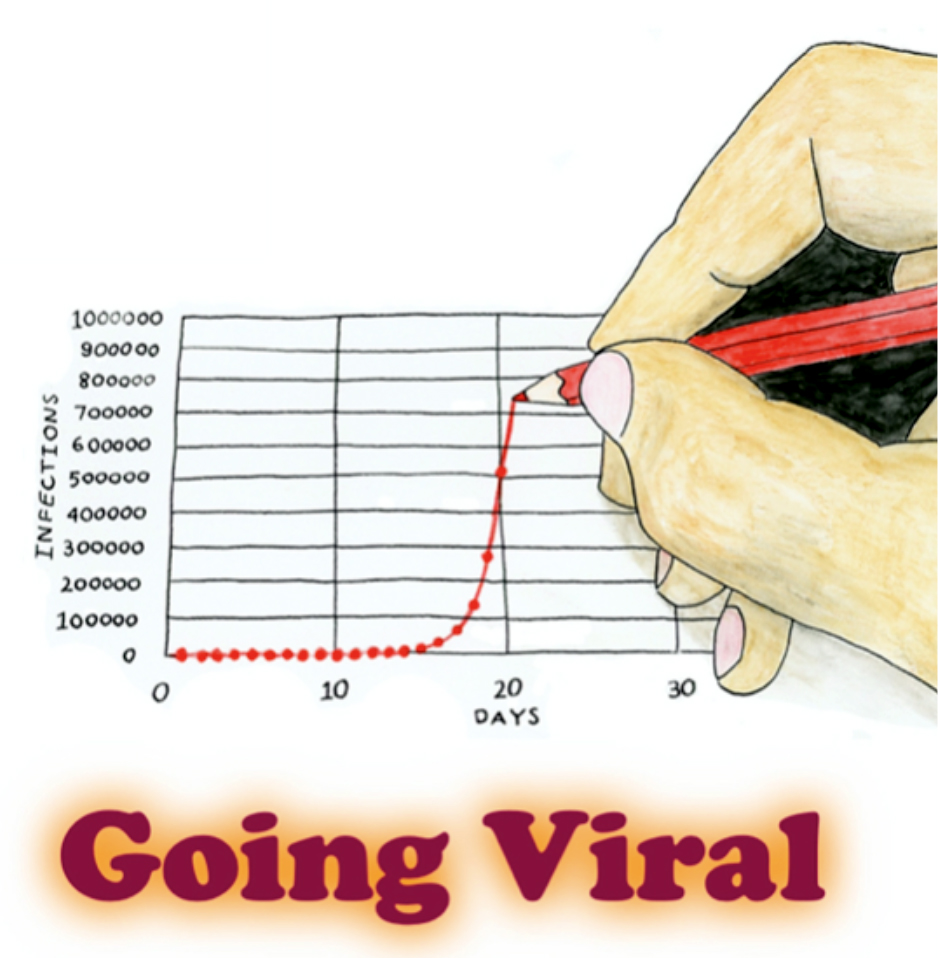
The cover of the Going Viral! booklet.
List of materials required to complete Activity 1: Germs.
- Going Viral! instruction booklet
- Safety goggles
- Plastic vials
- Small, plastic petri dishes
- Pipette
- Science notebook
- DI water
- 0.5M NaOH
- 0.03% phenolphthalein
Students launch into the activity in which they simulate the spread of an imaginary pathogen. They work in pairs and have a vial that represents a human. After putting on safety equipment as listed above, students add a solution representing that human’s saliva into the vial. One vial has NaOH, whereas the remaining vials have deionized (DI) water. Students swap “saliva” samples with three other groups using pipettes (Figure 2). Once they finish exchanging, students return to their seats, place a drop of their human’s “saliva” into a small petri dish, and test with a dropper bottle containing phenolphthalein indicator. The solution turns pink if a student has been infected, and students create a classroom graph to keep track of the number of infected and uninfected individuals. Then students calculate the percentage of the population that has been infected (Figure 2).
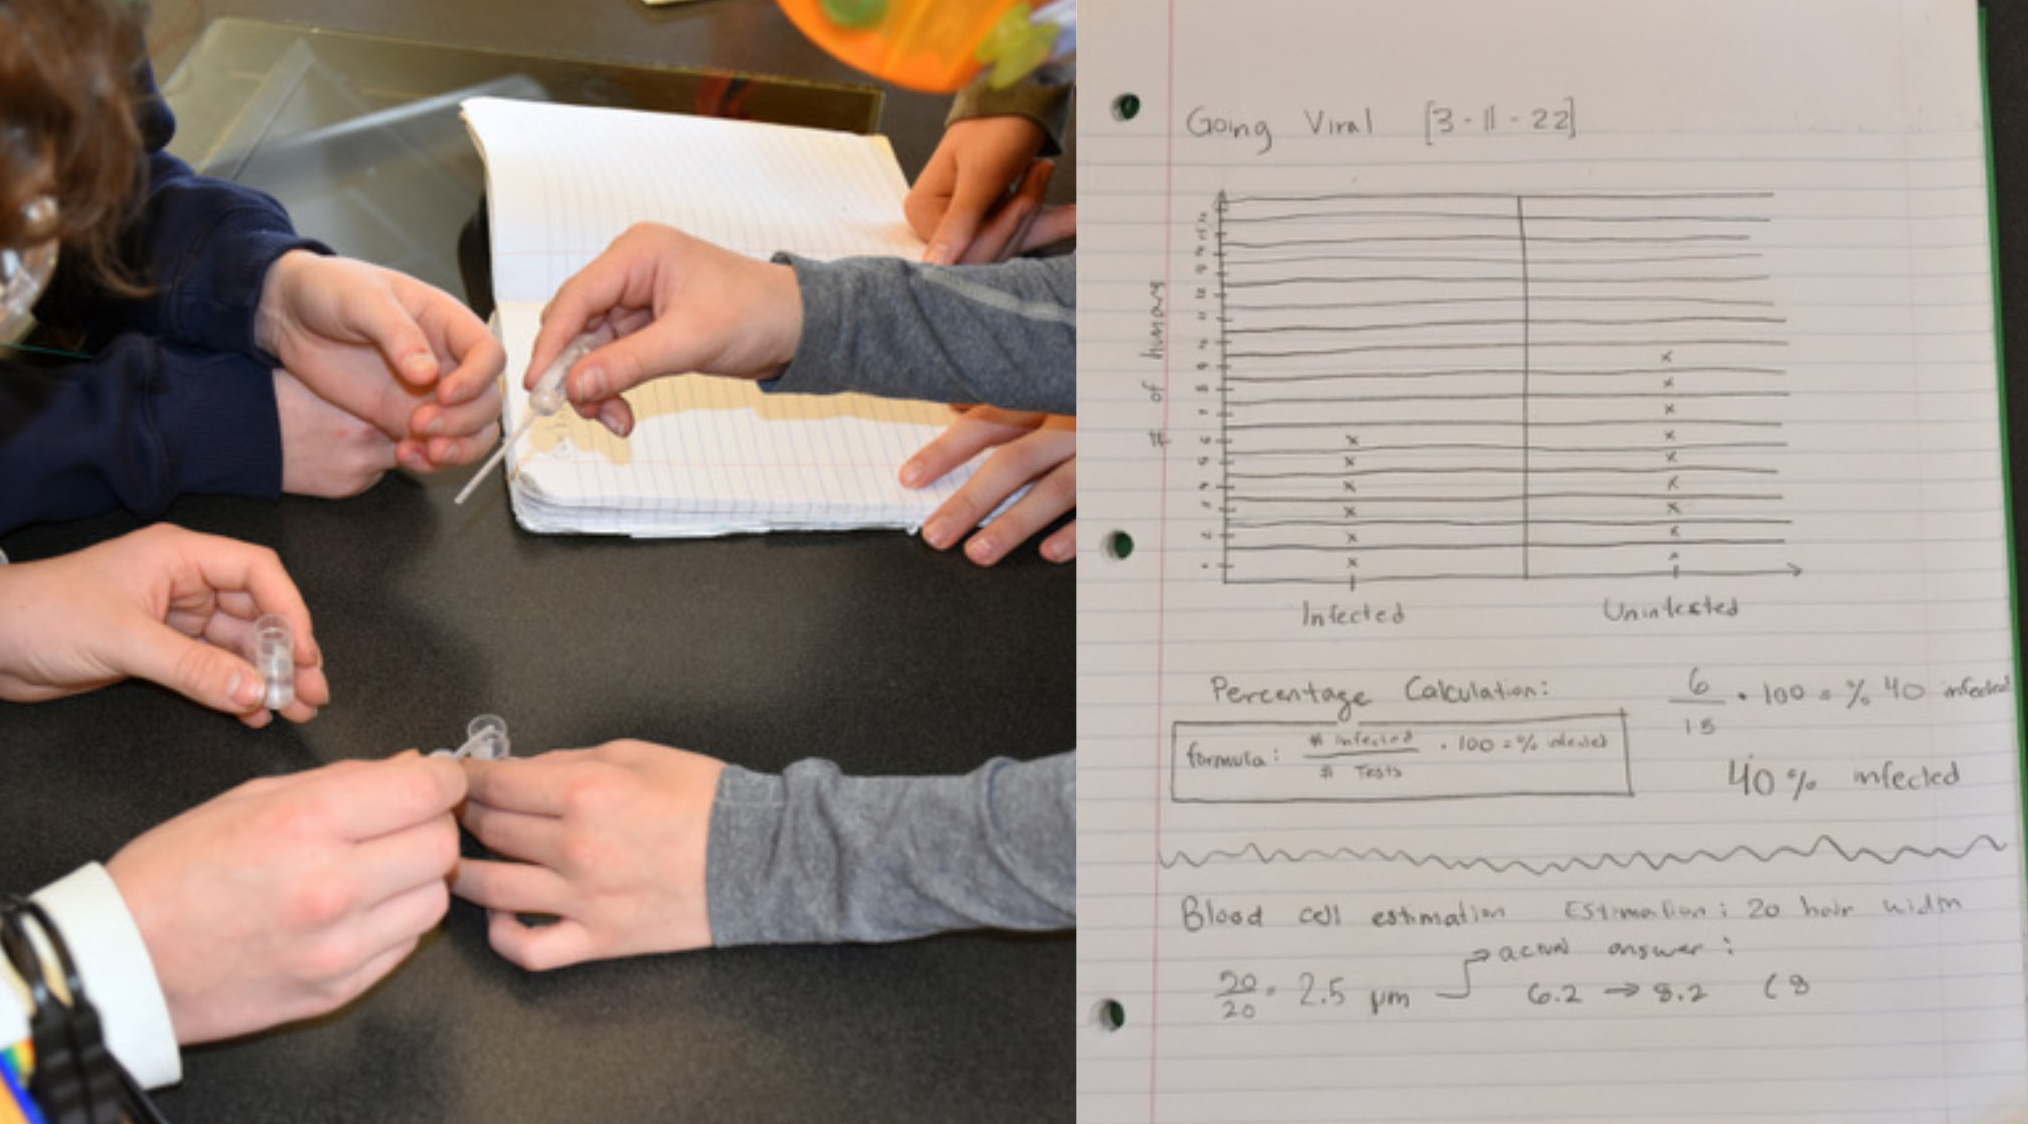
Students exchange their human’s “saliva” with one another. Then they draw a chart of the infected versus uninfected individuals and calculate the percentage infected.
List of materials required to complete Activity 2: How invisible are microbes?
- Going Viral! instruction booklet
- Carson MicroBrite microscope
- Mononucleosis blood smear
- Human hair
- Science notebook
This activity has been around for many years and is a tried-and-true way to pique students’ interest in microbiology.
Nevertheless, students have the chance to use real scientific tools (petri dishes, dropper bottles, safety goggles, and pipettes), which contributes to their excitement and helps them feel like “real scientists.” We circle back to this activity later in a new, unique way to show students how vaccinations can help a population reach herd immunity.
Activity 2: How invisible are microbes?
Now, each pair of students uses a microscope to examine a prepared infectious mononucleosis blood smear. Mononucleosis, or “mono,” is a common infection for this age range, making it an interesting and relatable model (Table 2). Mononucleosis is caused by the Epstein-Barr virus, which infects white blood cells and causes them to become visibly misshapen, a phenomena that can be visualized by students through the microscope. However, for now, students only need to concern themselves with the red blood cells and the hair they overlay across the smear, which helps them calculate the estimated size of a red blood cell (Figure 3). During this activity, some students have trouble focusing and zooming the microscope and will need assistance to be able to visualize the hair and red blood cells at the same time. Students get excited to experience the microscopic world and share comments like, “The microscope was awesome” and “Looking at the hair under the microscope was eye opening.”
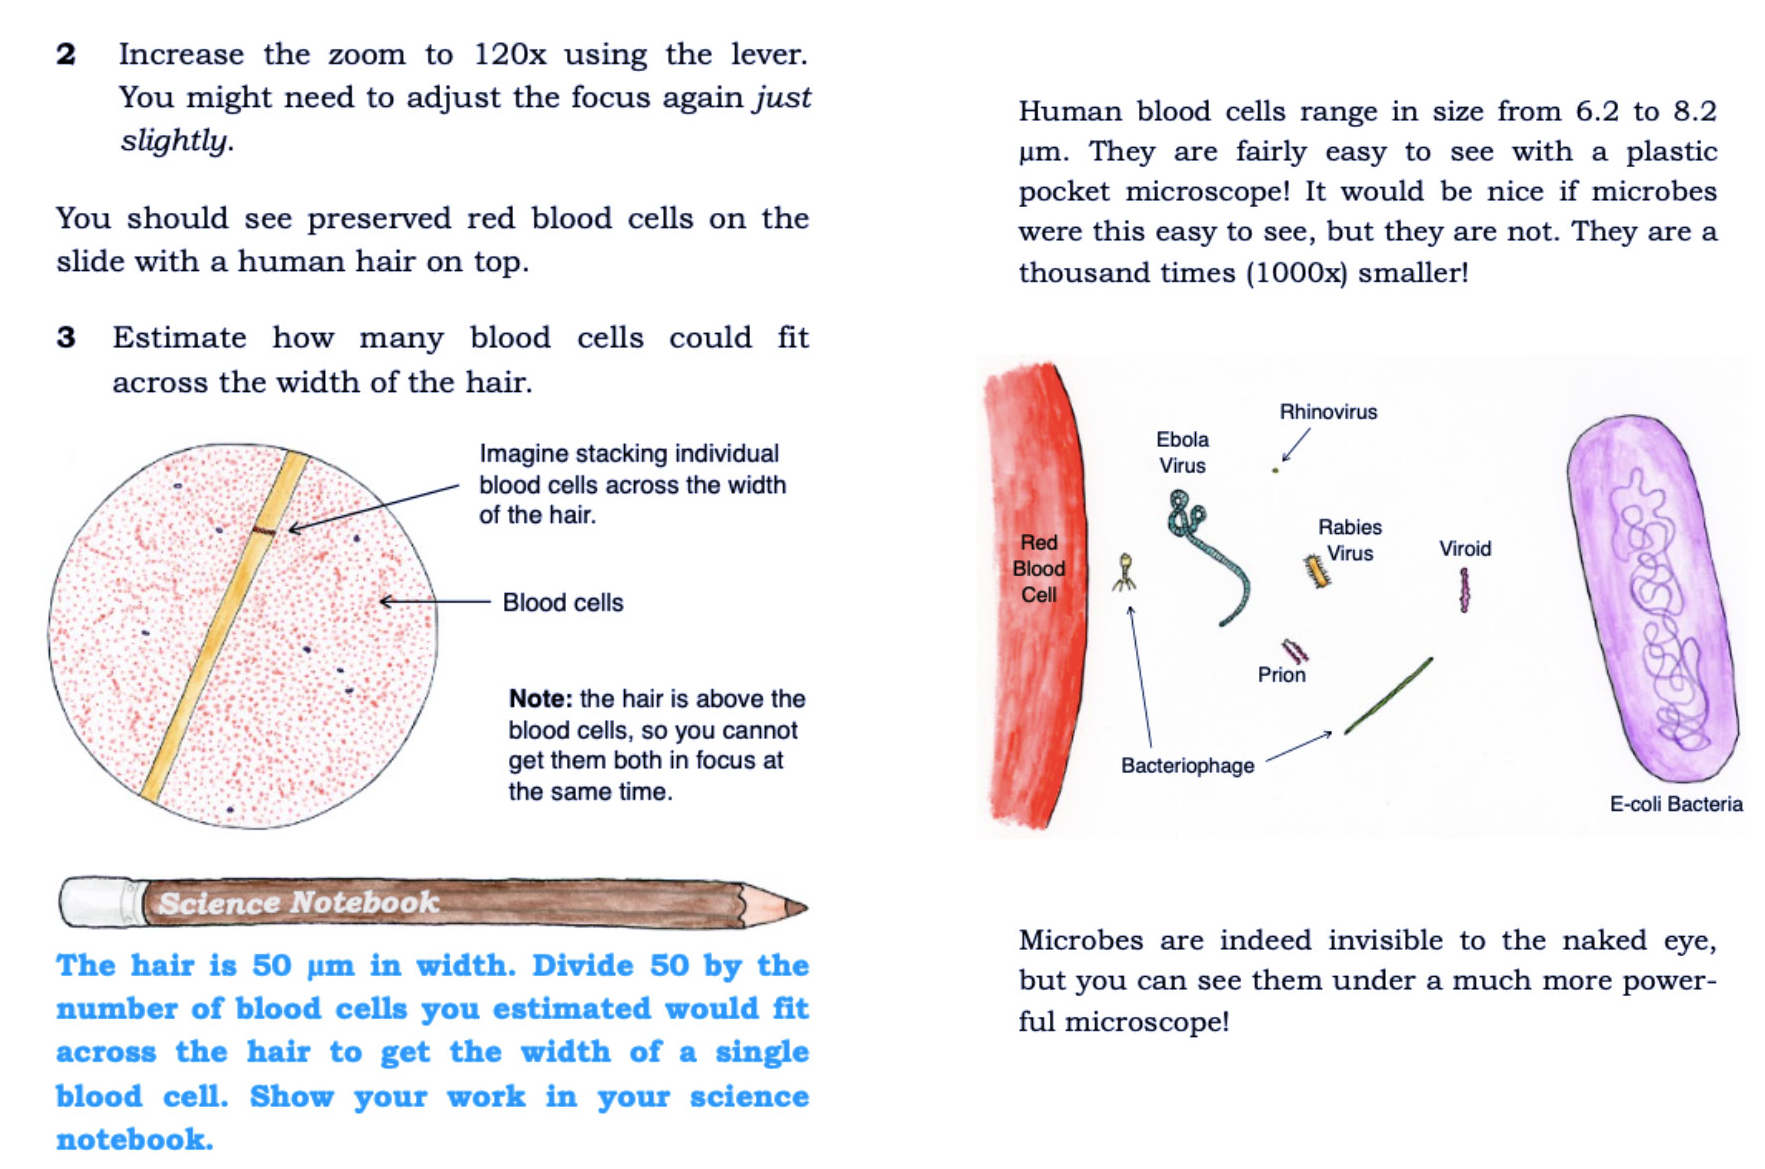
Samples from the Going Viral! booklet showing how students will compare a red blood cell to a hair, and then compare that red blood cell to even smaller microorganisms.
List of materials required to complete Activity 3: Effects of microbes.
- Going Viral! instruction booklet
- Microbe sorting cards
- Microbe size chart
- Carson MicroBrite microscope
- Mononucleosis blood smear
- Colored pencils
- Science notebook
Activity 3: Effects of microbes
By now, students are wondering what microbes are and what they look like (Table 3). The booklet contains a short passage outlining the different types of microbes and introduces important vocabulary words: bacteria, prokaryotes, eukaryotes, and viruses. Students perform a sorting activity that was inspired by VaccineMakers.org (The Vaccine Makers Project 2019). They begin by sorting the microbe sorting cards by shape and structure into three groups: Bacteria, Virus, and Other. The cards have colorful images of microbes and are labeled with the microbe’s function (what disease it causes and what it is used for). Usually, students begin by engaging background knowledge about any microbes that are familiar to them. Then they compare the shapes and structures to help them sort the remaining cards (Figure 4). However, there are some tricky cards where, for example, a virus might appear to have a similar structure to a bacterium. So, after the first try, students use a microbe size chart to re-sort the cards, and they learn about a new unit of measurement, the nanometer. Students often have questions about nanometers, so this is a great opportunity to encourage students to draw a diagram to help them visualize the difference between a nanometer, micrometer, and millimeter.
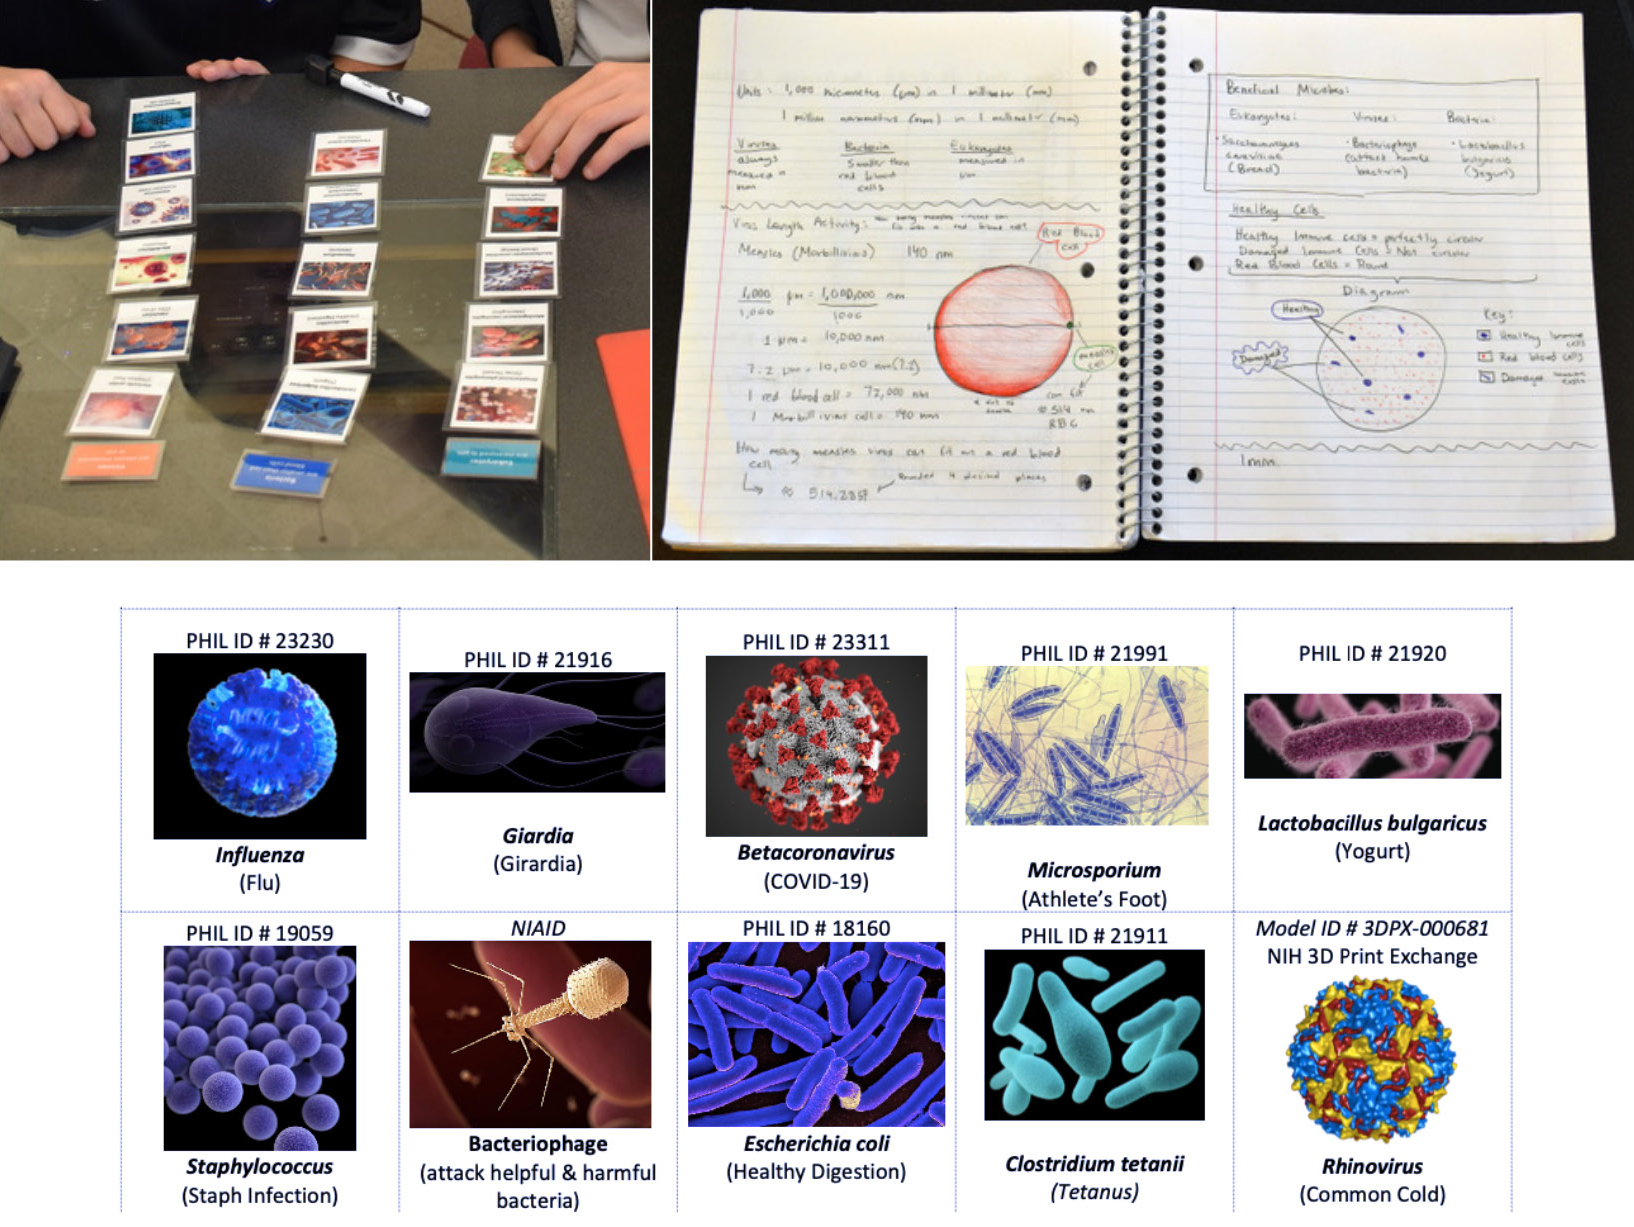
Students work through the microbe sorting activity, for which a close-up snapshot of some of the cards can also be seen. Student work shows drawings of Epstein-Barr infected white blood cells as compared to healthy blood cells.
List of materials required to complete Activity 4: Immune response.
- Immune response instruction cards
- Printed or 3D-printed immune response manipulatives
- Diagram of lymphatic system
- Science notebook
Finally, students look at the mononucleosis blood smear once more to examine and identify the immune cells that have been damaged by the Epstein-Barr virus. Students draw and label a diagram with normal and damaged cells in their notebooks (Figure 4). This allows students to make the connection between a virus and how it makes someone sick by damaging their cells. Students really enjoy the colorful images on the cards and have said, “The card sort was fun, and it was super interesting. I couldn’t believe the cool shapes were actual organisms!” and “I found comparing nanometers and micrometers interesting.”
Activity 4: Immune response
Now that students have an idea how pathogens make them sick, they will explore how the body’s immune system protects them from pathogens (Table 4). Students use custom-made 3D-printed manipulatives that include pathogens and different immune cells to animate the steps that the body takes to protect itself from a pathogen, starting and ending at the site of infection, and stopping in the lymphatic system along the way (Figure 5). Although students will only explore a small part of the immune response in this activity, they will learn the important role that memory cells play. Students’ learning is assessed with the following questions: What initially triggered the immune response? Explain what the difference is between T cells and memory cells. How does the immune response change when a person gains memory cells?
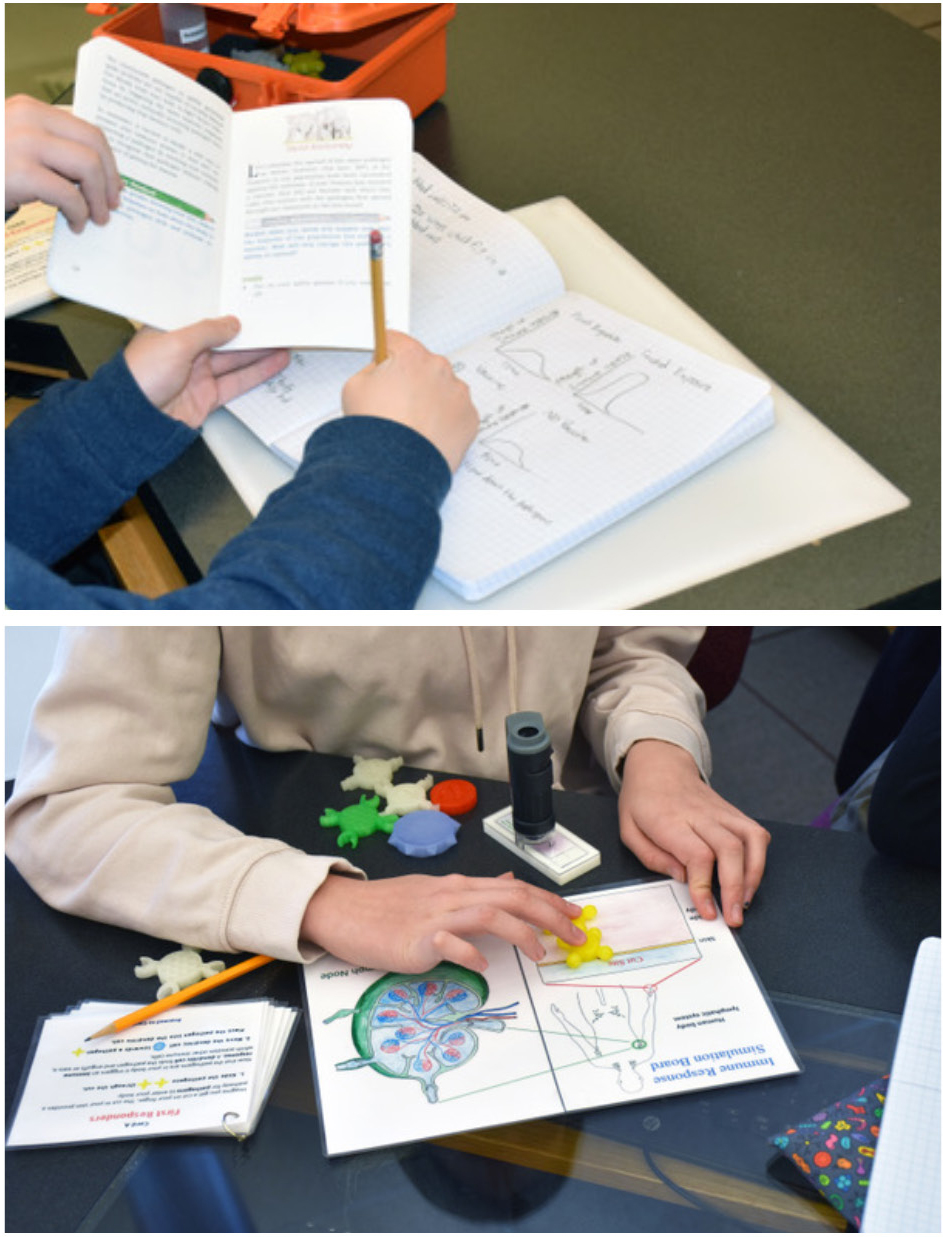
A student works through the immune response activity with their 3D manipulatives. Another student draws immune response graphs in their notebook and works to predict what a second exposure will look like with memory cells at play.
List of materials required to complete Activity 5: Herd immunity.
- Going Viral! instruction booklet
- Safety goggles
- Plastic vials
- Small, plastic petri dishes
- DI water
- pH 2 buffer
- 0.5M NaOH
- Pipette
- 0.03% phenolphthalein
- Science notebook
After modeling the immune response, students compare graphs of primary and secondary immune responses in their science notebooks (Figure 5). This part of the activity guides students to draw graphs to predict how the immune response would look for a body exposed to a vaccine by comparing it to an immune response from a natural infection. Then students read a passage explaining what components go into a vaccine and how it works.
Students’ comments about this activity include “I can explain how the body fights off viruses. The most interesting thing I learned was that the memory cells are created in the lymph node to memorize the virus” and “Learning how the immune system works in a fun and visual way and is going to help me remember.”
Activity 5: Herd immunity
Now that students have a deeper understanding of microbes and the immune response, it is time to show them how we can protect ourselves and our community from the spread of a pathogen (Table 5). Students will repeat the “saliva swap” spread of a pathogen as in Activity 1; however, in this simulation, 80% of a population has received a vaccine. Students work in pairs and again use vials containing solutions that represent a human’s saliva. One vial has NaOH, representing an infected individual. The vaccination is simulated by placing a buffer into 80% of the vials instead of DI water. After completing their swaps, students can compare the number of individuals infected and uninfected in the unvaccinated and vaccinated populations (Figure 6).
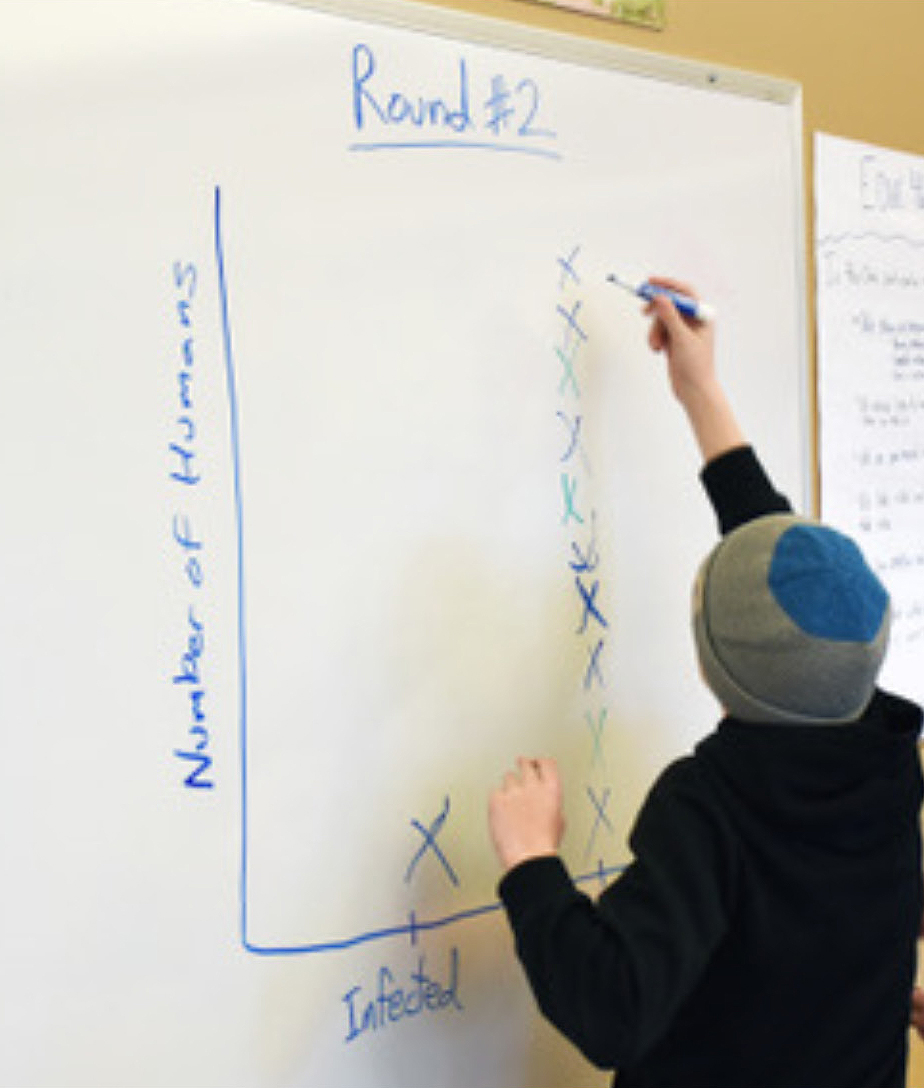
A student fills in the infection chart for the second round.
In conclusion, students read a short passage to learn about herd immunity and how immunocompromised individuals rely on herd immunity for protection. Finally, students reflect on what steps they can take to protect themselves and their communities. Students’ comments about this activity include “My favorite part was when we were exchanging saliva. I got sick the first time but stayed healthy the second time! I felt it really represented how disease spread really works.”
Classroom implementation and effectiveness
Each of the five activities build on one another while covering different concepts, so we recommend that all five activities be implemented in the classroom. However, teachers can also select and adapt certain activities to meet their classroom needs and time constraints. Once all the materials are gathered, the activities can be used by multiple classes for many years. The self-guided nature allows teachers to take a step back and spend more time observing student learning and answering questions once the students have the kit in their hands. Guided by the Going Viral! instruction booklet, students solve problems, use models, perform experiments, and read passages that help them feel and act like real scientists.
Through pre- and post-surveys, we have evaluated the effectiveness of the Going Viral! kit (Table 6). The identical pre- and post-surveys contained two parts that assessed students’ actual and perceived knowledge, which shows both what students know and whether they feel like they understand the topic. For our knowledge-based assessment questions, we asked students to differentiate between bacteria and viruses, identify true and false statements about vaccines, and put the steps of the immune response in the correct order. Students scored well on the knowledge component of the pre-survey, indicating a relatively high background knowledge about the topics in the kit. Nevertheless, students performed better overall on the knowledge-based portion of the survey after finishing the Going Viral! kit. Additionally, we saw an increase in self-perceived knowledge of viruses, bacteria, and the immune system using a 1–5 Likert scale, in which 1 was Strongly Disagree and 5 was Strongly Agree. Students ranked their ability to identify differences between bacteria and viruses as significantly higher after completing the Going Viral! kit than they did before completing the kit. Furthermore, students felt that they better understood what an immune response was and how it works after completing the kit. Finally, students felt they knew more about how a vaccine helps protect them from becoming sick after completing the kit than they did before the kit. Overall, students’ perceived and actual knowledge about viruses, bacteria, vaccines, and the immune system increased after completing the Going Viral! kit.
Conclusion
The five learning activities from Going Viral! provide an engaging and memorable way to integrate topics into our science courses that will ultimately help increase the HL of our students. It is imperative that we begin to share this information with our students more regularly, as it will prepare them to make important decisions about their personal and community health. By teaching our students about microbes, vaccines, and the immune system, we are boosting their HL and helping them become part of a more confident and healthy population in the future.
Acknowledgments
Thank you, Sarah Bucko and Cathi Jacobs for providing invaluable suggestions and grade-level expertise during the initial stages of development of Going Viral! Special thank you to Mary-Pat Hulse and Christine Jasmann for bringing their students in to complete the kit and allowing us to take photos of this event. Funding to purchase kit materials for our version of Going Viral! was provided by our university’s Honors College through an Honors Thesis Improvement Grant and by the College of Natural Sciences Education and Outreach Center.
On the Web
Immune response board game cards
Printable immune response manipulatives
Card Sorting public domain images
Delaney Worthington (delaneywo@gmail.com) is a research assistant and Jennifer McLean is an associate professor in the Department of Microbiology, Immunology, and Pathology, Colorado State University, Fort Collins, CO. Andrew Warnock is Director, Mike Viney and Victoria Jordan are Teachers-in-Residence, Karina Hassell is a STEM Education Specialist, Lynne Judish is Lab Coordinator, and Courtney Butler is Assistant Director, all at the Natural Sciences Education and Outreach Center, Colorado State University, Fort Collins, CO.
Biology Crosscutting Concepts Curriculum Disciplinary Core Ideas General Science Inquiry Instructional Materials Labs Lesson Plans Life Science NGSS Pedagogy Phenomena Science and Engineering Practices STEM Teaching Strategies Three-Dimensional Learning High School