
special issue
Right Under Our Noses
GIS Exploration of COVID-19 and Air Quality
The Science Teacher—January/February 2023 (Volume 90, Issue 3)
By Latesia Coleman and Heather O’Leary

The COVID-19 pandemic presents an extraordinary opportunity for educators and researchers to engage students in applying STEM techniques in everyday life situations. Students gain confidence in math practices when engaging in tasks that allow them to analyze and discuss real topics, integrate advanced technology, and experience interdisciplinary instruction. Students are also increasingly motivated to master challenging statistical and mathematic analysis when it connects to their everyday social mediascape, particularly when using popular platforms.
Social justice mathematics lessons (SJMLs) promote reflections about mathematics and social issues and contextualize math concepts in a complementary way (Berry et al. 2020). Increasingly, secondary students face the systemic racism and sexism that exists in organizations, city programs, and diversity initiatives, ironically challenging their critical thinking but without formal instruction to root these in applied science and mathematics.
COVID-19 has reasserted the power geometries of offices, retail businesses, and public spaces in urban areas as lockdowns have halted typical spatial relations between labor and identity. It has magnified the structural disparities that impact Black, Indigenous, and People of Color (BIPOC), and women by changing relations to their cities through formal economic labor, civic duties, and domestic care work. Students are on the cusp of grasping these implications through scientific inquiry and independent data-driven reasoning.
In this lesson, students examine the challenges faced by marginalized populations amid the COVID-19 pandemic regarding monetary impact, unemployment, day-to-day errands, wearing masks in public, and health inequities. Investigating the intersections of race and class can reveal the underlying inequalities that exist in our communities—as well as the multiple meanings, or “multivocality,” of casual science claims.
Humanistic social scientists demonstrate how multivocality is not a liability but an interdisciplinary tool. Humanistic-STEM (H-STEM) approaches deepen higher-level thinking skills and problem solving, and increase retention. These social scientists frame H-STEM projects in terms of “blending” (Bourdeau and Wood 2019), adding “creativity, contextual perspective, [and] curiosity,” (Hamman 2013), integrating “flexibility and adaptability in thinking” (Paul and Binker 1990), and nurturing an applied “interest in and concern for human affairs, welfare, values, or culture” (Faulconer et al. 2020). This lesson engages students in discussions that evaluate interdisciplinary data about how COVID-19 impacts their local community and how science can help improve our responses to the virus.
The unit
- Total Lesson Time: 8 days (Figure 1; see Online Connections)
- Lesson Vocabulary: geospatial analysis, COVID-19, geographic information systems (GIS), humanities, story maps, data visualizations, geospatial inquiry, ESRI, SJML
Days 1–2: Engage
Part 1: Air quality and environmental justice
To introduce how socioeconomic status affects the physical aspects of exposure to differing air-quality levels, students used an anthropological technique of comparison to “make the strange familiar and the familiar strange.” Students analyzed a New York Times story revealing the air-quality inequities of two teens residing in India: “Who Gets to Breathe Clean Air in New Delhi?” For 25 minutes, students interact with the website and reflect on paper:
- One new and interesting fact that they encountered in the article about air quality,
- How they think the information might relate to air quality in the United States, and
- What, if anything, they think we could do to help increase awareness about these types of environmental disparities.
For the next 35 minutes, students search online for articles about air quality and environmental justice in the area near our school’s location. They each select one article to email to the instructor and share in our class discussions or reflections about air-quality issues closer to home. Table 1 (see Online Connections) contains a column with samples of some actual student responses to these discussion prompts.
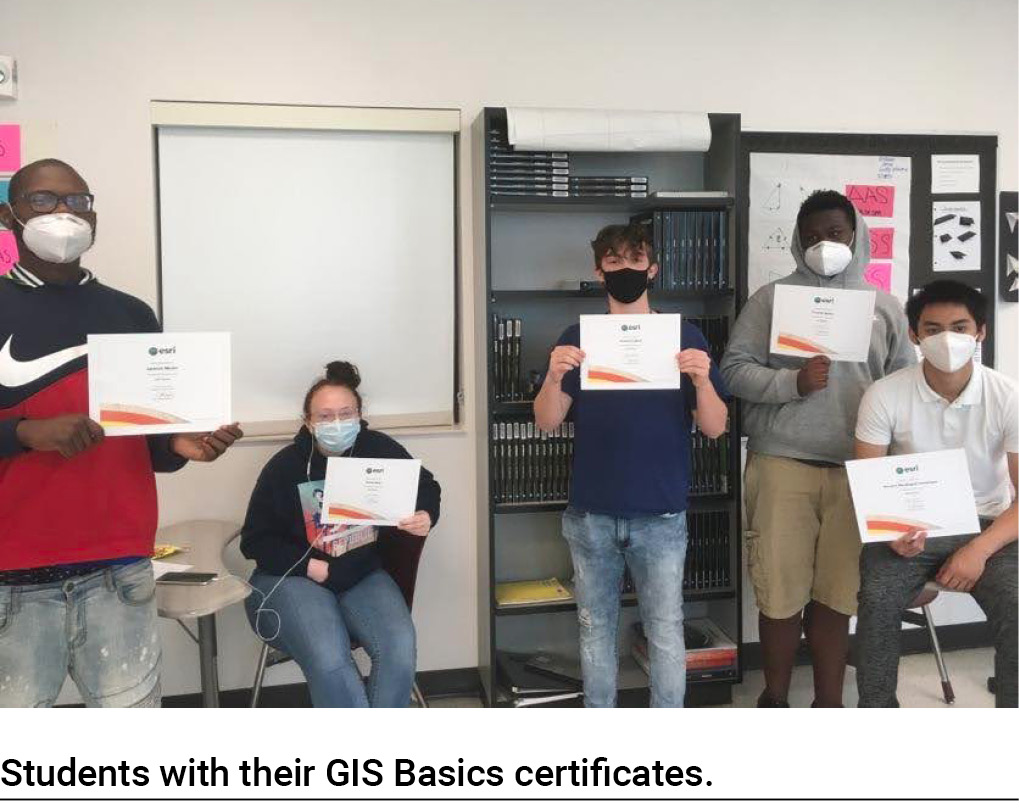
Part 2: Learning about geospatial technology
For 55–70 minutes, students explore the ESRI ArcGIS website to learn about geospatial technology. They begin the GIS BASICS web course and complete it for their GIS BASICS certification (www.esri.com/training/catalog/5d9cd7de5edc347a71611ccc/gis-basics). The Introduction to GIS consists of a 15-minute PowerPoint to provide context for GIS as a tool and examples of potential uses of GIS applied to community COVID-19 data. Students watch the Community COVID-19 Tracing Video at www.youtube.com/watch?v=QKQFRY4YlJ4&list=WL&index=51&t=0s as an example of how GIS is used by public health agencies. During the video and direct instruction, students use journals for (text and pictorial) notes. ESRI provides up to 1,000 free student GIS accounts to educators.
Days 3–4: Mapping geospatial data
Following this introduction to the lesson, students are ready for independent workdays. They receive checklists (Table 2; see Online Connections) as guides for their geospatial inquiry and production of story maps. Students use the timeline, checklist, planning sheets, and step-by-step GIS Financial Literacy tool to begin designing their investigations, explore COVID-19 data online, and form hypotheses about what their school surveys will reveal. For this exercise, students interpret economic or political memes, social media posts, or mainstream news stories connected to COVID-19 in the local area. To ensure internet safety during these digital quests, this lesson uses classroom guidelines and videos from Common Sense Education’s news and media literacy courses (www.commonsense.org/education/articles/news-media-literacy-101).
Once students select the compelling digital cultural artifact that will drive their inquiry, they design their investigation. Students research the initial guiding question(s): Are there workers acutely impacted by the COVID-19 recession? What profound effects on populations can researchers identify using GIS? What strategies can policy makers use to safeguard the communities negatively affected during the recovery? Then students work on collecting air-quality data and telling their emerging stories using GIS technology.
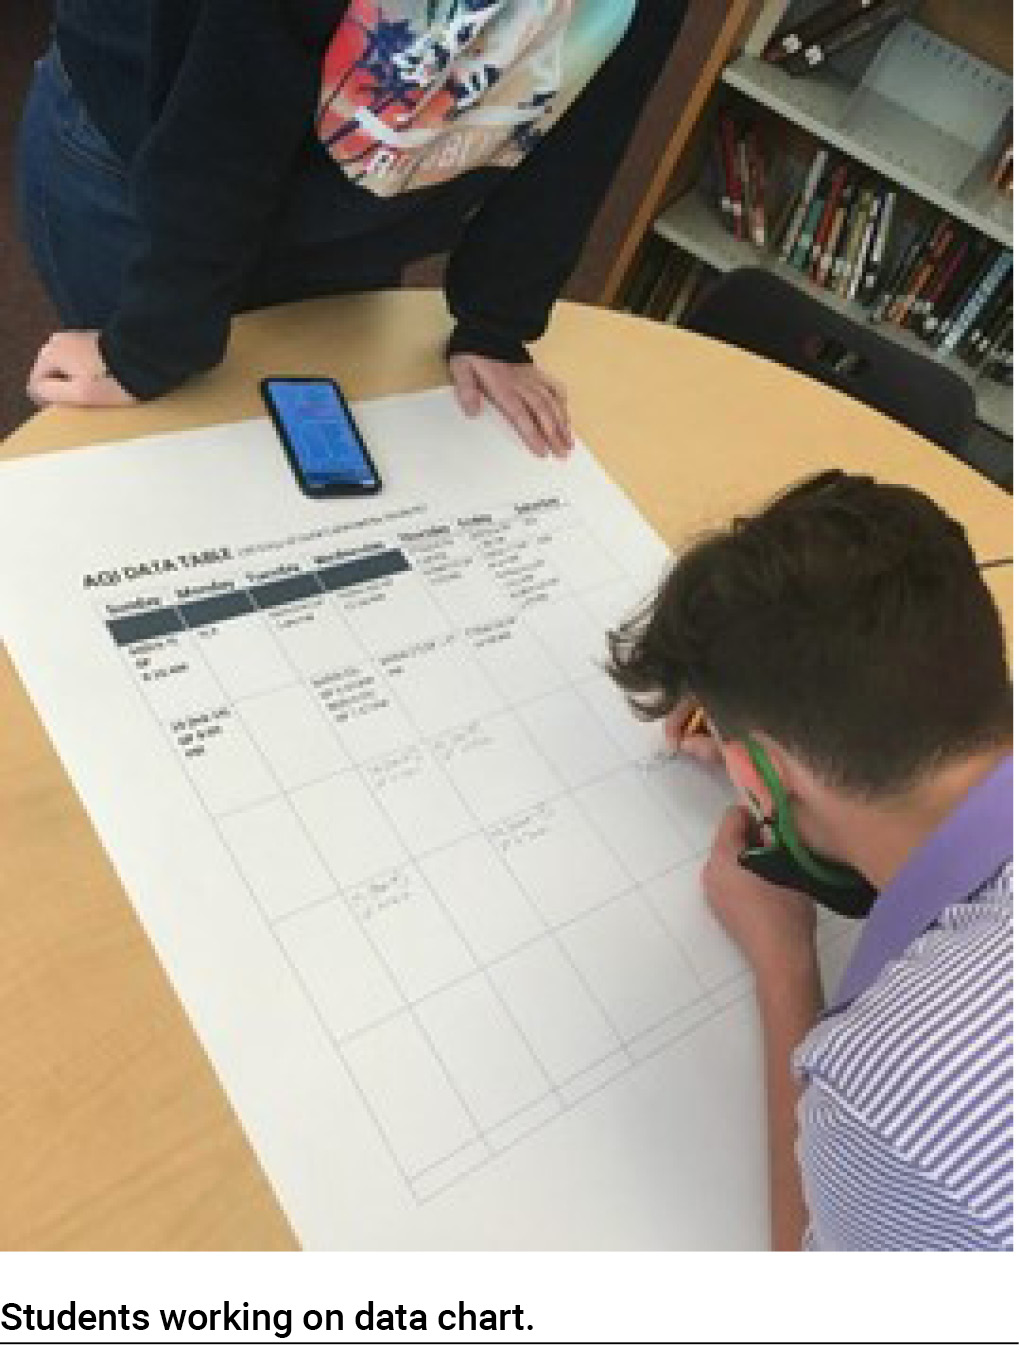
Day 5: Data visualizations
Students create an original data visualization to include in their story map. The data from real-time air quality index reports are available on every cell phone, and students decided to record it on a calendar to chart in Excel. As students realized the air-quality readings were slightly different depending on what area of the city they were in, they decided to randomly collect data from two separate locations in our town. Students collected data for several days before plotting it on a table to be used for data visualization for their microblogs/GIS story maps. Students used key mathematics vocabulary (e.g., outliers, mean) on their visualizations and explained and justified their decisions on communicating their data in their reflections or journals. Students had a brief lesson on data visualizations that reviewed the most appropriate graphs for communicating specific data types (Table 3; see Online Connections).
Sample formative questions
- What is GIS? What are some of the ways it can be used to help with research?
- Define Geospatial Inquiry in your own words.
- What is one way that GIS can be/is used to obtain COVID-19 data?
- Define Story Mapping in your own words.
- Identify one reason story mapping can be more effective in outlining your project than a typed outline in MS Word.
- What is the difference between a claim and reasoning?
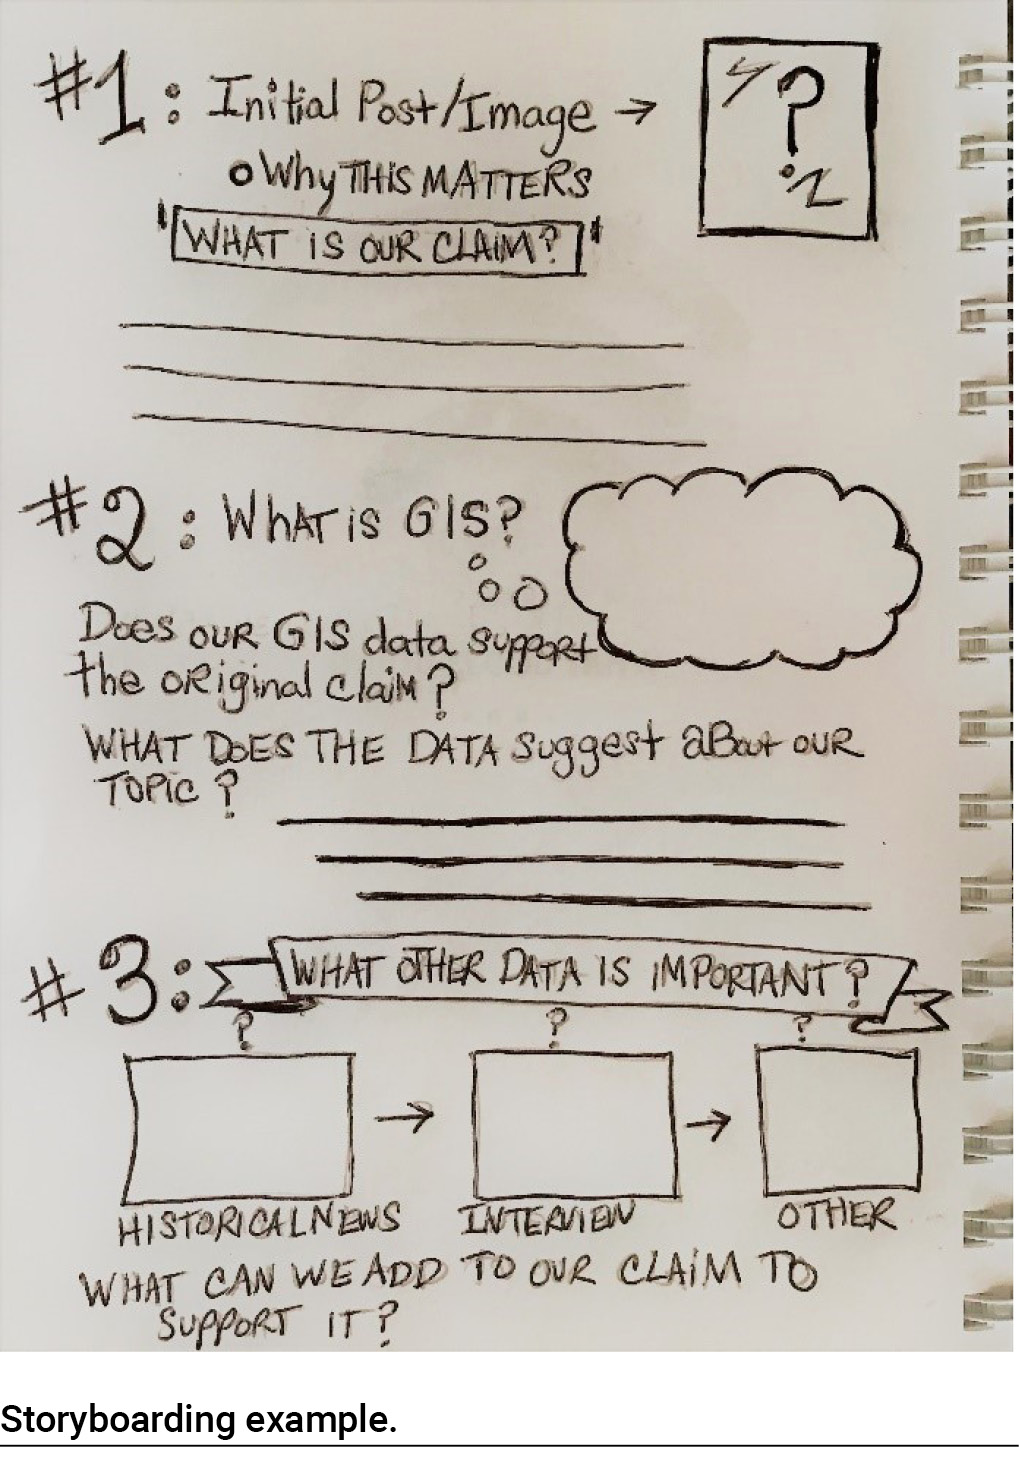
Days 6–7: Storyboarding and story map
GIS storyboarding is a technique used for visually constructing ideas during planning stages to display idea relationships (see Online Connections). Storyboarding in the classroom also provides a dimension of universal learning design—or flexible learning—to help students plan, visually organize, and lay out the elements they have gathered/produced.
Students can use visual outlines as an engagement strategy. The ESRI storyboarding blog (see Online Connections) provides an example of how to incorporate GIS story maps. Students can initially complete their blog posts as an Office 365 document that explains their claim and displays their data prior to creating a GIS story map layout.
Our classroom joined virtual meetings by partnering with local university faculty and a research team who embraced our students as junior researchers. The meeting discussions lasted 35–45 minutes and were perfect for allowing students to ask questions and process new concepts associated with conducting research. Student-driven question categories included subject expertise, scientific task performance, ethical navigation, and civic engagement.
In place of the meetings, students can explore GIS independently and learn more specifics about particulate matter (PM 2.5), which was introduced to students during the slides presented in the geospatial technology lesson. Particulate matter in our air can cause more severe reactions to COVID-19.
A newer student in our class took a particular interest in PM 2.5, looking up its primary chemical compounds. After identifying the presence of sulfate (SO42_) particles in our local breathing air, he focused his story map on these potentially harmful particles. With ArcGIS, students could search for maps containing PM 2.5 data worldwide and use them to form their own hypotheses using air-quality data from those regions.
Students compared data on COVID-19 cases and SO42_ in the United Kingdom to discover a spatial correlation. Other students decided to address the inequities and environmental racism present in the data and articles we found. Students were concerned that COVID-19 had been made worse for lower income residents in our area and wanted to discuss solutions for how we could improve air quality for these more vulnerable groups. Their solutions-oriented queries demonstrated a new curiosity and commitment to civic involvement using science and mathematics.
Day 8: Evaluate
Students used the rubric (Table 4; see Online Connections) to assess the final presentations as a group. The rubric incorporates the principles of scientific inquiry, visual composition, and participation to evaluate student mastery. Brief formative assessments were administered on the new vocabulary and concepts and graded separately on the checklist. Journals were evaluated for accurate notes and storyboarding. The final assessment can include the student checklists (Table 2) of items as they become due on the instructor’s timeline.
Extension
Students can enhance their posts with an original three- to five-minute podcast or video to document their processes of scientific exploration and data analysis that reflect on local implications or their role as scientific investigators. Letter writing and petitioning legislators are additional ways students can take community action if motivated to do so.
Conclusion
Using geospatial technologies such as GIS in the classroom allows students to engage in authentic scientific practices such as making meaningful observations and forming conclusions about scientific issues (Kulo and Bodzin 2013). The six attributes of the geospatial inquiry process are examine data, ask questions, acquire additional data, analyze and interpret data, argue from evidence, and revise arguments (Nolan et al. 2019). During this lesson, students perform these tasks to form conclusions about the inequities integrated in our structures and how they parallel resulting data from research in the rest of the world. The unit combines economic, historical, and real-time data analysis for fact-based conclusions and informed student presentations.
Teaching science and mathematics for social justice provides students with the tools they need to confront issues of injustice in their local and global communities today and in the future. Beyond the context of COVID-19, there are many opportunities for enhancing instruction with SJMLs. Data related to education, occupations, personal ancestry, and voting records can be easily accessed online and incorporated (Leonard 2020). Also, the stories and counter-stories of underrepresented groups can be problematized and integrated into daily lessons to increase inclusion and engagement. This is a critical step forward at a time when big data, algorithms, and machine learning demonstrate social and racial bias—and likewise, at a crucial moment in our STEM pipeline for not only retaining diverse thinkers but allowing them to discover their own investment in a socially just science that is sometimes literally right under our noses.
Online Connections
Figure 1. COVID-19 air quality lesson plan: https://bit.ly/3vEmpbo
Table 1. Student responses: https://bit.ly/3OrWvQF
Table 2. Student checklist: https://bit.ly/3TWlxsf
Table 3. Data visualizations: https://bit.ly/3ExBU8W
Table 4. Rubric: https://bit.ly/3AzGnXy
Appendixes 1–4: https://bit.ly/3TZu51M
ArcGIS software: www.arcgis.com.
ERSI community contact tracing video: www.youtube.com/watch?v=QKQFRY4YlJ4&list=WL&index=51&t=0s
ERSI Story mapping guide from blog: https://bit.ly/3tRwBfK
Latesia Coleman (latesia.d.coleman@vanderbilt.edu) is Testing Coordinator at Vanderbilt University, Nashville, TN, and Heather O’Leary is Professor of Anthropology and Director of EcoFem Lab at the University of South Florida, Tampa, FL.
5E Citizen Science Equity Inquiry Interdisciplinary Lesson Plans News Research STEM Technology High School